. 2023 Oct 10;14(10):660.
doi: 10.1038/s41419-023-06187-z.

Aldolase B-driven lactagenesis and CEACAM6 activation promote cell renewal and chemoresistance in colorectal cancer through the Warburg effect

Affiliations

Aldolase B-driven lactagenesis and CEACAM6 activation promote cell renewal and chemoresistance in colorectal cancer through the Warburg effect

Yu-De Chu et al. Cell Death Dis. .

Abstract

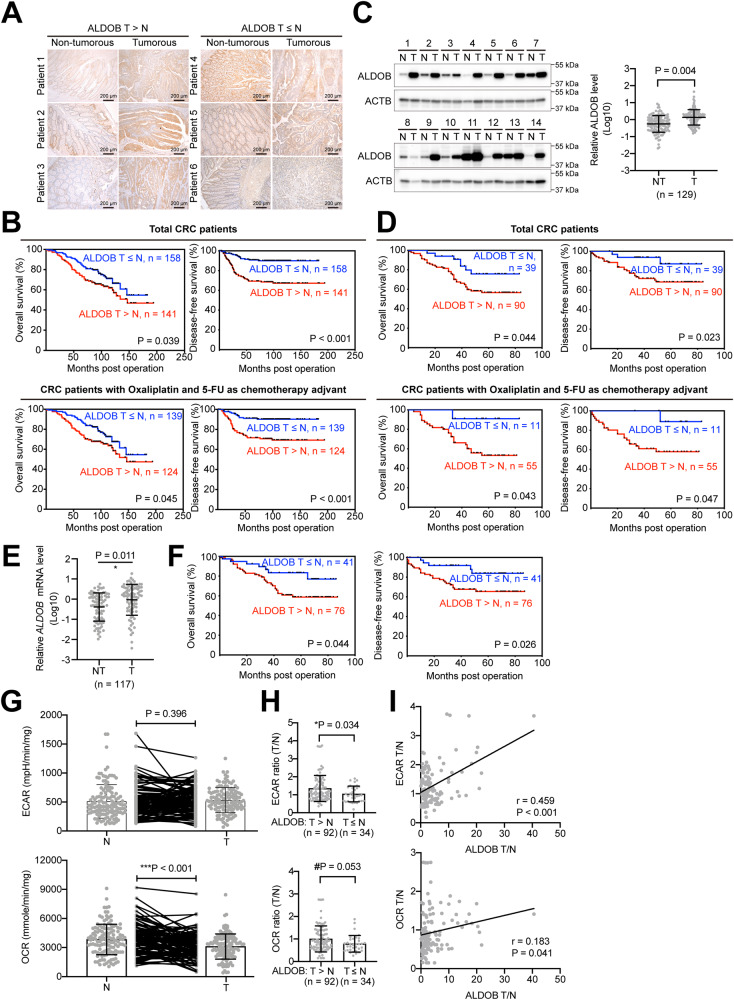
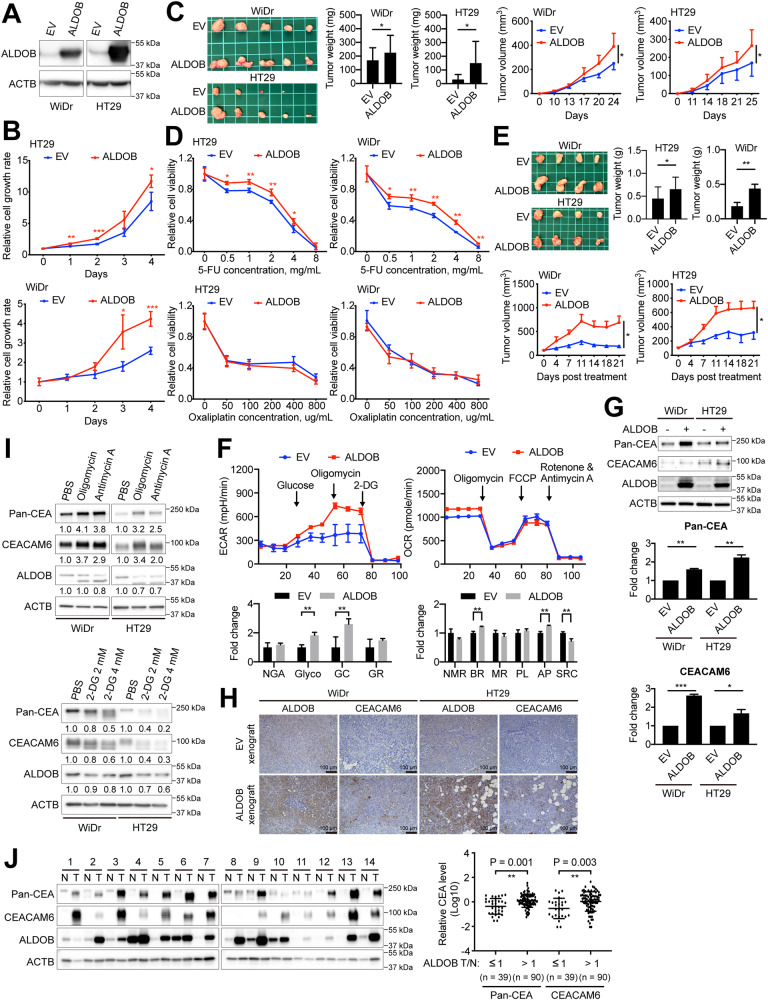
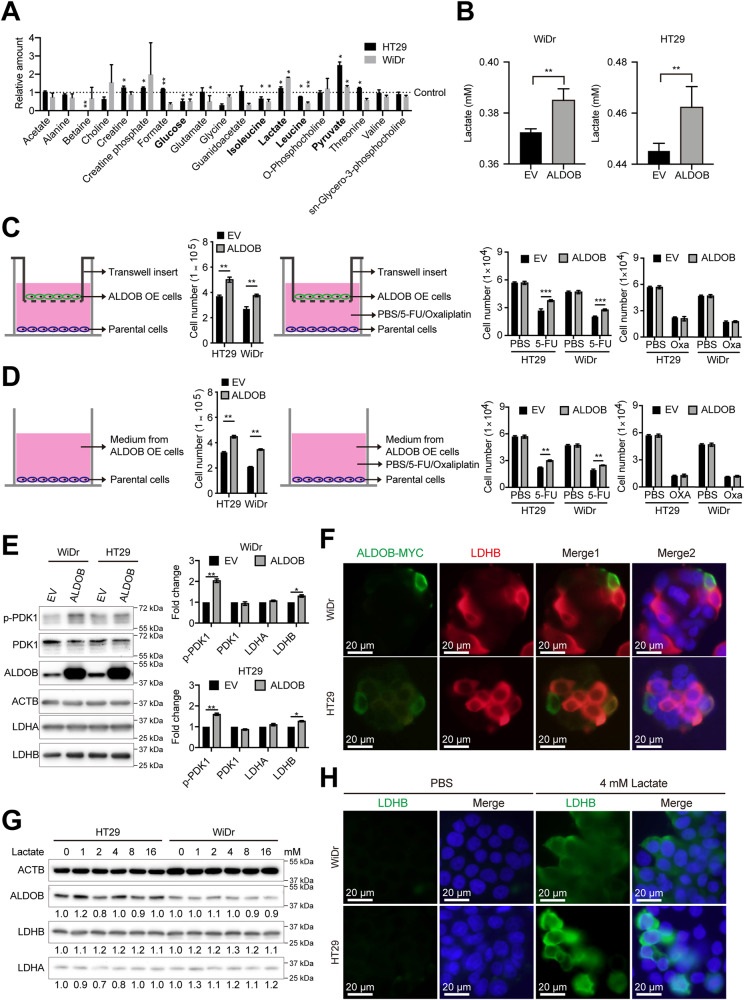
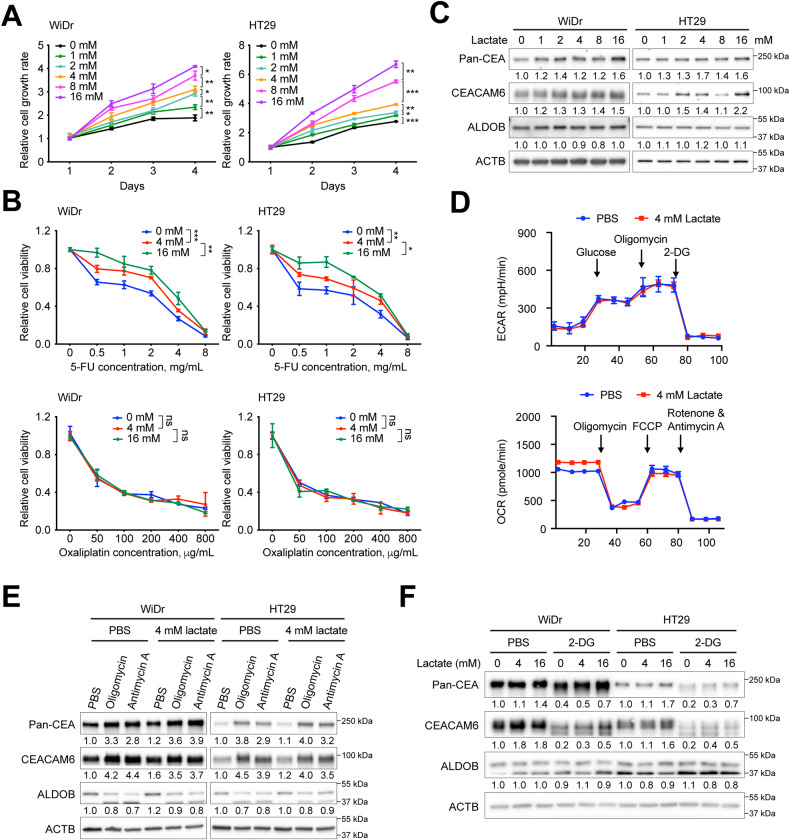
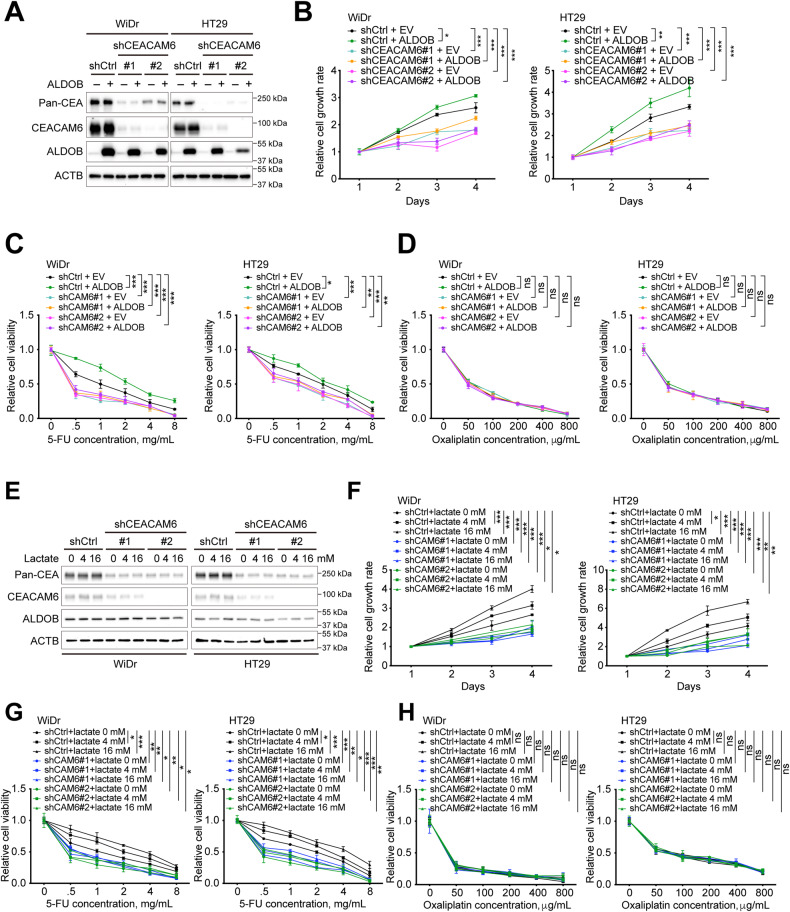
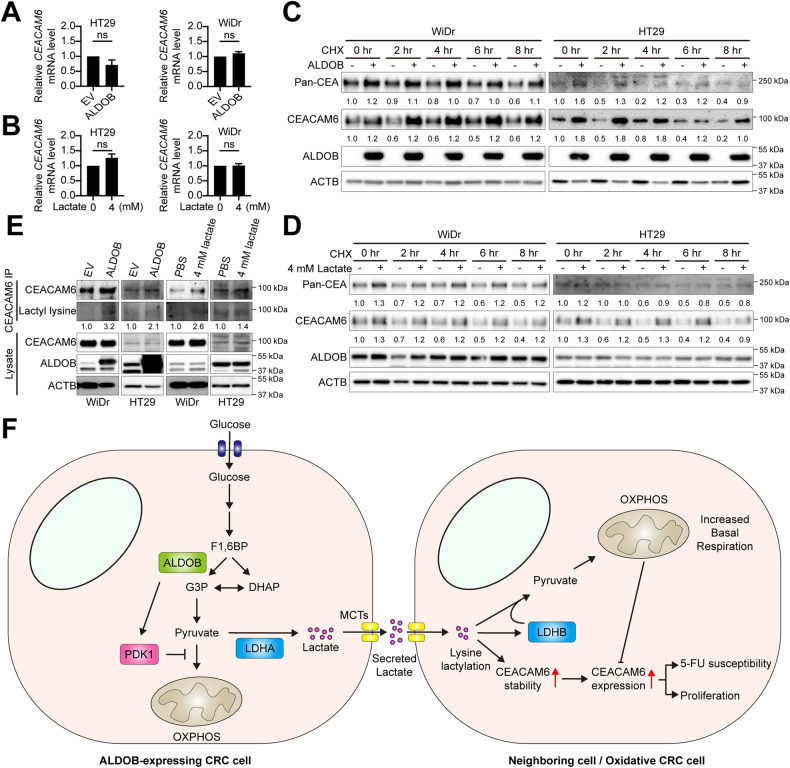
Colorectal cancer (CRC) is a prevalent malignancy worldwide and is associated with a high mortality rate. Changes in bioenergy metabolism, such as the Warburg effect, are often observed in CRC. Aldolase B (ALDOB) has been identified as a potential regulator of these changes, but its exact role in CRC cell behavior and bioenergetic homeostasis is not fully understood. To investigate this, two cohorts of CRC patients were analyzed independently. The results showed that higher ALDOB expression was linked to unfavorable prognosis, increased circulating carcinoembryonic antigen (CEA) levels, and altered bioenergetics in CRC. Further analysis using cell-based assays demonstrated that ALDOB promoted cell proliferation, chemoresistance, and increased expression of CEA in CRC cells. The activation of pyruvate dehydrogenase kinase-1 (PDK1) by ALDOB-induced lactagenesis and secretion, which in turn mediated the effects on CEA expression. Secreted lactate was found to enhance lactate dehydrogenase B (LDHB) expression in adjacent cells and to be a crucial modulator of ALDOB-mediated phenotypes. Additionally, the effect of ALDOB on CEA expression was downstream of the bioenergetic changes mediated by secreted lactate. The study also identified CEA cell adhesion molecule-6 (CEACAM6) as a downstream effector of ALDOB that controlled CRC cell proliferation and chemoresistance. Notably, CEACAM6 activation was shown to enhance protein stability through lysine lactylation, downstream of ALDOB-mediated lactagenesis. The ALDOB/PDK1/lactate/CEACAM6 axis plays an essential role in CRC cell behavior and bioenergetic homeostasis, providing new insights into the involvement of CEACAM6 in CRC and the Warburg effect. These findings may lead to the development of new treatment strategies for CRC patients.


Conflict of interest statement

The authors declare no competing interests.

Figures

Fig. 1
Fig. 1. Upregulation of ALDOB in CRC is associated with unfavorable postoperative prognosis and bioenergetic changes.
A Representative IHC sections used to score ALDOB intensity in CRC in nontumor or tumor areas. B Kaplan–Meier analysis of prognosis in CRC patients, overall (n = 299, upper panel) or treated with chemotherapy (n = 263, lower panel), stratified from the ratio of ADLOB expression intensities in nontumor and tumor areas derived from (A). C Representative Western blots of ALDOB in both nontumor and tumor tissues. Signal intensities obtained from Western blots were statistically summarized in the right panel. D Kaplan–Meier analysis of prognosis in CRC patients, overall (n = 129, upper panel) or treated with chemotherapy (n = 66, lower panel), stratified by the ratio of ADLOB expression levels in nontumor and tumor. E Statistical analysis of relative ALDOB mRNA levels in nontumor and tumor tissues (n = 117) from the real-time quantitative polymerase chain reaction. F Kaplan–Meier analysis of prognosis in CRC patients (n = 117), stratified by the ratio of ADLOB mRNA levels in nontumor and tumor. G Extracellular acidification rate (ECAR) and oxygen consumption rate (OCR) obtained using the Seahorse assay. H Statistical analysis of bioenergetic changes in CRC patients with high or low tumor ALDOB expression. I Pearson’s analysis of the correlation between ALDOB expression and bioenergetic changes in CRC.
Fig. 2
Fig. 2. Elevated ALDOB promotes cell growth, 5-FU chemoresistance, CEA expression, and bioenergetic changes in CRC.
A Representative Western blots showing ALDOB overexpression in CRC, WiDr and HT29 cells. B Cell proliferation assay conducted on cells with or without ALDOB overexpression. C Left: Xenografts originating from nude mice after subcutaneous injection of cells with or without ALDOB overexpression. Middle: Comparison of tumor weights. Right: Estimated tumor volume over time for each group. Two-tailed unpaired Student’s t-test utilized for xenograft comparison. D Cell viability response to 5-FU and Oxaliplatin treatment. E Upper left: Xenografts derived from nude mice intratumorally injected with 5-FU. Upper right: Comparison of tumor weights. Lower: Estimated tumor volume over time for each group. Two-tailed unpaired Student’s t-test used for xenograft comparison. F Extracellular acidification rate (ECAR) and oxygen consumption rate (OCR) of cells with or without ALDOB overexpression obtained using the Seahorse assay. G Representative Western blots demonstrating CEACEM6 and pan-CEA levels upon ALDOB overexpression in CRC cells. The statistical analysis is shown in the lower panels. H Immunohistochemical staining of ALDOB and CEACAM6 in xenograft tissues from (C). I Representative western blots showing CEACEM6 and pan-CEA levels after the addition of inhibitors of the oxidative phosphorylation (OXPHOS) or the glycolytic pathway in CRC cells. J Levels of CEACAM6 and pan-CEA in nontumor and tumor tissues from CRC patients. The statistical analysis is displayed in the right panel. All P values were obtained using the paired two-tailed Student’s t-test. *P < 0.05; **P < 0.01; ***P < 0.001.
Fig. 3
Fig. 3. ALDOB-mediated lactagenesis promotes cell growth, 5-FU chemoresistance and LDHB expression through PDK1 activation.
A Metabolomic analysis based on nuclear magnetic resonance (NMR) showing metabolite levels in CRC cells with or without ALDOB overexpression. Black dashed lines indicate relative metabolite levels in control-treated cells. B Lactate levels in medium from cells with control or ALDOB overexpression. C Transwell-based co-culture system for assessment of cell growth (left panel) and chemoresistance (right panels). D Supplementation of medium from cells with or without ALDOB overexpression for assessment of cell proliferation (left panel) and chemoresistance (right panels). E Western blots demonstrating levels of the indicated proteins in cells with or without ALDOB overexpression. The statistical analysis is displayed in the right panel. F Immunofluorescence assay showing the expression of exogenous ALDOB (ALDOB-MYC) and LDHB in CRC cells transfected with ALDOB expression plasmid. The scale bar represents 20 μm. G Western blots showing the levels of the indicated proteins in cells treated with different concentrations of lactate. H Immunofluorescence assay showing LDHB expression in CRC cells treated with indicated concentrations of lactate. The scale bar represents 20 μm. All P values were obtained using the paired two-tailed Student’s t-test. *P < 0.05; **P < 0.01; ***P < 0.001.
Fig. 4
Fig. 4. Extracellular lactate promotes cell growth, 5-FU chemoresistance, CEA expression and bioenergetic alterations in CRC.
The A cell proliferation and B cell viability assays were performed using Alarmar blue-based assay. P values were obtained using the two-way ANOVA. *P < 0.05; **P < 0.01; ***P < 0.001. C Representative Western blots showing the indicated protein levels in cells with different lactate concentrations. D Extracellular acidification rate (ECAR) and oxygen consumption rate (OCR) of cells with and without ALDOB overexpression obtained using the Seahorse assay. Representative Western blots showing the indicated protein levels upon simultaneous addition of lactate and inhibitors of E the oxidative phosphorylation (OXPHOS) or F the glycolytic pathway in CRC cells.
Fig. 5
Fig. 5. CEACAM6 is an ALDOB/lactate downstream effector regulating cell growth and 5-FU chemoresistance in CRC.
A Representative Western blots showing the indicated protein levels in CRC cells with or without ALDOB overexpression and CEACAM6 silencing. The B cell proliferation and C, D cell viability assays were performed using Alarmar blue-based assay. P values were obtained using the two-way ANOVA. *P < 0.05; **P < 0.01; ***P < 0.001. E Representative Western blots showing the indicated protein levels in CRC cells with or without lactate treatment and CEACAM6 silencing. The F cell proliferation and G, H cell viability assays were performed using Alarmar blue-based assay. All P values were obtained using the two-way ANOVA. *P < 0.05; **P < 0.01; ***P < 0.001.
Fig. 6
Fig. 6. ALDOB-mediated lactagenesis boosts CEACAM6 expression by enhancing protein stability through inducing lysine lactylation.
A, B Statistical analysis of relative CEACAM6 mRNA levels in cells with and without ALDOB overexpression or lactate treatment. P values calculated using the two-tailed paired Student’s t-test. *,P < 0.05; **P < 0.01; ***P < 0.001. C, D Representative Western blotting illustrating indicated protein levels in CRC cells with or without ALDOB overexpression or lactate treatment under cycloheximide (CHX) treatment. E Representative Western blotting showing indicated protein levels in CEACAM6 immunoprecipitates or lysates. F The working model proposed in this study. High ALDOB expression in CRC cells activates PDK1, which inhibits the entry of pyruvate into oxidative phosphorylation (OXPHOS) and enhances lactate conversion by LDHA. The excess lactate is then secreted into the tumor microenvironment and taken up by neighboring cells, inducing the expression of LDHB and CEACAM6. For CEACAM6, it is possible that the elevation is through lysine lactylation. LDHB increases the conversion of lactate to pyruvate, enabling neighboring cells to become OXPHOS-dependent. CEACAM6, as an ALDOB/lactate downstream effector, regulates cell growth and 5-FU chemoresistance in CRC.

References

    1. Sung H, Ferlay J, Siegel RL, Laversanne M, Soerjomataram I, Jemal A, et al. Global Cancer Statistics 2020: GLOBOCAN estimates of incidence and mortality worldwide for 36 cancers in 185 countries. CA Cancer J Clin. 2021;71:209–49. doi: 10.3322/caac.21660. - DOI - PubMed
    1. Xie YH, Chen YX, Fang JY. Comprehensive review of targeted therapy for colorectal cancer. Signal Transduct Target Ther. 2020;5:22. doi: 10.1038/s41392-020-0116-z. - DOI - PMC - PubMed
    1. Schmitt M, Greten FR. The inflammatory pathogenesis of colorectal cancer. Nat Rev Immunol. 2021;21:653–67. doi: 10.1038/s41577-021-00534-x. - DOI - PubMed
    1. Armaghany T, Wilson JD, Chu Q, Mills G. Genetic alterations in colorectal cancer. Gastrointest Cancer Res. 2012;5:19–27. - PMC - PubMed
    1. Isidoro A, Martínez M, Fernández PL, Ortega AD, Santamaría G, Chamorro M, et al. Alteration of the bioenergetic phenotype of mitochondria is a hallmark of breast, gastric, lung and oesophageal cancer. Biochem J. 2004;378:17–20. doi: 10.1042/bj20031541. - DOI - PMC - PubMed

Publication types