. 2023 Oct 10;14(1):6325.
doi: 10.1038/s41467-023-41369-5.

SARS-CoV-2 genomic surveillance in wastewater as a model for monitoring evolution of endemic viruses

Affiliations

SARS-CoV-2 genomic surveillance in wastewater as a model for monitoring evolution of endemic viruses

Mukhlid Yousif et al. Nat Commun. .

Abstract

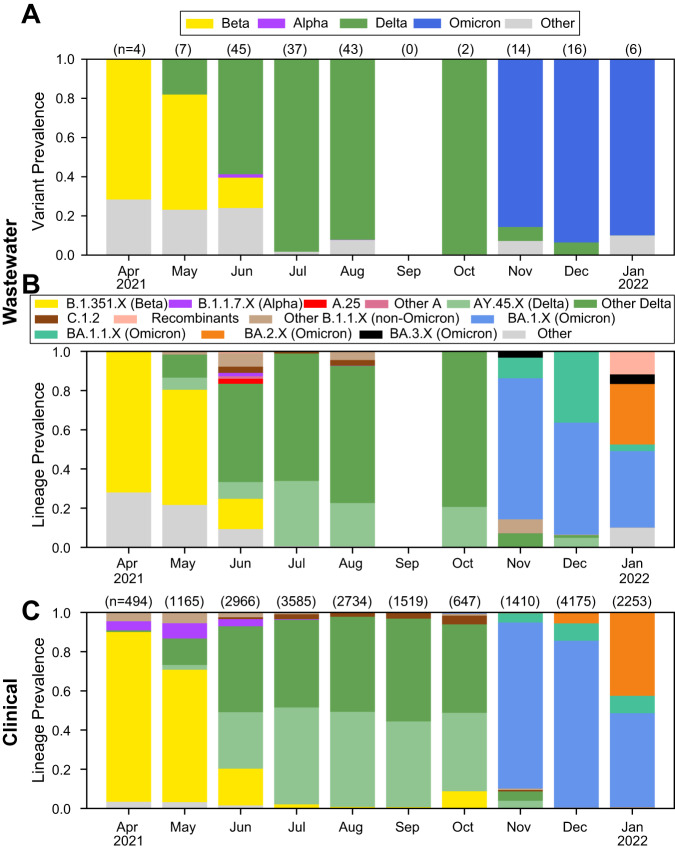
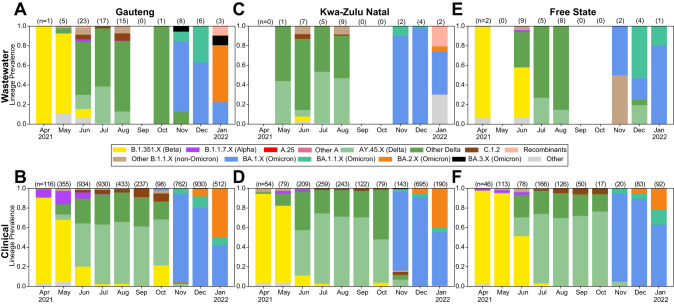
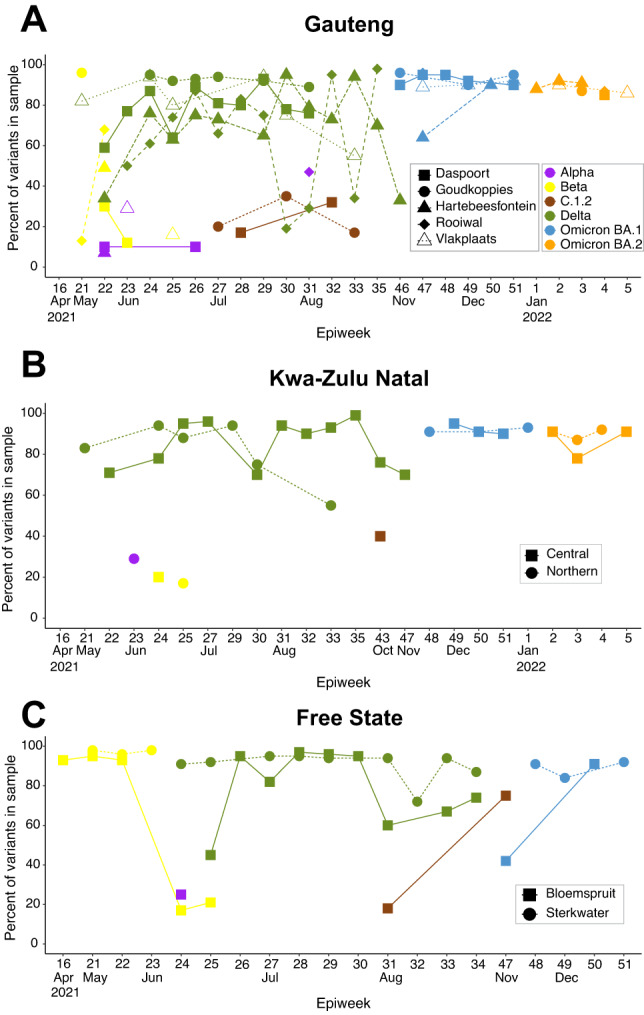
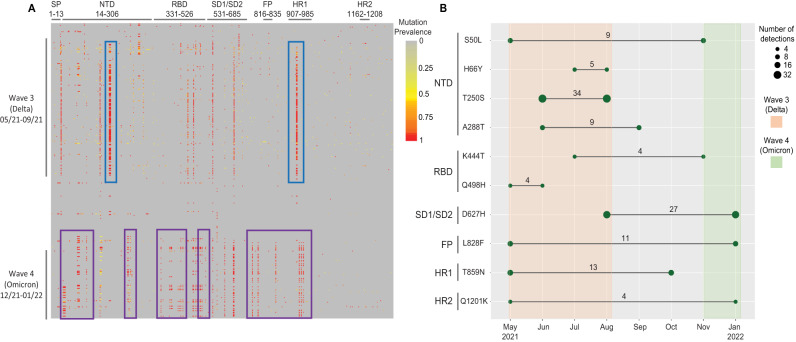
As global SARS-CoV-2 burden and testing frequency have decreased, wastewater surveillance has emerged as a key tool to support clinical surveillance efforts. The aims of this study were to identify and characterize SARS-CoV-2 variants in wastewater samples collected from urban centers across South Africa. Here we show that wastewater sequencing analyses are temporally concordant with clinical genomic surveillance and reveal the presence of multiple lineages not detected by clinical surveillance. We show that wastewater genomics can support SARS-CoV-2 epidemiological investigations by reliably recovering the prevalence of local circulating variants, even when clinical samples are not available. Further, we find that analysis of mutations observed in wastewater can provide a signal of upcoming lineage transitions. Our study demonstrates the utility of wastewater genomics to monitor evolution and spread of endemic viruses.


Conflict of interest statement

All authors declare no competing interests.

Figures

Fig. 1
Fig. 1. Nationwide wastewater and clinical genomic surveillance in South Africa.
The prevalence of VOCs (A) and lineages (B) by month from wastewater samples, from April 2021 to January 2022 estimated using the Freyja tool. Only samples with sequence coverage of >50% were included. C Nationwide clinical genomic surveillance trends over the same period.
Fig. 2
Fig. 2. Province-level virus population dynamics.
Wastewater lineage dynamics estimated using Freyja (top row) and clinical genomic surveillance (bottom row) from Gauteng (A, B), KwaZulu-Natal (C, D), and Free State (E, F) provinces.
Fig. 3
Fig. 3. Signature mutation analysis recovers variant waves.
Frequency of signature mutations associated with each variant per epidemiological week, for Gauteng (A), KwaZulu-Natal (B), and Free State (C) provinces. Signature mutations corresponding to each variant are described in Table S3.
Fig. 4
Fig. 4. Analyses of amino acid mutations observed in wastewater.
A Heatmap of amino acid mutations distributed across the SARS-CoV-2 spike protein in comparison with the Wuhan reference strain, arranged vertically in chronological order. Each row represents a sample, organized by the date of sample collection from earliest (top) to most recent (bottom). Each column represents an amino acid position of the spike protein annotated by region. The blue rectangle represent mutations were dominate during the third wave at the NTD and HR1, which disappeared during the fourth wave, and the purple rectangle represent new mutations introduced during the fourth wave at the SP, NTD, RBD, subdomains (SD1/SD2), FP, and HR1. B Dot plot showing the uncommon mutations of SARS-CoV-2 detected in wastewater during the period April 2021 – January 2022 and their prevalence. Each row represents specific uncommon mutations, located in the named portion of the spike protein. The x-axis represents the periods (months) and the lines bounded by shaded circles indicate the times at which the mutations were first and last observed (as represented by a continuous line between the dates). The size of the shaded circles in each row represents the number of times the mutation was observed in the collected samples.

References

    1. Jones DL, et al. Shedding of SARS-CoV-2 in feces and urine and its potential role in person-to-person transmission and the environment-based spread of COVID-19. Sci. Total Environ. 2020;749:141364. doi: 10.1016/j.scitotenv.2020.141364. - DOI - PMC - PubMed
    1. Vaselli NM, et al. Investigation of SARS-CoV-2 faecal shedding in the community: a prospective household cohort study (COVID-LIV) in the UK. BMC Infect. Dis. 2021;21:784. doi: 10.1186/s12879-021-06443-7. - DOI - PMC - PubMed
    1. Miura F, Kitajima M, Omori R. Duration of SARS-CoV-2 viral shedding in faeces as a parameter for wastewater-based epidemiology: Re-analysis of patient data using a shedding dynamics model. Sci. Total Environ. 2021;769:144549. doi: 10.1016/j.scitotenv.2020.144549. - DOI - PMC - PubMed
    1. Peng L, et al. SARS‐CoV‐2 can be detected in urine, blood, anal swabs, and oropharyngeal swabs specimens. J. Med. Virol. 2020;92:1676–1680. doi: 10.1002/jmv.25936. - DOI - PMC - PubMed
    1. WHO. Environmental surveillance for SARS-COV-2 to complement public health surveillance – Interim Guidance. https://www.who.int/publications/i/item/WHO-HEP-ECH-WSH-2022.1 (2022).

Publication types

Supplementary concepts