

The accumulation of erythrocytes quantified and visualized by Glycophorin C in carotid atherosclerotic plaque reflects intraplaque hemorrhage and pre-procedural neurological symptoms
- PMID: 37816779
- PMCID: PMC10564864
- DOI: 10.1038/s41598-023-43369-3
The accumulation of erythrocytes quantified and visualized by Glycophorin C in carotid atherosclerotic plaque reflects intraplaque hemorrhage and pre-procedural neurological symptoms
Abstract
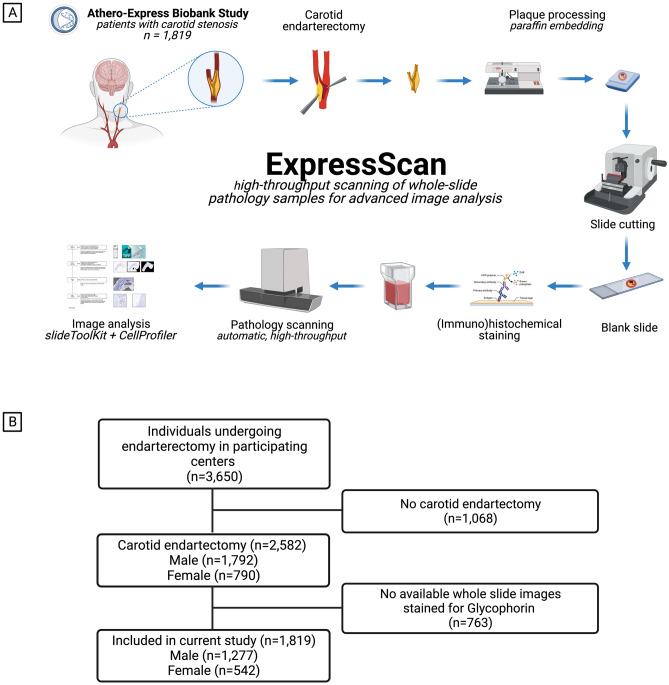
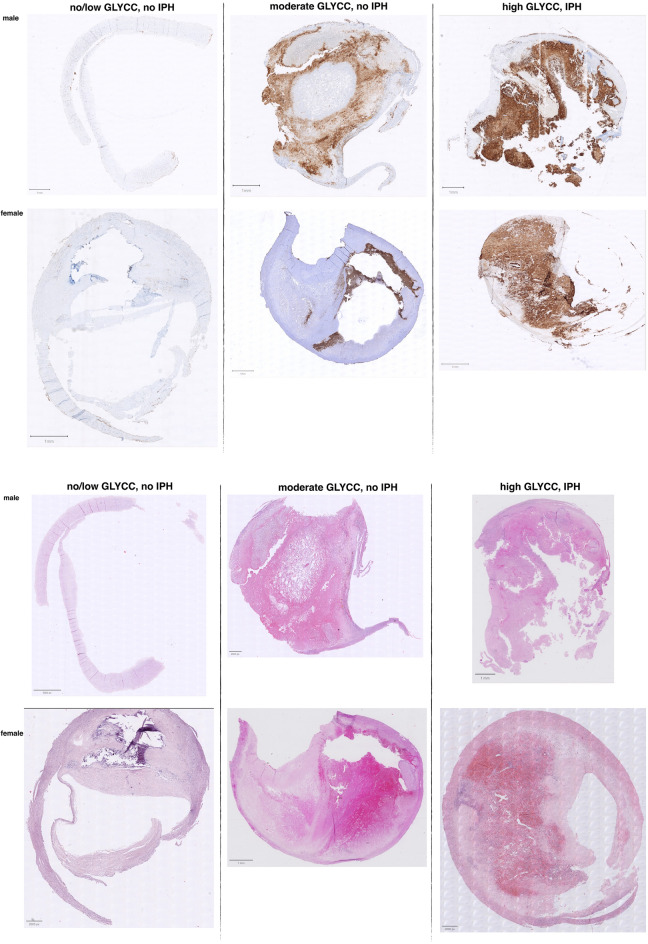
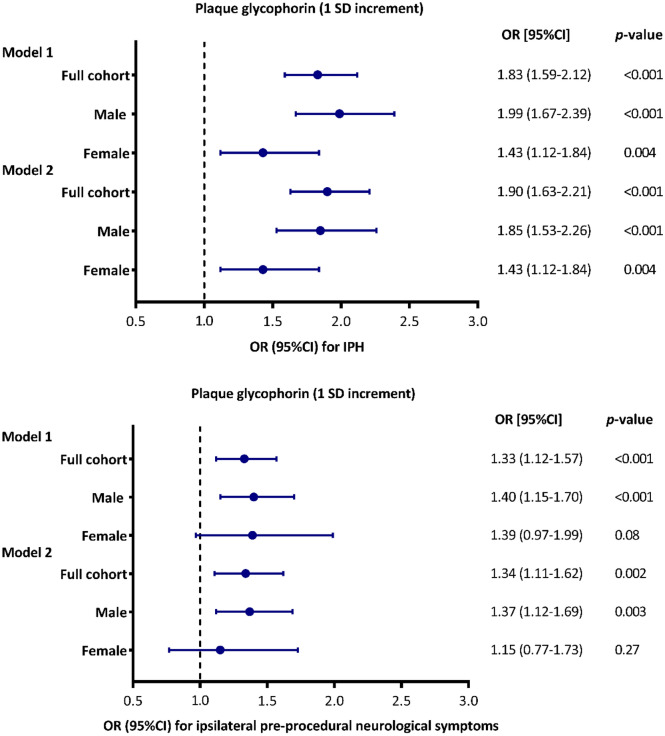
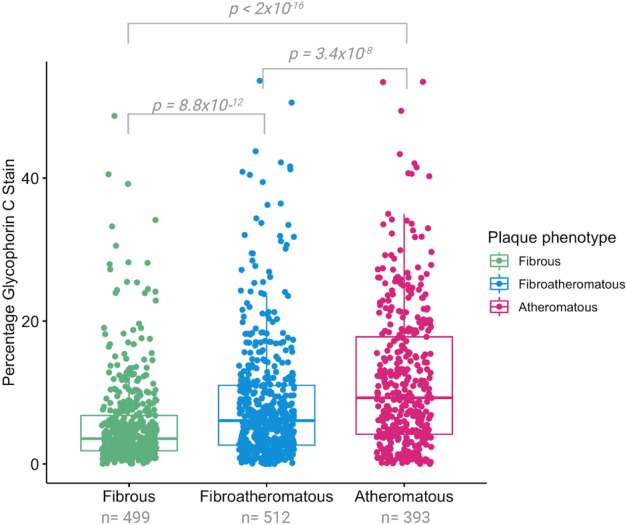
The accumulation of erythrocyte membranes within an atherosclerotic plaque may contribute to the deposition of free cholesterol and thereby the enlargement of the necrotic core. Erythrocyte membranes can be visualized and quantified in the plaque by immunostaining for the erythrocyte marker glycophorin C. Hence, we theorized that the accumulation of erythrocytes quantified by glycophorin C could function as a marker for plaque vulnerability, possibly reflecting intraplaque hemorrhage (IPH), and offering predictive value for pre-procedural neurological symptoms. We employed the CellProfiler-integrated slideToolKit workflow to visualize and quantify glycophorin C, defined as the total plaque area that is positive for glycophorin C, in single slides of culprit lesions obtained from the Athero-Express Biobank of 1819 consecutive asymptomatic and symptomatic patients who underwent carotid endarterectomy. Our assessment included the evaluation of various parameters such as lipid core, calcifications, collagen content, SMC content, and macrophage burden. These parameters were evaluated using a semi-quantitative scoring method, and the resulting data was dichotomized as predefined criteria into categories of no/minor or moderate/heavy staining. In addition, the presence or absence of IPH was also scored. The prevalence of IPH and pre-procedural neurological symptoms were 62.4% and 87.1%, respectively. The amount of glycophorin staining was significantly higher in samples from men compared to samples of women (median 7.15 (IQR:3.37, 13.41) versus median 4.06 (IQR:1.98, 8.32), p < 0.001). Glycophorin C was associated with IPH adjusted for clinical confounders (OR 1.90; 95% CI 1.63, 2.21; p = < 0.001). Glycophorin C was significantly associated with ipsilateral pre-procedural neurological symptoms (OR:1.27, 95%CI:1.06-1.41, p = 0.005). Sex-stratified analysis, showed that this was also the case for men (OR 1.37; 95%CI 1.12, 1.69; p = 0.003), but not for women (OR 1.15; 95%CI 0.77, 1.73; p = 0.27). Glycophorin C was associated with classical features of a vulnerable plaque, such as a larger lipid core, a higher macrophage burden, less calcifications, a lower collagen and SMC content. There were marked sex differences, in men, glycophorin C was associated with calcifications and collagen while these associations were not found in women. To conclude, the accumulation of erythrocytes in atherosclerotic plaque quantified and visualized by glycophorin C was independently associated with the presence of IPH, preprocedural symptoms in men, and with a more vulnerable plaque composition in both men and women. These results strengthen the notion that the accumulation of erythrocytes quantified by glycophorin C can be used as a marker for plaque vulnerability.
© 2023. Springer Nature Limited.
Conflict of interest statement
Dr. Sander W. van der Laan has received Roche funding for unrelated work; Roche had no involvement whatsoever in any aspect of this study. Dr. Aloke V Finn has received consultant fees/honoraria from Abbott Vascular, Amgen, Biosensors, Boston Scientific, Celonova, Cook Medical, CSI, Lutonix Bard, Sinomed. and Terumo Corporation. They had no involvement whatsoever in any aspect of this study. AV Finn is an employees of the CVPath Institute which has received GranuResearch/Clinical Trial support from NIH-HL141425, Leducq Foundation Grant, 4C Medical, 4Tech, Abbott Vascular, Ablative Solutions. Absorption Systems, Advanced NanoTherapies, Aerwave Medical, Alivas, Amgen. Asahi Medical, Aurios Medical, Avantec Vascular, BD, Biosensors, Biotronik, Biotyx Medical, Bolt Medical, Boston Scientific, Canon USA, Cardiac Implants, Cardiawave, CardioMech, Celonova, Cerus EndoVascuIar, Chansu Vascular Technologies, Childrens National Medical Center, Concept Medical, Cook Medical, Cooper Health, Cormaze Technologies GmbH, CRL/AcceILab, Croivalue, CSI, Dexcom, Edwards Lifesciences, Elucid Bioimaging, eLum Technologies, Emboline, Endotronix, Envision, Filterlex, Imperative Care, Innovalve, Innovative Cardiovascular Solutions, Intact Vascular, Interface Biolgics, Intershunt Techtnologies, Invatin Technologies, Lahav CRO, Limflow, L&J Biosciences, Lutonix, Lyra Therapeutics, Mayo Clinic, Maywell, MD Start, MedAIIiance, Medanex, Medtronic, Mercator, Microport, Microvention, Neovasc, Nephronyx, Nova Vascular, Nyra Medical, Occultech, Olympus, Ohio Health, OrbusNeich, Ossio, Phenox, Pi-Cardia, Polares Medical, Polyvascular, Profusa, ProKidney LLC, Protembis, Pulse Biosciences, Qool Therapeutics, Recombinetics, Recor Medical, Regencor, Renata Medical, Restore Medical, Ripple Therapeutics, Rush University, Sanofi, Shockwave, Sahajanand Medical Technologies, SoundPipe, Spartan Micro, Spectrawave, Surmodics, Terumo Corporation, The Jacobs Institute, Transmural Systems, Transverse Medical, TruLeaf Medical, UCSF, UPMC, Vesper, Vetex Medical, Whiteswell, WL Gore, and Xeltis.
Figures


References
-
- Libby P, et al. Atherosclerosis. Nat. Rev. Dis. Prim. 2019;5:56. - PubMed
-
- Guyton JR, Klemp KF. Development of the lipid-rich core in human atherosclerosis. Arterioscler. Thromb. Vasc. Biol. 1996;16:4–11. - PubMed
-
- Kolodgie FD, et al. Intraplaque hemorrhage and progression of coronary atheroma. N. Engl. J. Med. 2003;349:2316–2325. - PubMed
-
- Kolodgie FD, et al. Free cholesterol in atherosclerotic plaques: where does it come from? Curr. Opin. Lipidol. 2007;18:500–507. - PubMed
Publication types
MeSH terms
Substances
LinkOut - more resources
Full Text Sources
