. 2023 Oct 10;9(1):78.
doi: 10.1038/s41522-023-00436-x.

The accumulation and growth of Pseudomonas aeruginosa on surfaces is modulated by surface mechanics via cyclic-di-GMP signaling

Affiliations

The accumulation and growth of Pseudomonas aeruginosa on surfaces is modulated by surface mechanics via cyclic-di-GMP signaling

Liyun Wang et al. NPJ Biofilms Microbiomes. .

Abstract

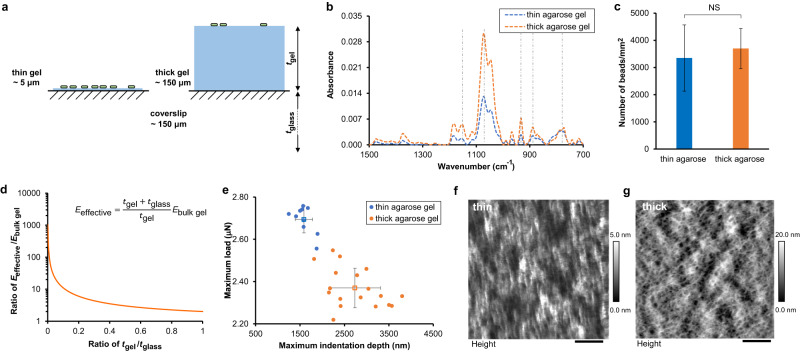
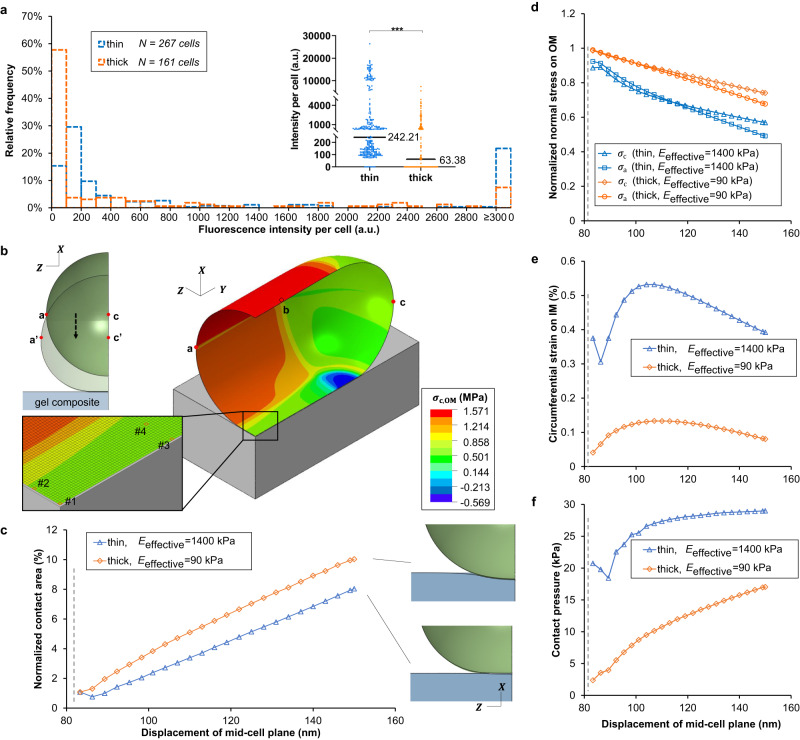
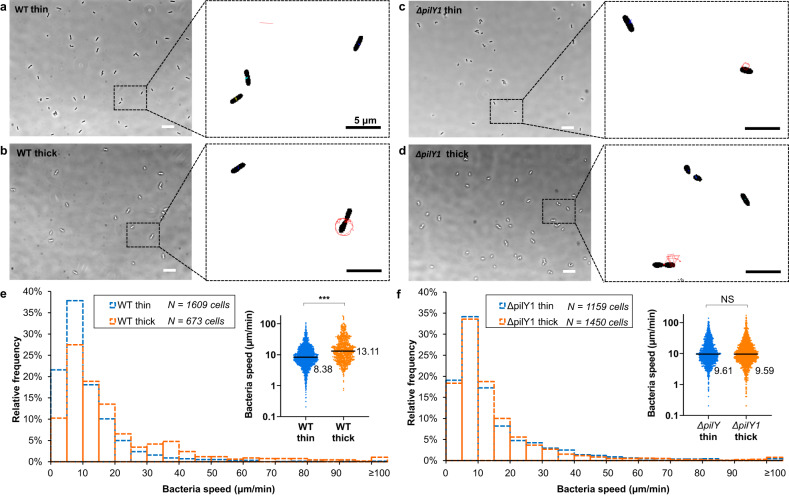
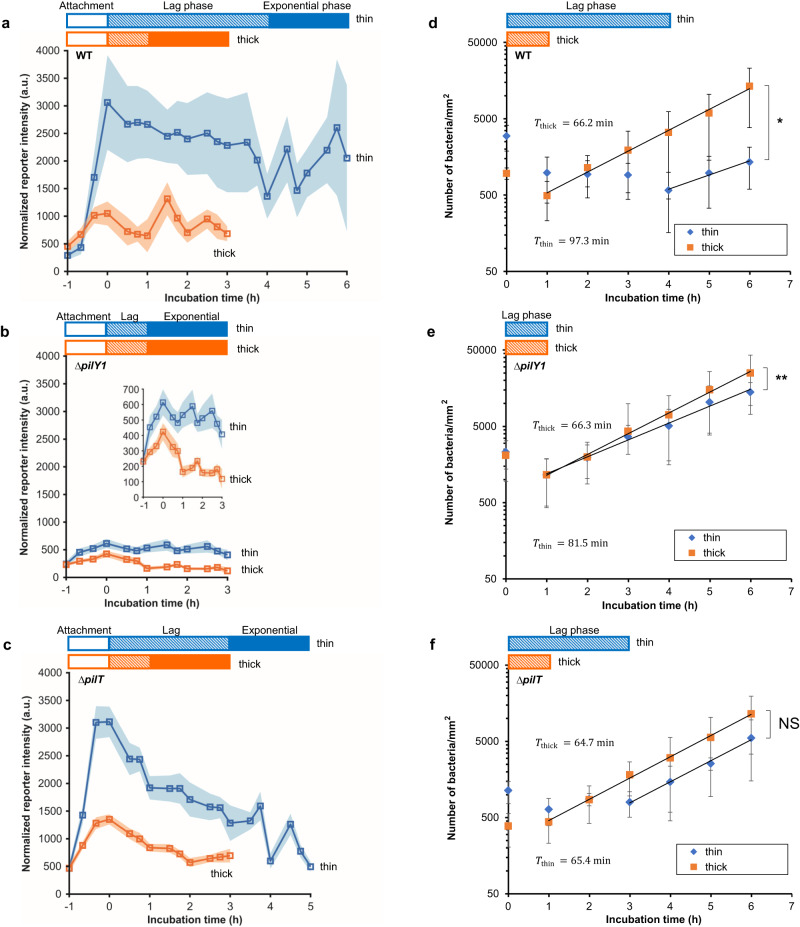
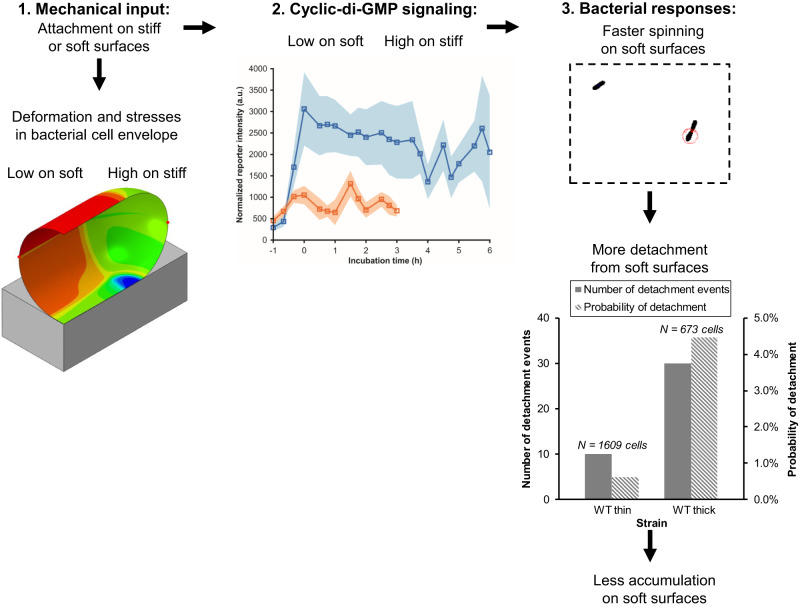
Attachment of bacteria onto a surface, consequent signaling, and accumulation and growth of the surface-bound bacterial population are key initial steps in the formation of pathogenic biofilms. While recent reports have hinted that surface mechanics may affect the accumulation of bacteria on that surface, the processes that underlie bacterial perception of surface mechanics and modulation of accumulation in response to surface mechanics remain largely unknown. We use thin and thick hydrogels coated on glass to create composite materials with different mechanics (higher elasticity for thin composites; lower elasticity for thick composites) but with the same surface adhesivity and chemistry. The mechanical cue stemming from surface mechanics is elucidated using experiments with the opportunistic human pathogen Pseudomonas aeruginosa combined with finite-element modeling. Adhesion to thin composites results in greater changes in mechanical stress and strain in the bacterial envelope than does adhesion to thick composites with identical surface chemistry. Using quantitative microscopy, we find that adhesion to thin composites also results in higher cyclic-di-GMP levels, which in turn result in lower motility and less detachment, and thus greater accumulation of bacteria on the surface than does adhesion to thick composites. Mechanics-dependent c-di-GMP production is mediated by the cell-surface-exposed protein PilY1. The biofilm lag phase, which is longer for bacterial populations on thin composites than on thick composites, is also mediated by PilY1. This study shows clear evidence that bacteria actively regulate differential accumulation on surfaces of different stiffnesses via perceiving varied mechanical stress and strain upon surface engagement.


Conflict of interest statement

The authors declare no competing interests.

Figures

Fig. 1
Fig. 1. Fabrication of thin gel and thick gel-coverslip composites with different surface mechanics.
a Schematic illustration of composites with different thicknesses of hydrogel, tgel, on top of glass coverslips with constant thickness tglass. b FTIR spectra of agarose gel composites with two thicknesses. The dash-dot lines indicate the location of characteristic peaks. N = 3. c The number of beads attached on agarose gel composites after incubation with bead suspension for 1 h. NS, not significant (P = 0.15). ANOVA test. NS indicates that the attachment of beads on thin and on thick gels are not significantly different for agarose gel composites. Data are means ± SD. N = 2. d The effective Young’s modulus of the hydrogel-coverslip composite (Eeffective), where Ebulk gel is the modulus of bulk hydrogel. The Young’s modulus of bulk agarose (3%) gel reported in Kolewe et al. work was 44.8 kPa. The calculated effective composite moduli of thin and thick agarose gel and glass composites are 1388.8 and 89.6 kPa, respectively. The Young’s modulus of bulk alginate (2%, 50 mM CaCl2) gel reported in Nunamaker et al. work was 32.0 kPa. The calculated effective composite moduli of thin and thick alginate gel and glass are 992.0 and 64.0 kPa, respectively. e Nanoindentation results of agarose gel samples. The relation between maximum load and maximum indentation of indentation curves of gels subjected to large indentation. Individual measurements are shown with solid circles; the means for all measurements per gel type are shown with hollow squares. Error bars are standard deviations. f, g AFM images showing the surface topography of thin and thick agarose hydrogels. Scale bar in (f): 800 nm. Scale bar in (g): 1 μm. Greyscale map of height is indicated to the right of each panel.
Fig. 2
Fig. 2. Adhesion to a thin gel surface leads to greater changes in mechanical stress/strain in the bacterial envelope and increased permeation of the bacterial cell membrane by sodium.
a The histogram shows the average intracellular fluorescence intensity per cell of attached WT on thin and thick agarose gel composites after incubating with surfaces for one hour. Inset: Dot plot of the histogram, shown with median values. ***P < 0.001; Mann-Whitney u test. This indicates a statistically-significant difference between fluorescence intensity distributions and between median fluorescent intensities for cells on thin and thick gel composites. N = 3. The number of cells analyzed for each replicate are 73, 104, and 90 cells in the experiments on thin gels, and 62, 31, and 68 cells in the experiments on thick gels. b The finite element model and schematic illustration. Displacement along –X coordinate is applied on curve abc to bring the cell into contact with the surface. The heat map denotes the circumferential stress on OM (outer membrane). Inset: The representative elements analyzed in this study. c Contact area with different degree of indentation (displacement along –X coordinate). Contact area is normalized to the cellular surface area in the undeformed configuration. The dash line denotes when the cell first contacts the surface. d–f OM stresses become less tensile whereas IM (inner membrane) strain increases at element #1 upon surface adhesion. The degree of changes is greater on thin gels. Contact pressure is greater on thin gels. Subscript c denotes the circumferential direction and subscript a denotes the axial direction. Stresses are normalized to their respective values during the free-floating state and strains are the net change with respect to their respective values during the free-floating state.
Fig. 3
Fig. 3. More bacteria accumulate on thin gel composites during one hour’s incubation for initial attachment.
a The accumulation of WT, ∆pilA, ∆pilT and ∆pilY1 on thin and thick agarose hydrogel composites was determined after incubating with surfaces for one hour. b The accumulation of bacteria on thin and thick alginate hydrogel composites. Data are means ± SD. ***P < 0.001; NS, not significant (P = 0.28 for agarose; P = 0.29 for alginate); analysis of variance (ANOVA) test. c The ratio of accumulated bacteria on thin to that on thick hydrogel composites. These measurements were done using phase contrast microscopy for N = 4 replicates in all cases. Each replicate was imaged with at least 12 randomly-chosen fields of view.
Fig. 4
Fig. 4. Adhered bacteria spin during the first hour of accumulation.
a–d Phase contrast images of WT and the ∆pilY1 mutant adhered to thin and thick agarose gel composites. Insets: Tracked trajectories of bacterial centers-of-mass over 62.6 s. Scale bar: 10 μm. e, f Histograms showing speed distributions of WT and the ∆pilY1 mutant on thin and thick gel composites. Insets: Dot plots of the corresponding histogram. The median value is written to the right of each plot. ***P < 0.001; Mann–Whitney u test. *** indicates a statistically-significant difference in the distributions of WT speeds on thin and on thick gel composites and that the median speed of WT adhered to thick gel composites was higher, with statistical significance, than that of WT to thin gel composites. In contrast, NS (not significant) indicates that there is no statistically-significant difference in the distributions of speeds or in the median speeds of the ∆pilY1 mutant on the two composite types (P = 0.66, Mann–Whitney u test). Biological replicates N = 3 in all cases, with each biological replicate represented by 15 video sequences at randomly-chosen fields of view.
Fig. 5
Fig. 5. On agarose surfaces with different mechanics, PilY1 acts to mediate the duration of the lag phase in biofilm growth and the levels of the intracellular signal c-di-GMP, and PilT is required to mediate the growth rate of the exponential phase of biofilm growth.
a–c The average per-cell normalized intensity for fluorescent reporters for changes in intracellular c-di-GMP in WT and the ∆pilY1 and ∆pilT mutants during accumulation, lag phase, and exponential phase. The same vertical scale is used for each plot so that differences between strains are clear. The initial hour of accumulation on a surface is designated by −1 to 0 h, shown by hollow color bars. For each sample, exponential phase was observed for two hours, shown by solid color bars. Squares represent mean levels of c-di-GMP at each time point, linked by lines as a guide to the eye. Shaded regions correspond to 95% confidence intervals. The inset in (b) shows c-di-GMP reporter intensity in the ∆pilY1 mutant with a smaller y-axis range. N = 3 for all experiments using the reporter plasmid; N = 2 for all experiments using the control plasmid. d–f Growth dynamics of attached WT, and the ∆pilY1 and ∆pilT mutants on thin and thick agarose gel composites. Data are means ± SD. The data at 0 time point corresponds to the end of one hour of bacterial accumulation on gel surfaces. The accumulation phase was always one hour long, and was set by the time that a suspension of planktonic bacteria was incubated with the surface. Hatched color bars show the length of the lag phase. The duration of the lag phase was experimentally determined in each case, by measuring the bacterial population on the surface. While that population was roughly constant in time, the system was considered to be in lag phase. The onset of exponential growth phase was determined experimentally in each case, by measuring the bacterial population on the surface. Once the population started to increase as an exponential function of time, the system was considered to be in exponential phase. The doubling time, T, is calculated by the equation T = ln2/α, where α is the growth rate of bacteria on surfaces (equations of exponential regression, f(t) = Aeαt, where t is the incubation time). For each bacterial strain, we use Tthick to designate the doubling time on the thick gel composite, and Tthin to designate the doubling time on the thin gel composite. **P < 0.01, *P < 0.05; NS, not significant; analysis of covariance (ANCOVA) test. ** and * indicate that the growth rate αthin is significantly different from αthick for WT and for the ∆pilY1 mutant, while NS means the difference in growth rates on thin and thick gel composites are not significant for ∆pilT (P > 0.1). Each time point was done for two replicate samples, and at least 12 fields of view were randomly chosen for each replicate. Samples used for measurement at one time point were not used for further incubation or later measurements, i.e., the measurement at each time point was done independently. Thus, for each strain and thickness combination, 14 replicas were measured.
Fig. 6
Fig. 6. Schematic of the proposed links between surface mechanics and bacterial accumulation.
Adhesion to a surface results in changes in mechanical stresses and deformations in the bacterial cell envelope. These changes are greater when the surface is stiff than when it is soft (Fig. 2). Adhesion to a stiff surface results in a greater increase in intracellular levels of c-di-GMP than does adhesion to a soft surface (Fig. 5). Higher levels of c-di-GMP result in faster bacterial spinning (Fig. 4) on soft surfaces and a greater likelihood of detaching from soft surfaces (Supplementary Fig. 5). As a result, more bacteria accumulate on stiff surfaces than on soft (Fig. 3).

Update of

References

    1. Cheng B, et al. Cellular mechanosensing of the biophysical microenvironment: a review of mathematical models of biophysical regulation of cell responses. Phys. Life Rev. 2017;22:88–119. - PMC - PubMed
    1. Iskratsch T, Wolfenson H, Sheetz MP. Appreciating force and shape—the rise of mechanotransduction in cell biology. Nat. Rev. Mol. Cell Biol. 2014;15:825–833. - PMC - PubMed
    1. Persat A. Bacterial mechanotransduction. Curr. Opin. Microbiol. 2017;36:1–6. - PubMed
    1. Gordon VD, Wang L. Bacterial mechanosensing: the force will be with you, always. J. Cell Sci. 2019;132:jcs227694. - PMC - PubMed
    1. Dufrêne, Y. F. & Persat, A. Mechanomicrobiology: how bacteria sense and respond to forces. Nat. Rev. Microbiol.18, 1–14 (2020). - PubMed

Publication types

Substances