

Shifts of the soil microbiome composition induced by plant-plant interactions under increasing cover crop densities and diversities
- PMID: 37816810
- PMCID: PMC10564930
- DOI: 10.1038/s41598-023-44104-8
Shifts of the soil microbiome composition induced by plant-plant interactions under increasing cover crop densities and diversities
Abstract
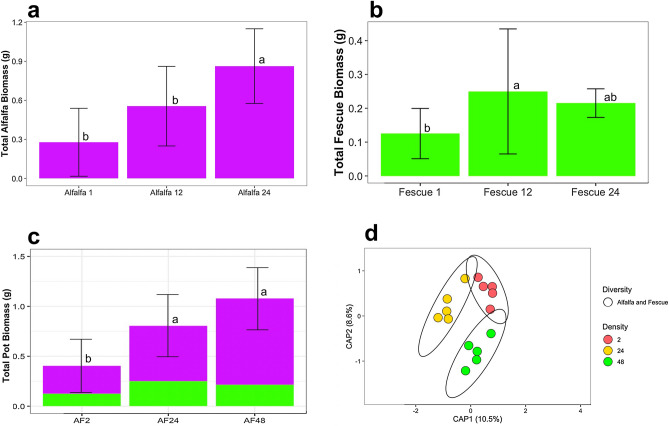
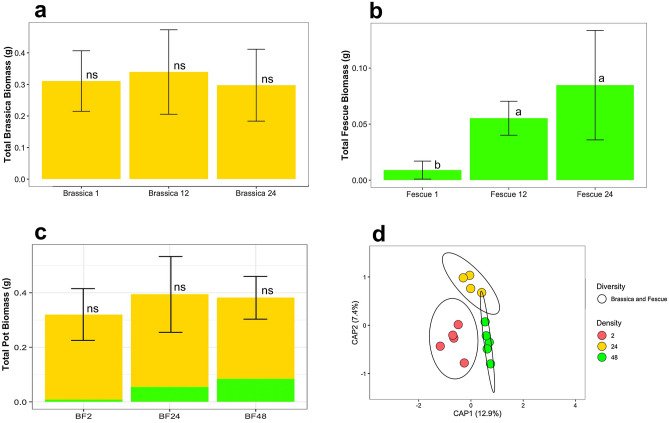
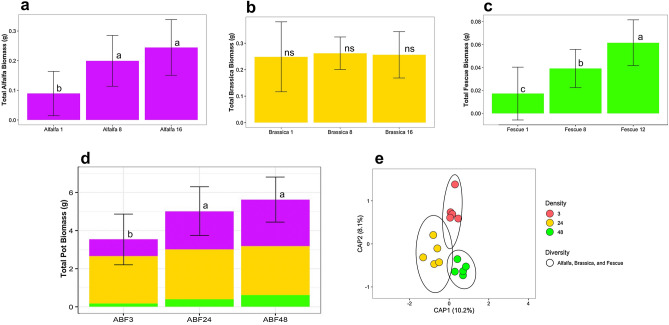
Interspecific and intraspecific competition and facilitation have been a focus of study in plant-plant interactions, but their influence on plant recruitment of soil microbes is unknown. In this greenhouse microcosm experiment, three cover crops (alfalfa, brassica, and fescue) were grown alone, in paired mixtures, and all together under different densities. For all monoculture trials, total pot biomass increased as density increased. Monoculture plantings of brassica were associated with the bacteria Azospirillum spp., fescue with Ensifer adhaerens, and alfalfa with both bacterial taxa. In the polycultures of cover crops, for all plant mixtures, total above-ground alfalfa biomass increased with density, and total above ground brassica biomass remained unchanged. For each plant mixture, differential abundances highlighted bacterial taxa which had not been previously identified in monocultures. For instance, mixtures of all three plants showed an increase in abundance of Planctomyces sp. SH-PL14 and Sandaracinus amylolyticus which were not represented in the monocultures. Facilitation was best supported for the alfalfa-fescue interaction as the total above ground biomass was the highest of any mixture. Additionally, the bulk soil microbiome that correlated with increasing plant densities showed increases in plant growth-promoting rhizobacteria such as Achromobacter xylosoxidans, Stentotrophomonas spp., and Azospirillum sp. In contrast, Agrobacterium tumefaciens, a previously known generalist phytopathogen, also increased with alfalfa-fescue plant densities. This could suggest a strategy by which, after facilitation, a plant neighbor could culture a pathogen that could be more detrimental to the other.
© 2023. Springer Nature Limited.
Conflict of interest statement
The authors declare no competing interests.
Figures


Similar articles
-
Effect of intra- and inter-specific plant interactions on the rhizosphere microbiome of a single target plant at different densities.PLoS One. 2025 Jan 27;20(1):e0316676. doi: 10.1371/journal.pone.0316676. eCollection 2025. PLoS One. 2025. PMID: 39869650 Free PMC article.
-
Alfalfa-grass mixtures reduce greenhouse gas emissions and net global warming potential while maintaining yield advantages over monocultures.Sci Total Environ. 2022 Nov 25;849:157765. doi: 10.1016/j.scitotenv.2022.157765. Epub 2022 Aug 1. Sci Total Environ. 2022. PMID: 35926624
-
Interactions of plant growth-promoting rhizobacteria and soil factors in two leguminous plants.Appl Microbiol Biotechnol. 2017 Dec;101(23-24):8485-8497. doi: 10.1007/s00253-017-8550-8. Epub 2017 Oct 16. Appl Microbiol Biotechnol. 2017. PMID: 29038972
-
Behavior, preference for, and use of alfalfa, tall fescue, white clover, and buffalograss by pregnant gilts in an outdoor production system.J Anim Sci. 2005 Sep;83(9):2225-34. doi: 10.2527/2005.8392225x. J Anim Sci. 2005. PMID: 16100078
-
Rhizosphere Microbiome Modulators: Contributions of Nitrogen Fixing Bacteria towards Sustainable Agriculture.Int J Environ Res Public Health. 2018 Mar 23;15(4):574. doi: 10.3390/ijerph15040574. Int J Environ Res Public Health. 2018. PMID: 29570619 Free PMC article. Review.
Cited by
-
Ecological Impacts of Sunflowers on Soil Microbial Communities: Insights from Full-Length 16S rRNA Sequencing.Curr Microbiol. 2025 May 21;82(7):297. doi: 10.1007/s00284-025-04273-3. Curr Microbiol. 2025. PMID: 40397056
-
Soil microbiome transplantation to enhance the drought response of Salvia officinalis L.Front Microbiol. 2025 Mar 12;16:1553922. doi: 10.3389/fmicb.2025.1553922. eCollection 2025. Front Microbiol. 2025. PMID: 40143859 Free PMC article.
-
Update of the list of qualified presumption of safety (QPS) recommended microbiological agents intentionally added to food or feed as notified to EFSA 19: Suitability of taxonomic units notified to EFSA until September 2023.EFSA J. 2024 Jan 11;22(1):e8517. doi: 10.2903/j.efsa.2024.8517. eCollection 2024 Jan. EFSA J. 2024. PMID: 38213415 Free PMC article.
-
Nutrient uptake and rhizosphere microbial community as related to yield advantage in broomcorn millet‒alfalfa intercropping under different row configurations.BMC Plant Biol. 2025 Jan 2;25(1):2. doi: 10.1186/s12870-024-06011-6. BMC Plant Biol. 2025. PMID: 39743535 Free PMC article.
References
-
- Malik RK, Green TH, Brown GF, Mays D. Use of cover crops in short rotation hardwood plantations to control erosion. Biomass Bioenerg. 2000;18(6):479–487.
Publication types
MeSH terms
Substances
LinkOut - more resources
Full Text Sources
Miscellaneous
