. 2023 Oct 11;20(1):233.
doi: 10.1186/s12974-023-02914-7.

Insulin-degrading enzyme (IDE) as a modulator of microglial phenotypes in the context of Alzheimer's disease and brain aging

Affiliations

Insulin-degrading enzyme (IDE) as a modulator of microglial phenotypes in the context of Alzheimer's disease and brain aging

Miriam Corraliza-Gomez et al. J Neuroinflammation. .

Abstract

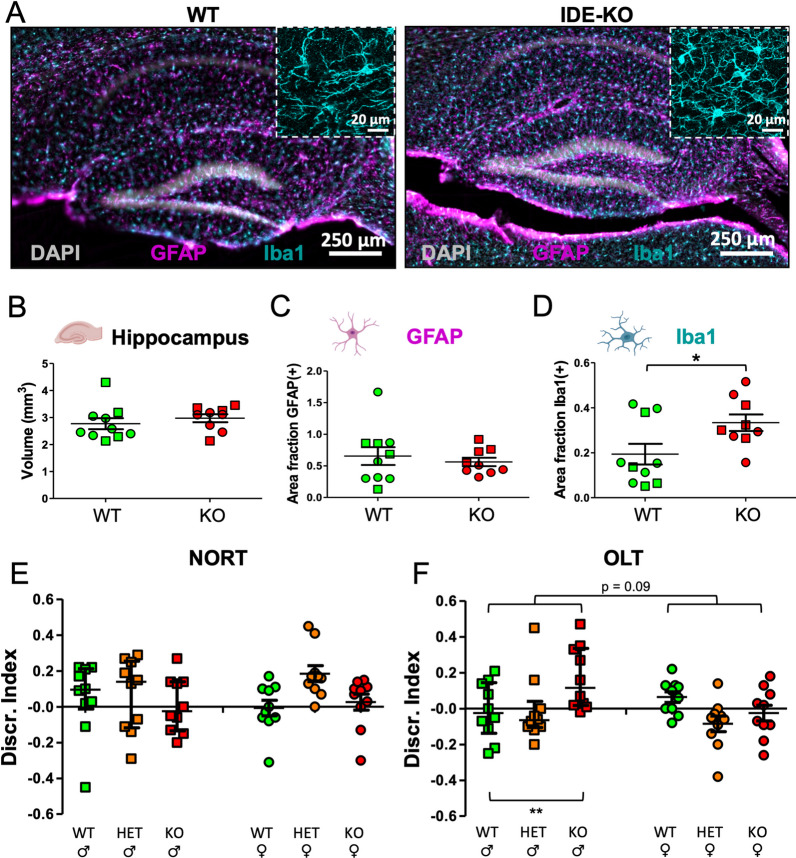
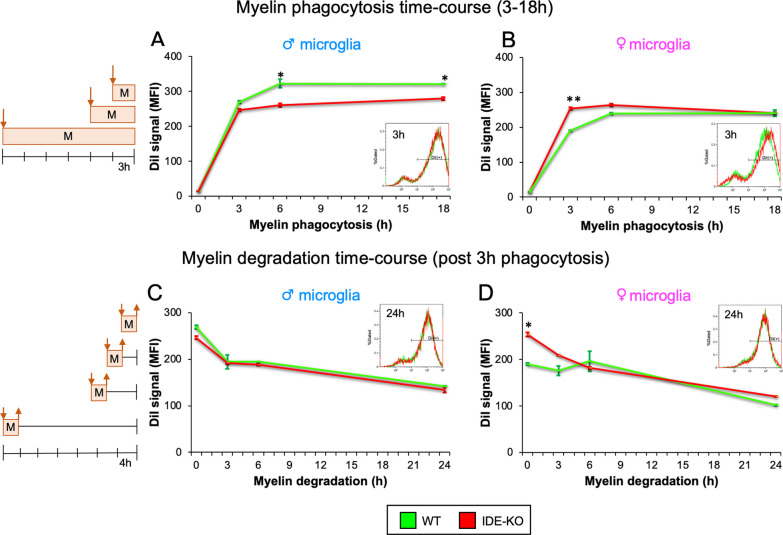
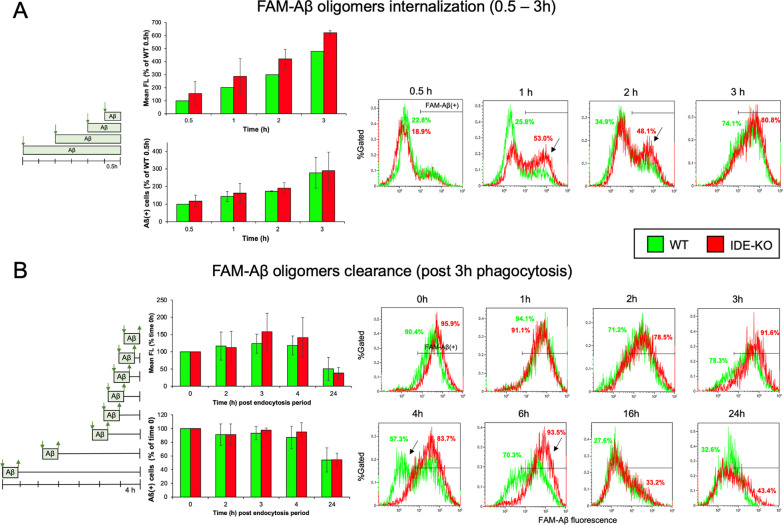
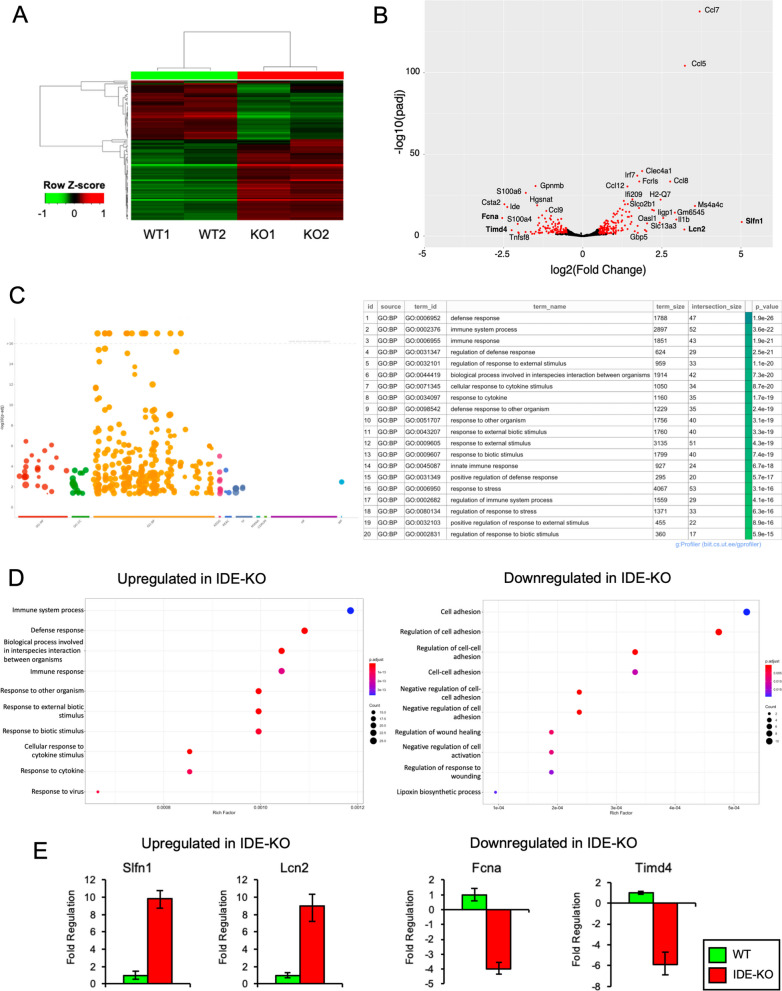
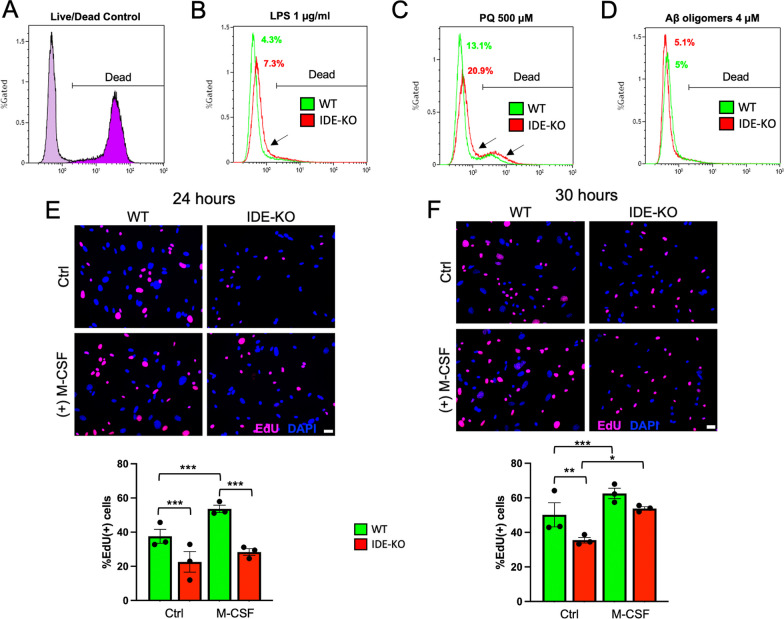
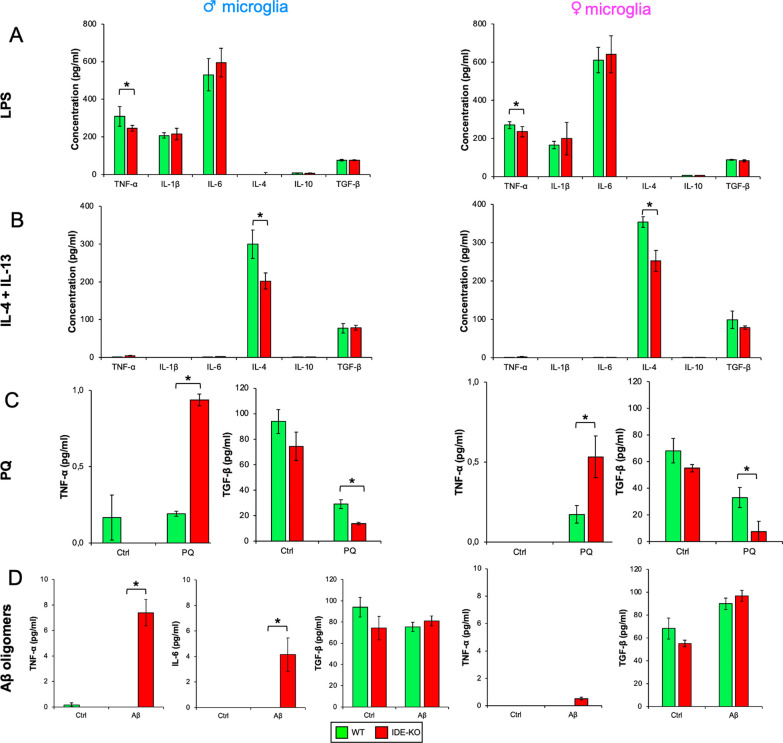
The insulin-degrading enzyme (IDE) is an evolutionarily conserved zinc-dependent metallopeptidase highly expressed in the brain, where its specific functions remain poorly understood. Besides insulin, IDE is able to cleave many substrates in vitro, including amyloid beta peptides, making this enzyme a candidate pathophysiological link between Alzheimer's disease (AD) and type 2 diabetes (T2D). These antecedents led us to address the impact of IDE absence in hippocampus and olfactory bulb. A specific induction of microgliosis was found in the hippocampus of IDE knockout (IDE-KO) mice, without any effects in neither hippocampal volume nor astrogliosis. Performance on hippocampal-dependent memory tests is influenced by IDE gene dose in 12-month-old mice. Furthermore, a comprehensive characterization of the impact of IDE haploinsufficiency and total deletion in metabolic, behavioral, and molecular parameters in the olfactory bulb, a site of high insulin receptor levels, reveals an unambiguous barcode for IDE-KO mice at that age. Using wildtype and IDE-KO primary microglial cultures, we performed a functional analysis at the cellular level. IDE absence alters microglial responses to environmental signals, resulting in impaired modulation of phenotypic states, with only transitory effects on amyloid-β management. Collectively, our results reveal previously unknown physiological functions for IDE in microglia that, due to cell-compartment topological reasons, cannot be explained by its enzymatic activity, but instead modulate their multidimensional response to various damaging conditions relevant to aging and AD conditions.

Keywords: Amyloid-beta endocytosis; Cytokine secretion; Inflammation; Insulin-degrading enzyme; Microglia; Microglial proliferation; Myelin phagocytosis; Oxidative stress.


Conflict of interest statement

The authors declare that they have no competing interest.

Figures

Fig. 1
Fig. 1
IDE absence has specific effects on hippocampal microglia, triggering microglia phenotypic modulation without affecting astrocytes. A Representative confocal images of immunohistochemistry experiments on 12-month-old WT and IDE-KO mice. Iba1 and GFAP are used as microglial and astroglial markers, respectively. Nuclei are stained with DAPI. Insets show close-ups where morphological changes in IDE-KO microglia can be appreciated. The intensity of labeling in WT inset has been multiplied by a factor of 4, to help visualization. B Total hippocampal volume (t-test; p = 0.29). C Astrogliosis, measured as the percentage of area occupied by GFAP labeling (t-test; p = 0.57). D Microgliosis, measured as the percentage of area occupied by Iba1 labeling (U Mann–Whitney test; p = 0.04). In BD each point represents an individual mouse (squares = males, circles = females). Horizontal lines depict the mean ± SEM. N = 4–6 mice per genotype and sex. Statistical differences were initially assessed by two-way ANOVA considering the factors genotype and sex. Since no sex-differences were detected (hippocampal volume p = 0.383, Iba1+ area p = 0.573, GFAP+ area p = 0.405), male and female mice of the same genotype were pooled. *p < 0.05. E, F Object location test (OLT) and Novel Object Recognition Test (NORT) results. N = 10 mice per genotype and sex. Each point represents an individual mouse. Lines depict the median ± interquartile range. Statistical differences in OLT and NORT were assessed by two-way ANOVA, considering the factors genotype and sex, followed by all pairwise multiple comparisons using the Holm–Sidak method. Only biologically relevant differences are shown. **p < 0.01
Fig. 2
Fig. 2
Myelin phagocytosis by microglia shows sex- and IDE-dependent effects, while myelin degradation remains unaltered. Myelin management was assessed by flow cytometry experiments. The histogram of control microglia without myelin was used to define the fluorescence threshold to classify an event as DiI-positive microglia. A, B Time-course experiments of myelin phagocytosis by WT and IDE-KO male (A) and female (B) microglia exposed to myelin-DiI for 3–18 h. Histograms of a representative experiment of 3 h phagocytosis are shown in the insets. C, D Time-course experiments of myelin degradation by WT and IDE-KO male (C) and female (D) microglia exposed to myelin-DiI for 3 h (phagocytosis time), followed by degradation times ranging from 3 to 24 h. Histograms of a representative experiment of 24 h degradation are shown. Dots in the graphs represent the average ± SEM of 2 independent experiments with 2 male and 2 female cultures, with at least 10,000 cells/sample. Statistical differences were assessed by three-way ANOVA considering the factors genotype, sex and time, followed by post-hoc pairwise comparisons by Holm–Sidak method. Sex factor was significant in both phagocytosis (p < 0.001) and degradation (p = 0.04) experiments. Phagocytosis in males: factor genotype (p = 0.005), WT vs IDE-KO at 3 h (p = 0.23), 6 h (p = 0.011), 18 h (p = 0.049). Phagocytosis in females: factor genotype (p = 0.009), WT vs IDE-KO at 3 h (p = 0.003), 6 h (p = 0.12), 18 h (p = 0.98). Degradation in males: factor genotype (p = 0.28), WT vs IDE-KO at 0 h (p = 0.21), 3 h (p = 0.87), 6 h (p = 0.72), 18 h (p = 0.67). Degradation in females: factor genotype (p = 0.07), WT vs IDE-KO at 0 h (p = 0.03), 3 h (p = 0.22), 6 h (p = 0.56), 24 h (p = 0.46). *p < 0.05; **p < 0.01
Fig. 3
Fig. 3
Aβ oligomers internalization and clearance is independent on microglial IDE genotype. A FAM-Aβ oligomers internalization measured by flow cytometry after different exposure times (0.5–3 h). Four independent experiments (2–4 samples/time point) were analyzed. Normalized average fluorescence change, and % of Aβ positive cells are represented. Histograms of the experiment with the highest difference between genotypes show a mild, transitory acceleration of endocytosis. The control histogram without FAM-Aβ exposure defines the fluorescence threshold to classify an event as FAM-Aβ positive microglia. Numbers depict the percentage of FAM-Aβ( +) cells. Arrows point out the greatest differences. B Time course of Aβ oligomers clearance measured by flow cytometry in cells exposed to FAM-Aβ oligomers for 3 h (internalization period), followed by several degradation times (0–24 h). Three independent experiments with at least 10,000 cells per sample and 2–4 samples/time point were analyzed. Normalized average fluorescence change, and % of Aβ positive cells are represented. Histograms of the experiment with the highest difference between genotypes shows a transitory deceleration of clearance. No statistical differences are found at any time point in both assays. Statistical differences were assessed by 2-way ANOVA considering the factors genotype and time, followed by post-hoc Holm–Sidak comparisons. Endocytosis mean FL [genotype p = 0.078; time p = 0.0003]; endocytosis %Aß( +) cells [genotype p = 0.534; time p = 0.0252]; clearance mean FL [genotype p = 0.5636; time p = 0.0333]; clearance %Aß(+) cells [genotype p = 0.6752; time p = 0.0155]
Fig. 4
Fig. 4
Transcriptomic profiling of WT and IDE-KO primary microglia. A Heatmap representation of the top 100 differentially expressed genes (DEGs) in IDE-KO vs. WT microglia (N = 2 individual microglial cultures/genotype). Clustering of genes by expression profile is shown on the left. B Volcano plot showing in red the genes that are differentially expressed (FDR < 0.05). C Gene enrichment analysis using the 103 DEGs. Manhattan plot on the left depicting functional terms grouped by data sources (X-axis) versus the adjusted enrichment p-values in negative log10 scale (Y-axis). Circle sizes are in accordance with the corresponding term size. Data sources: GO Gene Ontology (with three major categories: MF Molecular Functions, BP Biological Process, and CC Cell Component); Biological pathway databases (KEGG, REAC Reactome, and WP WikiPathways); regulatory motifs in DNA (TF Transcription Factors; MIRNA micro-RNAs), Protein databases (CORUM and HP Human Protein Atlas). The table on the right has the top 20 most significant GO terms, sorted by p-values. D Gene enrichment analyses performed separately in upregulated (left) and downregulated (right) DEGs in IDE-KO vs. WT microglia, showing the top 10 GO terms. The Rich Factor is calculated as the ratio between the number of target genes belonging to a pathway and the number of all annotated genes located in the pathway. The size of the dots indicates the number of target genes in the pathway, while dot's color reflects the different p-value range. E Validation of RNA-Seq data by qPCR using RNA from an independent pair of microglial cultures
Fig. 5
Fig. 5
IDE absence decreases microglial proliferation, delays response to M-CSF and produces no significant changes in viability. AD Flow cytometry experiments using Live/Dead viability assays to compare WT and IDE-KO microglial viability when stimulated for 8 h with 1 μg/ml LPS (B), 500 μM paraquat (C) and 4 μM Aβ oligomers (D), respectively. The positive control is shown in A. Two independent experiments with at least 20,000 cells per sample and 2–4 samples/genotype and stimulus were analyzed (histograms of the experiment with the highest difference between genotypes is shown). Statistical differences in BD were assessed by two-way ANOVA, considering the factors genotype (p-value = 0.3968) and treatment (p-value = 0.0048), followed by all pairwise comparisons between genotypes by Holm–Sidak (LPS p-value = 0.6692, PQ p-value = 0.5382, Aβ p-value = 0.8150). E, F EdU proliferation assays to quantify WT and IDE-KO primary microglia proliferation under control conditions (Ctrl) and upon M-CSF (macrophage-colony stimulating factor, 50 ng/ml) for 24 h (E) and 30 h (F). Bars represent the mean ± SEM of EdU-positive cells (3 biological samples, with N = 600–1800 cells/condition. Scale bar = 20 μm. Statistical differences in E and F were evaluated by two-way ANOVA, considering the factors genotype (p < 0.001) and treatment (p < 0.001), followed by all pairwise multiple comparisons by Holm–Sidak method. Only biologically relevant differences are shown. *p < 0.05; **p < 0.01; ***p < 0.001
Fig. 6
Fig. 6
IDE-KO microglia exhibit impaired cytokine profiling when activated with different stimuli. WT and IDE-KO primary microglial cultures were challenged with different stimuli for 18 h, and then cytokines released to the culture medium were measured. Stimuli tested include: A LPS (100 ng/ml), B IL-4 + IL-13 (20 and 50 ng/ml, respectively), C paraquat (50 µM) and D Aβ oligomers (1 µM). N = 3 samples per genotype and sex. Bars represent the mean ± SEM for each cytokine (unstimulated condition is not plotted in A and B). Statistical analyses were performed separately in males and females by two-way ANOVAs, considering the factors genotype and treatment. Individual differences were assessed by post hoc Holm–Sidak pairwise comparisons. *p < 0.05

References

    1. Knopman DS, Amieva H, Petersen RC, Chételat G, Holtzman DM, Hyman BT, et al. Alzheimer disease. Nat Rev Dis Primers. 2021;7:33. doi: 10.1038/s41572-021-00269-y. - DOI - PMC - PubMed
    1. Gong C-X, Liu F, Iqbal K. Multifactorial hypothesis and multi-targets for Alzheimer’s disease. J Alzheimers Dis. 2018;64:S107–S117. doi: 10.3233/JAD-179921. - DOI - PubMed
    1. Nakabeppu Y, Ninomiya T. Diabetes mellitus: a risk factor for Alzheimer’s disease. Singapore: Springer; 2019.
    1. Tohidpour A, Morgun AV, Boitsova EB, Malinovskaya NA, Martynova GP, Khilazheva ED, et al. Neuroinflammation and infection: molecular mechanisms associated with dysfunction of neurovascular unit. Front Cell Infect Microbiol. 2017;7:276. doi: 10.3389/fcimb.2017.00276. - DOI - PMC - PubMed
    1. Sierra A, Abiega O, Shahraz A, Neumann H. Janus-faced microglia: beneficial and detrimental consequences of microglial phagocytosis. Front Cell Neurosci. 2013 doi: 10.3389/fncel.2013.00006/abstract. - DOI - PMC - PubMed