. 2024 Feb 12;5(2):100730.
doi: 10.1016/j.xplc.2023.100730. Epub 2023 Oct 10.

The GmSTF1/2-GmBBX4 negative feedback loop acts downstream of blue-light photoreceptors to regulate isoflavonoid biosynthesis in soybean

Affiliations

The GmSTF1/2-GmBBX4 negative feedback loop acts downstream of blue-light photoreceptors to regulate isoflavonoid biosynthesis in soybean

Zhaoqing Song et al. Plant Commun. .

Abstract

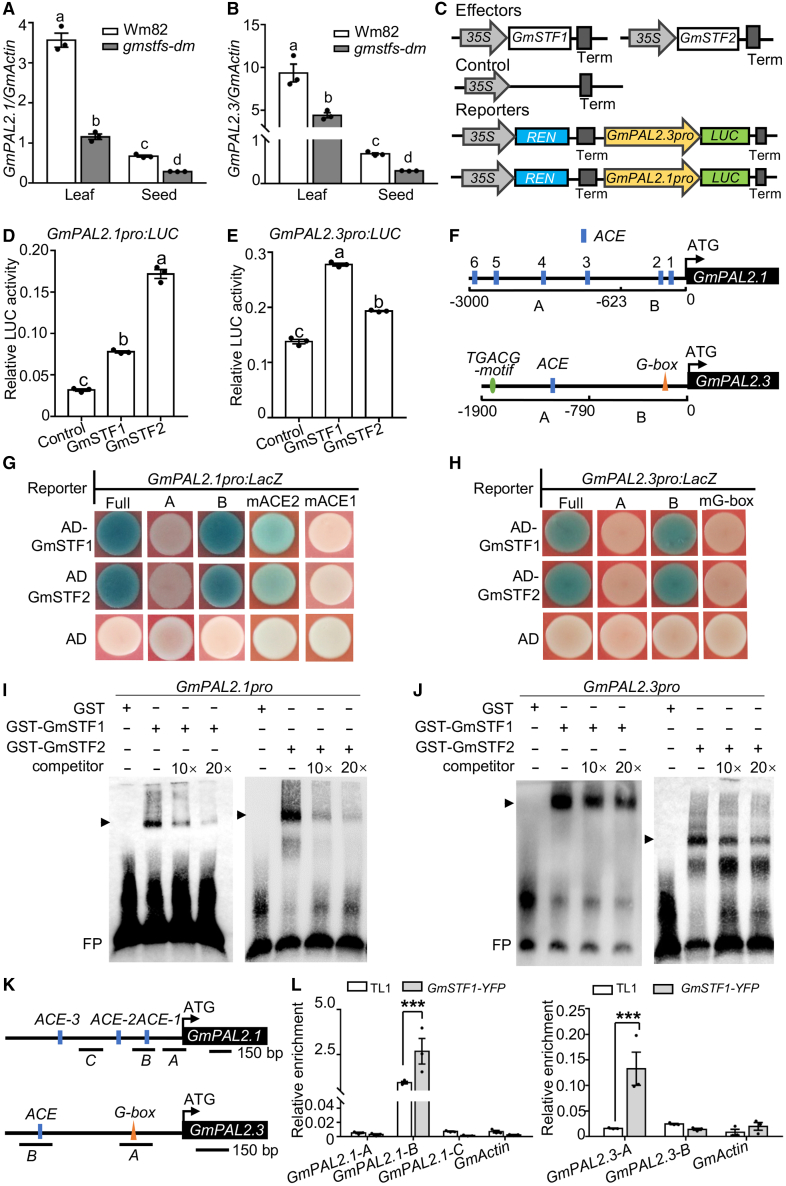
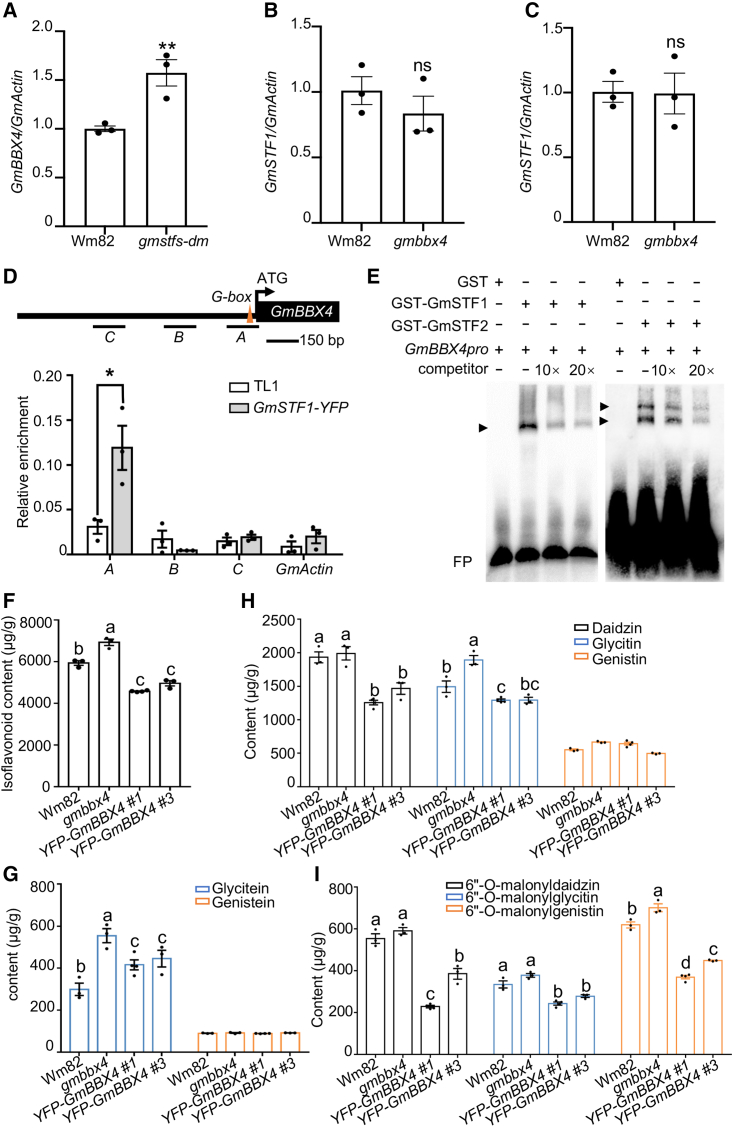
Isoflavonoids, secondary metabolites derived from the phenylalanine pathway, are predominantly biosynthesized in legumes, especially soybean (Glycine max). They are not only essential for plant responses to biotic and abiotic stresses but also beneficial to human health. In this study, we report that light signaling controls isoflavonoid biosynthesis in soybean. Blue-light photoreceptors (GmCRY1s, GmCRY2s, GmPHOT1s, and GmPHOT2s) and the transcription factors GmSTF1 and GmSTF2 promote isoflavonoid accumulation, whereas the E3 ubiquitin ligase GmCOP1b negatively regulates isoflavonoid biosynthesis. GmPHOT1s and GmPHOT2s stabilize GmSTF1/2, whereas GmCOP1b promotes the degradation of these two proteins in soybean. GmSTF1/2 regulate the expression of approximately 27.9% of the genes involved in soybean isoflavonoid biosynthesis, including GmPAL2.1, GmPAL2.3, and GmUGT2. They also repress the expression of GmBBX4, a negative regulator of isoflavonoid biosynthesis in soybean. In addition, GmBBX4 physically interacts with GmSTF1 and GmSTF2 to inhibit their transcriptional activation activity toward target genes related to isoflavonoid biosynthesis. Thus, GmSTF1/2 and GmBBX4 form a negative feedback loop that acts downstream of photoreceptors in the regulation of isoflavonoid biosynthesis. Our study provides novel insights into the control of isoflavonoid biosynthesis by light signaling in soybean and will contribute to the breeding of soybean cultivars with high isoflavonoid content through genetic and metabolic engineering.

Keywords: GmBBX4; GmSTF; isoflavonoid; light signaling; photoreceptor; soybean.


Figures

Figure 1
Figure 1
Isoflavonoid contents of gmcry1s-qm, gmcry2s-tm, gmphot1s-tm, gmphot2s-dm, gmcop1a, and gmcop1b soybean seeds. (A and B) Total isoflavonoid contents in dry seeds of TL1, gmcry1s-qm, gmcry2s-tm, Wm82, gmphot1s-tm, and gmphot2s-dm soybean. (C–F) Genistein, daidzein, genistin, daidzin, and glycitin contents in dry seeds of TL1, gmcry1s-qm, and gmcry2s-tm soybean. (G–I) Total isoflavonoid, glycitin, genistein, daidzein, 6″-O-malonylglycitin, 6″-O-malonyldaidzin, and 6″-O-malonylgenistin contents in dry seeds of Wm82, gmcop1a, and gmcop1b soybean. (J and K) Transcript levels of GmSTF1 and GmSTF2 in Wm82, gmphot1s-tm, and gmphot2s-dm as determined by qRT–PCR. Wm82, gmphot1s-tm, and gmphot2s-dm were grown under LD conditions (14-h light/10-h dark) at 25°C for 15 days, after which the leaves were collected for RNA extraction and qRT–PCR analysis. Asterisks indicate significant differences (∗P < 0.05) determined by two-tailed Student’s t-test. (L and M) Immunoblot analysis showing the abundance of GmSTF1/2 in Wm82, gmphot1s-tm, gmphot2s-dm, gmcop1a, and gmcop1b soybean. Wm82 and various soybean mutants were grown under LD conditions (14-h light/10-h dark) at 25°C for 15 days, after which leaves were collected at ZT10 for immunoblot analysis. Arrowheads indicate the specific GmSTF1/2 proteins. gmstfs-dm was used as the negative control. Actin was used as the loading control. In (A)–(I), data are means ± SE; n ≥ 5. Letters above the bars indicate significant differences (P < 0.05) determined by one-way ANOVA with Tukey’s post hoc test. ns, not significant. The content (μg/g) indicates the amount of specific isoflavones in dry seeds.
Figure 2
Figure 2
GmSTF1 and GmSTF2 promote isoflavonoid biosynthesis in soybean. (A and B) Total isoflavonoid contents in dry seeds of Wm82 and gmstfs-dm, TL1, GmSTF1-YFP, and GmSTF2-YFP soybean. (C and D) Contents of glycitin, daidzin, genistin, 6″-O-malonyldaidzin, 6″-O-malonylgenistin, and 6″-O-malonylglycitin in dry seeds of Wm82 and gmstfs-dm soybean. (E and F) Contents of glycitin, daidzin, genistin, 6″-O-malonyldaidzin, 6″-O-malonylgenistin, and 6″-O-malonylglycitin in dry seeds of TL1, GmSTF1-YFP, and GmSTF2-YFP soybean. In (A)–(F), error bars represent SE (n ≥ 6). Asterisks indicate significant differences (∗P < 0.05, ∗∗P < 0.01, ∗∗∗P < 0.001) determined by two-tailed Student’s t-test. Letters above the bars indicate significant differences (P < 0.05) determined by one-way ANOVA with Tukey’s post hoc test. The content (μg/g) indicates the amount of specific isoflavones in dry seeds. (G) Volcano plots showing differentially expressed genes in Wm82 and gmstfs-dm seedlings grown under LD (14-h light/10-h dark) conditions at 25°C for 15 days. Blue dots indicate significantly downregulated genes in gmstfs-dm. Red dots indicate significantly upregulated genes in gmstfs-dm. (H) Functional category enrichment of the genes regulated in gmstfs-dm vs. Wm82. (I) Venn diagram showing the overlap between sets of differentially expressed genes and genes related to the isoflavonoid biosynthetic pathway. (J) Schematic diagram showing the isoflavonoid biosynthetic pathway in soybean. The 29 GmSTF1- and GmSTF2-regulated genes related to isoflavonoid biosynthesis are listed on the left and right sides.
Figure 3
Figure 3
GmSTF1 and GmSTF2 bind to the promoters of GmPAL2.1 and GmPAL2.3 to activate their transcription. (A and B) Transcript levels of GmPAL2.1 and GmPAL2.3 in Wm82 and gmstfs-dm leaves and immature seeds grown under LD conditions (14-h light/10-h dark) at 25°C for 80 days. Error bars represent SE (n = 3). Letters above the bars indicate significant differences (P < 0.05) determined by one-way ANOVA with Tukey’s post hoc test. (C) Schematic representation of various constructs used for the transient transfection assay in Nicotiana benthamiana leaves. (D and E) Bar graphs showing the activation of GmPAL2.1pro:LUC and GmPAL2.3:pro:LUC reporters by GmSTF1 and GmSTF2. Error bars represent SE (n = 3). Letters above the bars indicate significant differences (P < 0.05) determined by one-way ANOVA with Tukey’s post hoc test. (F) Schematic representation of the GmPAL2.1 and GmPAL2.3 promoters, showing the locations of the ACE and G-box motifs. The numbers represent the locations of the GmPAL2.1 and GmPAL2.3 promoter regions relative to the translation start site (referred to as position +1). (G and H) Yeast one-hybrid assays showing that GmSTF1 and GmSTF2 activate GmPAL2.1pro:LacZ and GmPAL2.3pro:LacZ reporters. (I and J) EMSA showing that GmSTF1 and GmSTF2 bind to GmPAL2.1 and GmPAL2.3 promoter subfragments in vitro. “−” indicates the absence of the corresponding probes or proteins. For GST, “+” indicates that 0.16 pmol is present; for GST-STF1 and GST-STF2, “+” indicates that 0.1 pmol is present; for GmPAL2.1pro and GmPAL2.3pro probes, “+” indicates that 20 fmol is present. Competitor refers to the non-biotin-labeled GmPAL2.1 or GmPAL2.3 probe. FP, free probe. The arrowheads indicate protein–DNA complexes. (K) Promoter structures of GmPAL2.1 and GmPAL2.3, showing the positions of fragments used for chromatin immunoprecipitation (ChIP)–qPCR. (L) ChIP–qPCR assays showing that GmSTF1 associates with the GmPAL2.1 and GmPAL2.3 promoters in vivo. Thirty-day-old TL1 and GmSTF1-YFP soybean leaves were used for ChIP assays. Chromatin fragments were immunoprecipitated using GFP-Trap antibodies. The GmActin gene was used as the negative control. Error bars represent SD (n = 3). Asterisks indicate significant differences (∗∗∗P < 0.001) determined by two-tailed Student’s t-test. ns, not significant.
Figure 4
Figure 4
GmSTF1 and GmSTF2 activate the expression of GmUTG2. (A) Transcript levels of GmUGT2 in Wm82 and gmstfs-dm leaves and immature seeds grown in LD conditions (14-h light/10-h dark) at 25°C for 80 days. Error bars represent SE (n = 3). Letters above the bars indicate significant differences (P < 0.05) determined by one-way ANOVA with Tukey’s post hoc test. (B) Bar graphs showing the activation of the GmUGT2pro:LUC reporter by GmSTF1 and GmSTF2. Error bars represent SE (n = 3). Letters above the bars indicate significant differences (P < 0.05) determined by one-way ANOVA with Tukey’s post hoc test. (C) Schematic representation of the GmUGT2 promoter. The numbers represent the locations of the GmPAL2.1 and GmPAL2.3 promoter regions relative to the translation start site (referred to as position +1). (D) Yeast one-hybrid assays showing that GmSTF1 and GmSTF2 activate the GmUGT2pro:LacZ reporter. (E) EMSA showing that GmSTF1 and GmSTF2 bind to GmUGT2 promoter subfragments in vitro. “−” indicates the absence of corresponding probes or proteins. For GST, “+” indicates that 0.16 pmol is present; for GST-STF1 and GST-STF2, “+” indicates that 0.1 pmol is present; for the GmUGT2pro probe, “+” indicates that 20 fmol is present. Competitor indicates the non-biotin-labeled GmUGT2pro probe. FP, free probe. The arrowheads indicate protein–DNA complexes. (F) ChIP–qPCR assays showing that GmSTF1 associates with the GmUGT2 promoters in vivo. Thirty-day-old TL1 and GmSTF1-YFP soybean leaves were used for the ChIP assays. Chromatin fragments were immunoprecipitated using GFP-Trap antibodies. The GmActin gene was used as the negative control. Error bars represent SE (n = 3). Asterisks indicate significant differences (∗P < 0.05) determined by two-tailed Student’s t-test.
Figure 5
Figure 5
GmBBX4 interacts with GmSTF1 and GmSTF2 and inhibits their transcriptional activation activity toward their target gene. (A) Yeast two-hybrid assays showing that GmBBX4 interacts with GmSTF1 and GmSTF2 proteins. (B and C) LCI assays showing that GmBBX4 interacts with GmSTF1 and GmSTF2 in N. benthamiana leaves. Full-length GmBBX4, GmSTF1, and GmSTF2 were fused to the split N- or C-terminal fragments (LUCN or LUCC) of LUC. LUCN and LUCC were used as negative controls. (D) Co-IP analysis showing that YFP-GmBBX4 interacts with HA-GmSTF1 or HA-GmSTF2. Total protein was extracted from wild tobacco leaves transiently expressing 35S:YFP-GmBBX4 alone or together with 35S:HA-GmSTF1 or 35S:HA-GmSTF2. The immunoprecipitates were detected using anti-GFP and anti-HA antibodies. (E and F) Yeast one-hybrid assays showing that GmBBX4 represses transcriptional activation of the GmPAL2.3pro:LacZ reporter by GmSTF1 or GmSTF2. Error bars represent SE (n = 3). Asterisks indicate significant differences (∗∗∗P < 0.001) determined by two-tailed Student’s t-test. (G and H) Transient transfection assays showing that GmBBX4 represses the transcriptional activation of the GmPAL2.3pro:LUC reporter by GmSTF1 and GmSTF2. Error bars represent SE (n = 3). Asterisks indicate significant differences (∗∗∗P < 0.001) determined by two-tailed Student’s t-test. (I–K) Transcript levels of GmPAL2.1, GmPAL2.3, and GmUTG2 in Wm82, gmbbx4, and YFP-GmBBX4 #1 and #3 soybean plants. Plants were grown in LD conditions (14-h light/10-h dark) at 25°C for 15 days, after which the leaves were collected for RNA extraction and qRT–PCR analysis. Error bars represent SE (n = 3). Asterisks indicate significant differences (∗P < 0.05, ∗∗P < 0.01, ∗∗∗P < 0.001) determined by two-tailed Student’s t-test.
Figure 6
Figure 6
GmBBX4 negatively regulates isoflavonoid biosynthesis in soybean. (A) Transcript levels of GmBBX4 in immature seeds of Wm82 and gmstfs-dm soybean grown in LD conditions (14-h light/10-h dark) at 25°C for 80 days. Error bars represent SE (n = 3). Asterisks indicate significant differences (∗∗P < 0.01) determined by two-tailed Student’s t-test. (B and C) Transcript levels of GmSTF1 and GmSTF2 in immature seeds of Wm82 and gmbbx4 soybean grown in LD conditions (14-h light/10-h dark) at 25°C for 80 days. Error bars represent SE (n = 3). ns, not significant. (D) ChIP–qPCR assays showing that GmSTF1 associates with the GmBBX4 promoter in vivo. Thirty-day-old TL1 and GmSTF1-YFP soybean leaves were used for the ChIP assays. Chromatin fragments were immunoprecipitated using GFP-Trap antibodies. The GmActin gene was used as the negative control. Error bars represent SE (n = 3). Asterisks indicate significant differences (∗P < 0.05) determined by two-tailed Student’s t-test. (E) EMSA showing that GmSTF1 and GmSTF2 bind to GmBBX4 promoter subfragments in vitro. “−” indicates absence of the corresponding probes or proteins. For GST, “+” indicates that 0.16 pmol is present; for GST-STF1 and GST-STF2, “+” indicates that 0.1 pmol is present; for the GmBBX4pro probe, “+” indicates that 20 fmol is present. Competitor indicates the non-biotin-labeled GmBBX4pro probe. FP, free probe. Arrowheads indicate protein–DNA complexes. (F) Total isoflavonoid contents in dry seeds of Wm82, gmbbx4, YFP-GmBBX4 #1, and YFP-GmBBX4 #3 soybean. (G) Glycitein and genistein contents in dry seeds of Wm82, gmbbx4, YFP-GmBBX4 #1, and YFP-GmBBX4 #3 soybean. (H) Daidzin, glycitin, and genistin contents in dry seeds of Wm82, gmbbx4, YFP-GmBBX4 #1, and YFP-GmBBX4 #3 soybean. (I) 6″-O-malonylglycitin, 6″-O-malonyldaidzin, and 6″-O-malonylgenistin contents in dry seeds of Wm82, gmbbx4, YFP-GmBBX4 #1, and YFP-GmBBX4 #3 soybean. In (A)–(D), data are means ± SE; n ≥ 3. Letters above the bars indicate significant differences (P < 0.05) determined by one-way ANOVA with Tukey’s post hoc test. The experiments were performed three times with similar results. The content (μg/g) indicates the amount of specific isoflavones in dry seeds.
Figure 7
Figure 7
Photoreceptors control the expression of GmSTF target genes. (A) Transcript levels of GmPAL2.1, GmPAL2.3, and GmUGT2 in Wm82, gmphot1s-tm, and gmphot2s-dm soybean seeds determined by qRT–PCR. (B) Transcript levels of GmPAL2.1, GmPAL2.3, and GmUGT2 in TL1, gmcry1s-qm, and gmcry2s-tm soybean seeds determined by qRT–PCR. (C) A proposed working model for control of isoflavonoid biosynthesis by a photoreceptors–GmSTF–GmBBX4 regulatory module in soybean. Light-activated GmCRY1s, GmCRY2s, GmPHOT1s, and GmPHOT2s stabilize GmSTFs, whereas GmCOP1b negatively controls their abundance in the light. GmSTF1 and GmSTF2 promote isoflavonoid biosynthesis by activating a group of genes involved in the isoflavonoid biosynthetic pathway. GmBBX4 interacts with GmSTFs to repress their transcriptional activation activity. On the other hand, GmSTFs inhibit GmBBX4 at the transcriptional level. Thus, GmBBX4 and GmSTFs form a negative feedback loop that regulates isoflavonoid biosynthesis in soybean. In (A) and (B), data shown are relative to the control gene GmActin and represent means ± SE of three biological replicates. Asterisks indicate significant differences (∗P < 0.05, ∗∗∗P < 0.001) determined by two-tailed Student’s t-test. The indicated soybean mutants were grown in LD conditions at 25°C for 80 days, after which immature seeds were harvested at the R5 stage for RNA extraction and qRT–PCR analysis.

References

    1. Alba R., Kelmenson P.M., Cordonnier-Pratt M.M., Pratt L.H. The phytochrome gene family in tomato and the rapid differential evolution of this family in angiosperms. Mol. Biol. Evol. 2000;17:362–373. - PubMed
    1. Anguraj Vadivel A.K., McDowell T., Renaud J.B., Dhaubhadel S. A combinatorial action of GmMYB176 and GmbZIP5 controls isoflavonoid biosynthesis in soybean (Glycine max) Commun. Biol. 2021;4:356. - PMC - PubMed
    1. Araguirang G.E., Richter A.S. Activation of anthocyanin biosynthesis in high light - what is the initial signal? New Phytol. 2022;236:2037–2043. - PubMed
    1. Bai S., Tao R., Tang Y., Yin L., Ma Y., Ni J., Yan X., Yang Q., Wu Z., Zeng Y., et al. BBX16, a B-box protein, positively regulates light-induced anthocyanin accumulation by activating MYB10 in red pear. Plant Biotechnol. J. 2019;17:1985–1997. - PMC - PubMed
    1. Bai S., Tao R., Yin L., Ni J., Yang Q., Yan X., Yang F., Guo X., Li H., Teng Y. Two B-box proteins, PpBBX18 and PpBBX21, antagonistically regulate anthocyanin biosynthesis via competitive association with Pyrus pyrifolia ELONGATED HYPOCOTYL 5 in the peel of pear fruit. Plant J. 2019;100:1208–1223. - PubMed

LinkOut - more resources