. 2023 Oct;20(207):20230443.
doi: 10.1098/rsif.2023.0443. Epub 2023 Oct 11.

Information theory-based direct causality measure to assess cardiac fibrillation dynamics

Affiliations

Information theory-based direct causality measure to assess cardiac fibrillation dynamics

Xili Shi et al. J R Soc Interface. 2023 Oct.

Abstract

Understanding the mechanism sustaining cardiac fibrillation can facilitate the personalization of treatment. Granger causality analysis can be used to determine the existence of a hierarchical fibrillation mechanism that is more amenable to ablation treatment in cardiac time-series data. Conventional Granger causality based on linear predictability may fail if the assumption is not met or given sparsely sampled, high-dimensional data. More recently developed information theory-based causality measures could potentially provide a more accurate estimate of the nonlinear coupling. However, despite their successful application to linear and nonlinear physical systems, their use is not known in the clinical field. Partial mutual information from mixed embedding (PMIME) was implemented to identify the direct coupling of cardiac electrophysiology signals. We show that PMIME requires less data and is more robust to extrinsic confounding factors. The algorithms were then extended for efficient characterization of fibrillation organization and hierarchy using clinical high-dimensional data. We show that PMIME network measures correlate well with the spatio-temporal organization of fibrillation and demonstrated that hierarchical type of fibrillation and drivers could be identified in a subset of ventricular fibrillation patients, such that regions of high hierarchy are associated with high dominant frequency.

Keywords: Granger causality; complexity; fibrillation; information theory.


Conflict of interest statement

B.H., X.L., F.S.N. and N.P. are applicants for a patent to Granger Causality Fibrillation Mapping (UK Patent Application no. 1903259.8).

Figures
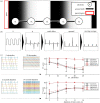
Figure 1.
Figure 1.
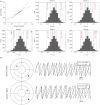
Sensitivity of CGC and PMIME to data availability. Performance evaluated by F1 scores of 100 simulations. (a) Schematic of the simulation protocol. (b) Signal processing steps for CGC and PMIME. (c) Performance results averaged over two critical values (α = 0.01, 0.05) and the range of the other factor; error bars correspond to the standard deviation. Top: effects of the number of electrodes included as inputs. Bottom: effects of time series duration.
Figure 2.
Figure 2.
Sensitivity of CGC and PMIME to common confounding factors. Performance evaluated by F1 scores of 500 simulations. (a) Schematic of the simulation protocol. (b) Signal processing steps for CGC and PMIME. (c) Performance results averaged over two critical values (α = 0.01, 0.05) and the range of the other factor; error bars correspond to the standard deviation. Top: effects of Gaussian noise of varied signal-to-noise ratio. Bottom: effects of mixing of far-field activation at various distances.
Figure 3.
Figure 3.
Comparison of CGC and PMIME when applied to data projected to linear subspace. (a) Simulation set-up and example of singular value decomposition (SVD) of the high-dimensional data followed by causality analysis. (b) Comparison of CGC and PMIME in determining the causal direction in high-dimensional data. Causal or non-causal by each measurements are based on Mann–Whitney U-test of 500 surrogates versus 10 simulation data. (c) Comparison of differentiating driver versus non-driver region based on Ccontrast of CGC and PMIME causal networks. Asterisk indicates significance of Tukey’s HSD test: *p < 0.05; **p < 0.01.
Figure 4.
Figure 4.
Applying network analysis to PMIME network for spatial–temporal characterization of fibrillation dynamics. (a) Network measures regressed to the phase mapping measure, the number of locations occupied by phase singularities (LPS). The columns, left to right, show connectance, number of clusters and size of the largest cluster, where the first and second row are 16× and 64× spatial down-sampled data, respectively. (b) Example phase map and node degree of bidirectional PMIME network. Extremities of the organization spectrum are shown, where the respective data points in the regression are marked by red box: disorganized and blue circle: organized. Asterisks denote the significance of Pearson’s correlation tests, n = 15: *p < 0.05; **p < 0.01.
Figure 5.
Figure 5.
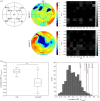
Applying network analysis for identifying driver region in clinical VF data. (a) Quantile–quantile plot of real (n = 5) versus surrogates (n = 500) Ccontrast distribution, and real regional Ccontrast for each patient (black vertical line) compared to surrogate Ccontrast distribution (grey box). The upper and lower bound of 2.5–97.5th percentile range of surrogate distribution is indicated by red dashed lines. Regions outside the range are labelled. (b) Example signal phase traces from the source and sink regions identified.
Figure 6.
Figure 6.
Correlation of the theoretical measure Ccontrast with empirical driver marker dominant frequency (DF). (a) Z-scored DF heat maps and corresponding PMIME network adjacency matrix of the hierarchical cases. (b) Comparing region-wise correlation coefficients of DF and Ccontrast of real and surrogate data. Box-plots are the coefficient of real (n = 5) and surrogates (n = 500), where each n is one patient or a permutation of nine regions. Right-hand panel shows the correlation in each patient (black lines) compared to the surrogate correlation distribution (grey box). The red dashed line indicates the upper 2.5% cutoff of surrogate distribution. **p < 0.01.

References

    1. Nash MP, Mourad A, Clayton RH, Sutton PM, Bradley CP, Hayward M, Paterson DJ, Taggart P. 2006. Evidence for multiple mechanisms in human ventricular fibrillation. Circulation 114, 536-542. ( 10.1161/CIRCULATIONAHA.105.602870) - DOI - PubMed
    1. Ng FS, Handa BS, Li X, Peters NS. 2020. Toward mechanism-directed electrophenotype-based treatments for atrial fibrillation. Front. Physiol. 11, 202000987. ( 10.3389/fphys.2020.00987) - DOI - PMC - PubMed
    1. Haissaguerre M, et al. 2022. Purkinje network and myocardial substrate at the onset of human ventricular fibrillation: implications for catheter ablation. Eur. Heart J. 43, 1234-1247. ( 10.1093/eurheartj/ehab893) - DOI - PMC - PubMed
    1. Kuck KH, et al. 2016. Cryoballoon or radiofrequency ablation for paroxysmal atrial fibrillation. J. Cardiopulm. Rehabil. Prev. 36, 393-394. ( 10.1056/NEJMoa1602014) - DOI
    1. Benjamin EJ, et al. 2019. Heart disease and stroke statistics—2019 update: a report from the American Heart Association. Circulation 139, e56-e528. ( 10.1161/CIR.0000000000000659) - DOI - PubMed

Publication types

LinkOut - more resources