

Reversion of chemoresistance by endocannabinoid-induced ER stress and autophagy activation in ovarian cancer
- PMID: 37818056
- PMCID: PMC10560944
Reversion of chemoresistance by endocannabinoid-induced ER stress and autophagy activation in ovarian cancer
Abstract
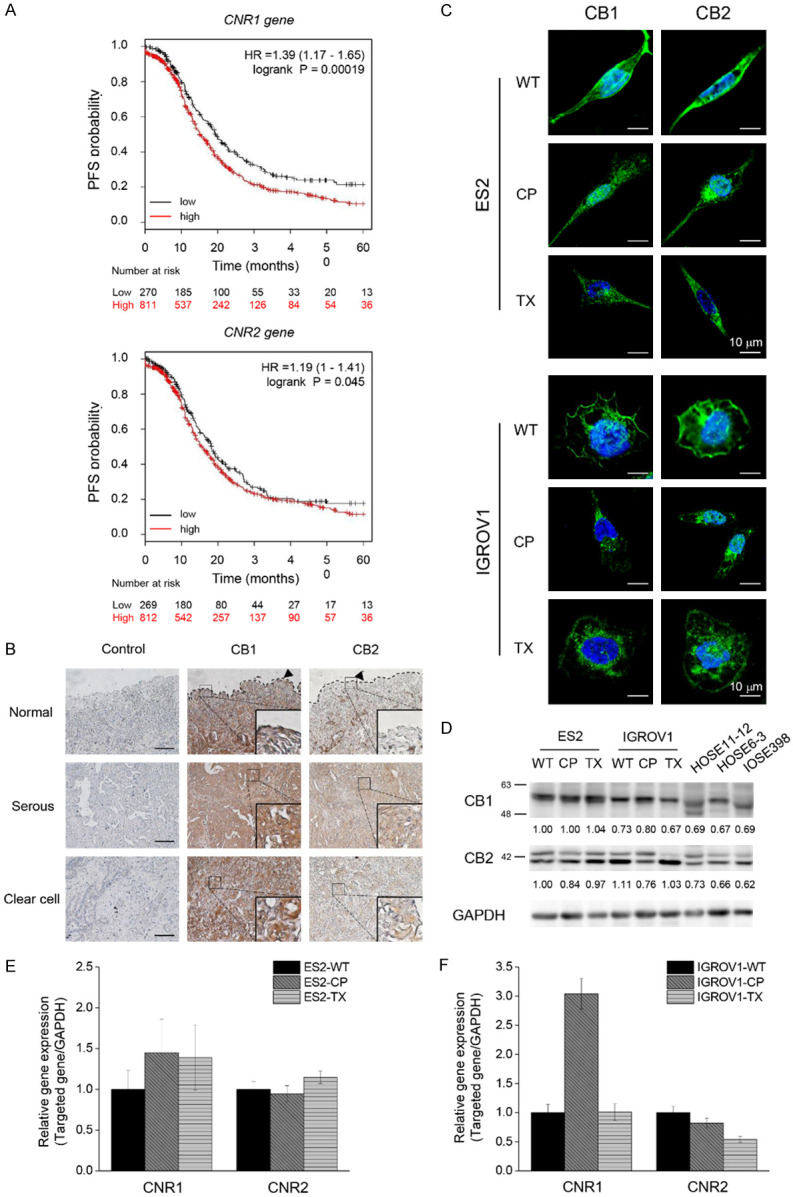
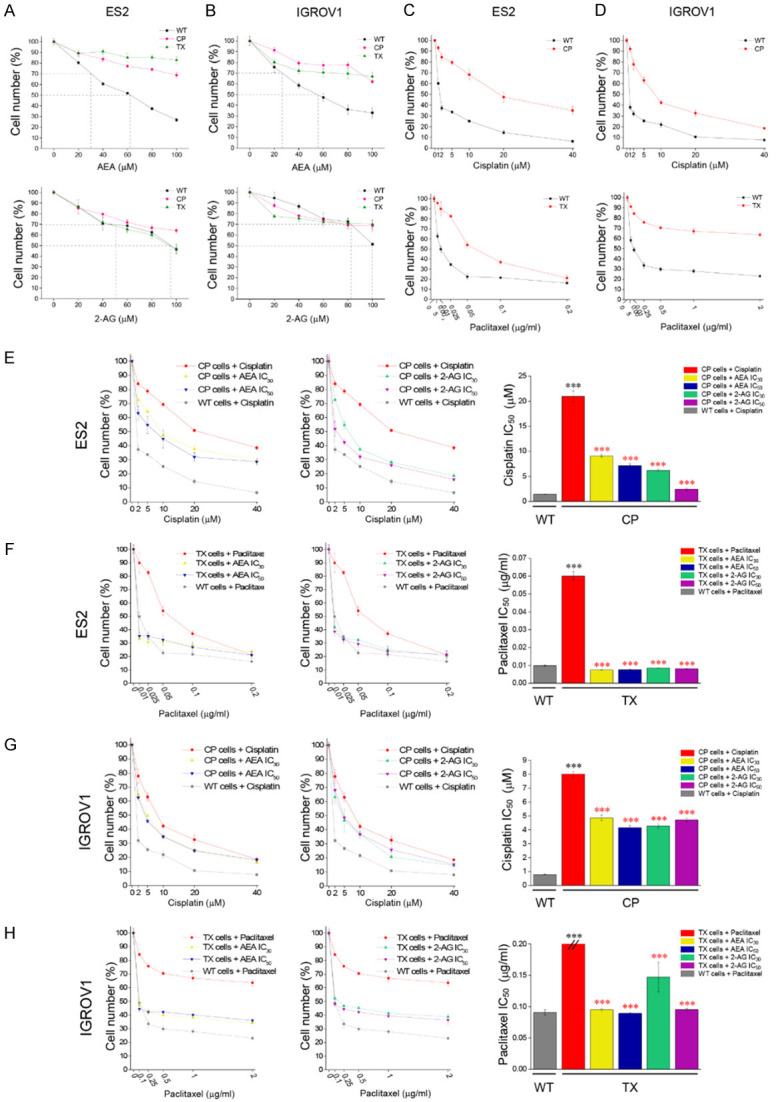
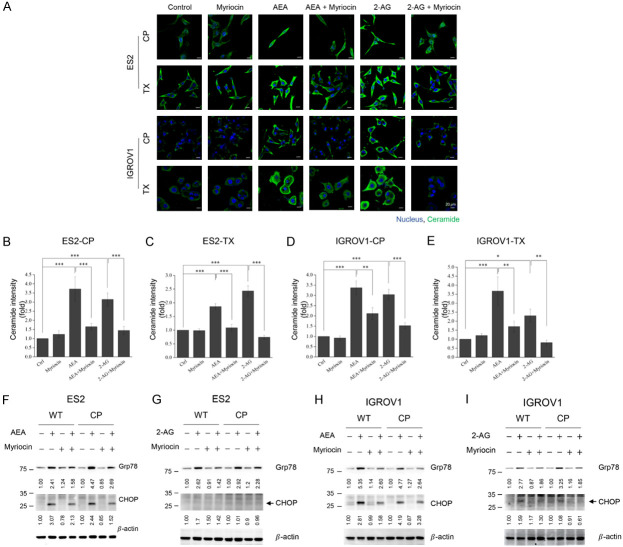
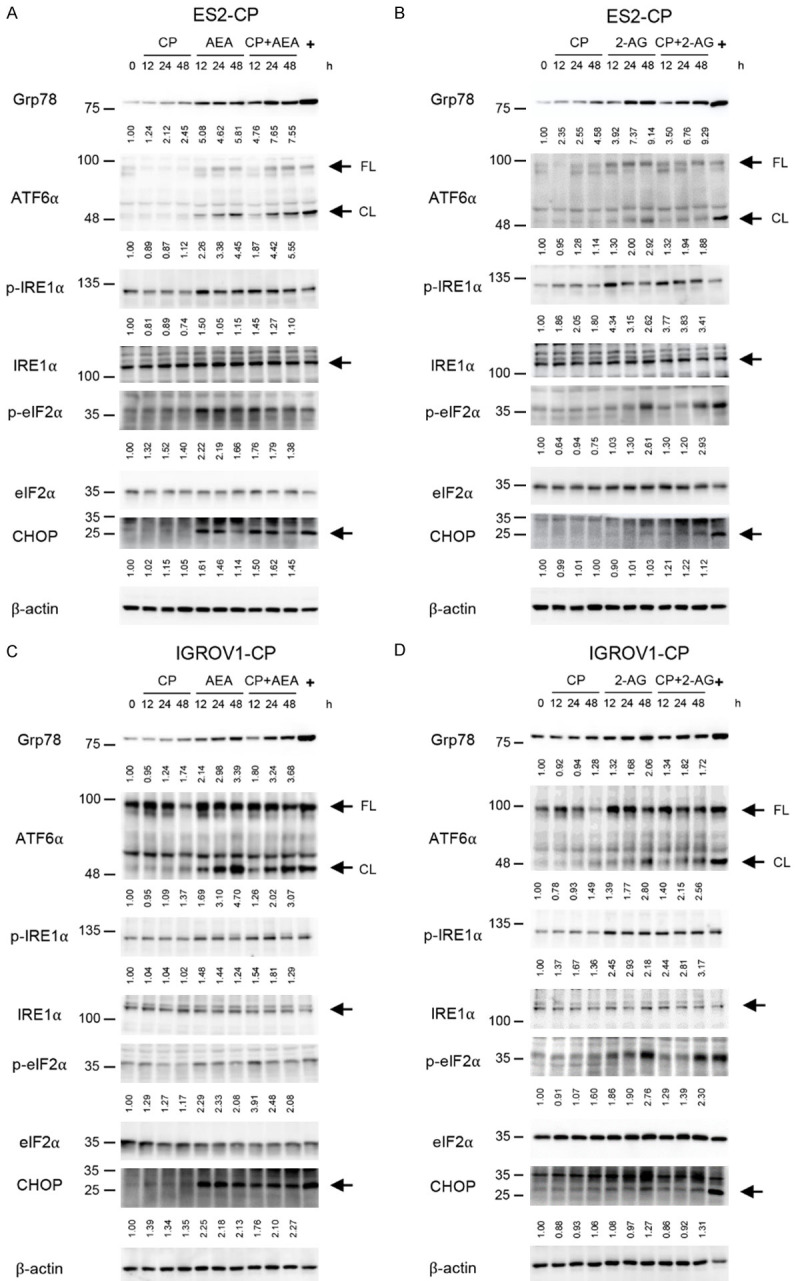
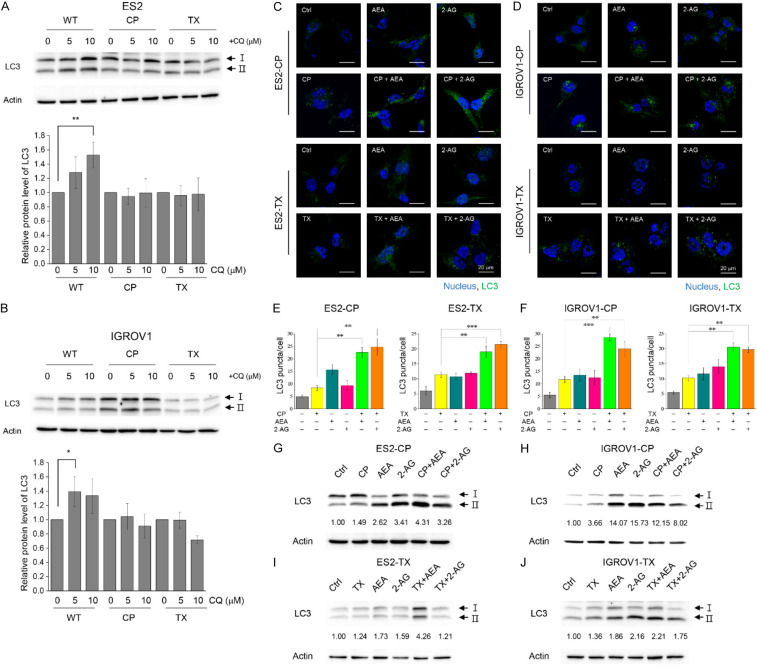
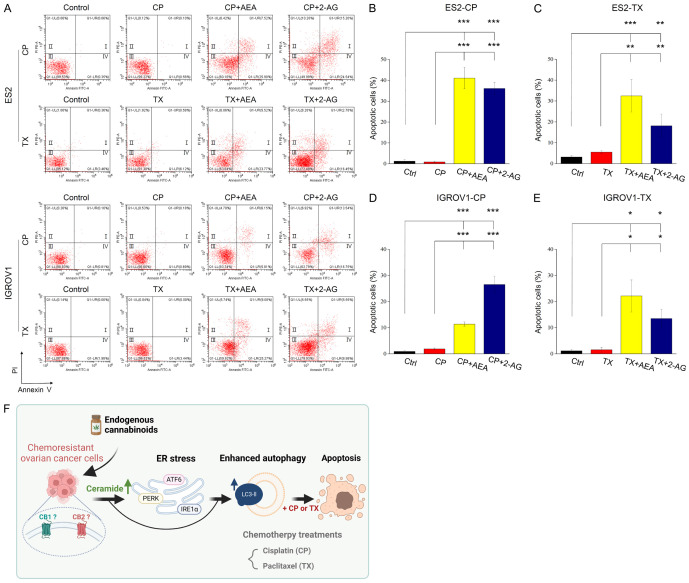
The difficulty of detection at an early stage and the ease of developing resistance to chemotherapy render ovarian cancer (OVC) difficult to cure. Although several novel cancer therapies have been developed recently, drug resistance remains a concern since chemotherapy remains as the most commonly used treatment for cancer patients. Therefore, there is an urgent need to reclaim potential combination treatments for OVC. So far, there have been several research targeting the endocannabinoid system (ECS) in cancer. Among the various cannabinoid-based drugs, endocannabinoids, which are lipid molecules generated in the body, have been reported to produce many anti-tumor effects; however, research investigating the anti-chemoresistance effect of endocannabinoids in OVC remains unclear. In this study, we aimed to combine endocannabinoids, anandamide (AEA), and 2-arachidonoylglycerol (2-AG) with chemotherapeutic drugs as a combination approach to treat OVC. Our results showed that OVC cells expressed both cannabinoid receptors (CBR), CB1 and CB2, suggesting the possibility of endocannabinoid system (ECS) as a target. We found that the anti-chemoresistance effect mediated by endocannabinoids was caused by upregulation of ceramide levels, leading to severe endoplasmic reticulum (ER) stress and increased autophagy in chemoresistant cancer cells. Therefore, chemoresistant cancer cell growth was inhibited, and cell apoptosis was induced under combined treatments. Based on our results, endocannabinoids overcomed chemoresistance of OVC cells in vitro. Our findings suggest that drugs targeting ECS may have the potential to be adjuvants for chemotherapy by increasing the efficacy of chemotherapeutic drugs and decreasing their side effects.
Keywords: ER stress; Ovarian cancer; autophagy; chemoresistance; endocannabinoid system.
AJCR Copyright © 2023.
Conflict of interest statement
None.
Figures
Similar articles
-
Anandamide-induced endoplasmic reticulum stress and apoptosis are mediated by oxidative stress in non-melanoma skin cancer: Receptor-independent endocannabinoid signaling.Mol Carcinog. 2016 Nov;55(11):1807-1821. doi: 10.1002/mc.22429. Epub 2015 Oct 29. Mol Carcinog. 2016. PMID: 26513129
-
Alterations in endocannabinoid tone following chemotherapy-induced peripheral neuropathy: effects of endocannabinoid deactivation inhibitors targeting fatty-acid amide hydrolase and monoacylglycerol lipase in comparison to reference analgesics following cisplatin treatment.Pharmacol Res. 2013 Jan;67(1):94-109. doi: 10.1016/j.phrs.2012.10.013. Epub 2012 Nov 2. Pharmacol Res. 2013. PMID: 23127915 Free PMC article.
-
Changes in the expression of endocannabinoid system components in an experimental model of chemotherapy-induced peripheral neuropathic pain: Evaluation of sex-related differences.Exp Neurol. 2023 Jan;359:114232. doi: 10.1016/j.expneurol.2022.114232. Epub 2022 Sep 28. Exp Neurol. 2023. PMID: 36179876
-
The Endocannabinoid System Modulating Levels of Consciousness, Emotions and Likely Dream Contents.CNS Neurol Disord Drug Targets. 2017;16(4):370-379. doi: 10.2174/1871527316666170223161908. CNS Neurol Disord Drug Targets. 2017. PMID: 28240187 Review.
-
Endocannabinoid system and mood disorders: priming a target for new therapies.Pharmacol Ther. 2013 Apr;138(1):18-37. doi: 10.1016/j.pharmthera.2012.12.002. Epub 2012 Dec 20. Pharmacol Ther. 2013. PMID: 23261685 Review.
Cited by
-
Cannabis and cancer: unveiling the potential of a green ally in breast, colorectal, and prostate cancer.J Cannabis Res. 2024 May 16;6(1):24. doi: 10.1186/s42238-024-00233-z. J Cannabis Res. 2024. PMID: 38755733 Free PMC article. Review.
-
Hyptolide induces ER stress-mediated cell death and enhances GSK3β-regulated cisplatin chemosensitivity in ovarian cancer.J Ovarian Res. 2025 Jun 12;18(1):129. doi: 10.1186/s13048-025-01712-4. J Ovarian Res. 2025. PMID: 40506749 Free PMC article.
-
The endocannabinoid system in cancer biology: a mini-review of mechanisms and therapeutic potential.Oncol Rev. 2025 Apr 30;19:1573797. doi: 10.3389/or.2025.1573797. eCollection 2025. Oncol Rev. 2025. PMID: 40370489 Free PMC article. Review.
-
Exosomal misfolded proteins released by cancer stem cells: dual functions in balancing protein homeostasis and orchestrating tumor progression.Discov Oncol. 2024 Aug 31;15(1):392. doi: 10.1007/s12672-024-01262-z. Discov Oncol. 2024. PMID: 39215782 Free PMC article. Review.
References
-
- Siegel RL, Miller KD, Fuchs HE, Jemal A. Cancer statistics, 2021. CA Cancer J Clin. 2021;71:7–33. - PubMed
-
- Shaik B, Zafar T, Balasubramanian K, Gupta SP. An overview of ovarian cancer: molecular processes involved and development of target-based chemotherapeutics. Curr Top Med Chem. 2021;21:329–46. - PubMed
-
- Lhomond S, Avril T, Dejeans N, Voutetakis K, Doultsinos D, McMahon M, Pineau R, Obacz J, Papadodima O, Jouan F, Bourien H, Logotheti M, Jégou G, Pallares-Lupon N, Schmit K, Le Reste PJ, Etcheverry A, Mosser J, Barroso K, Vauléon E, Maurel M, Samali A, Patterson JB, Pluquet O, Hetz C, Quillien V, Chatziioannou A, Chevet E. Dual IRE1 RNase functions dictate glioblastoma development. EMBO Mol Med. 2018;10:e7929. - PMC - PubMed
LinkOut - more resources
Full Text Sources
Miscellaneous