. 2023 Dec;49(6):e12943.
doi: 10.1111/nan.12943.

RNA sequencing of peripheral blood in amyotrophic lateral sclerosis reveals distinct molecular subtypes: Considerations for biomarker discovery

Affiliations

RNA sequencing of peripheral blood in amyotrophic lateral sclerosis reveals distinct molecular subtypes: Considerations for biomarker discovery

Natalie Grima et al. Neuropathol Appl Neurobiol. 2023 Dec.

Abstract

Aim: Amyotrophic lateral sclerosis (ALS) is a heterogeneous neurodegenerative disease with limited therapeutic options. A key factor limiting the development of effective therapeutics is the lack of disease biomarkers. We sought to assess whether biomarkers for diagnosis, prognosis or cohort stratification could be identified by RNA sequencing (RNA-seq) of ALS patient peripheral blood.

Methods: Whole blood RNA-seq data were generated for 96 Australian sporadic ALS (sALS) cases and 48 healthy controls (NCBI GEO accession GSE234297). Differences in sALS-control gene expression, transcript usage and predicted leukocyte proportions were assessed, with pathway analysis used to predict the activity state of biological processes. Weighted Gene Co-expression Network Analysis (WGCNA) and machine learning algorithms were applied to search for diagnostic and prognostic gene expression patterns. Unsupervised clustering analysis was employed to determine whether sALS patient subgroups could be detected.

Results: Two hundred and forty-five differentially expressed genes were identified in sALS patients relative to controls, with enrichment of immune, metabolic and stress-related pathways. sALS patients also demonstrated switches in transcript usage across a small set of genes. We established a classification model that distinguished sALS patients from controls with an accuracy of 78% (sensitivity: 79%, specificity: 75%) using the expression of 20 genes. Clustering analysis identified four patient subgroups with gene expression signatures and immune cell proportions reflective of distinct peripheral effects.

Conclusions: Our findings suggest that peripheral blood RNA-seq can identify diagnostic biomarkers and distinguish molecular subtypes of sALS patients however, its prognostic value requires further investigation.

Keywords: RNA-seq; amyotrophic lateral sclerosis; biomarker; ferroptosis; immune response; metabolism; peripheral blood; transcriptome.


Conflict of interest statement

The authors declare no competing interests.

Figures

FIGURE 1
FIGURE 1
Differentially expressed genes indicated alteration of metabolic pathways, immune response and cell stress in sALS peripheral blood. (A) Volcano plot comparing sALS patients with controls. Pink and green dots represent genes that were upregulated and downregulated, respectively (FDR < 0.05) while grey dots are genes that were not differentially expressed. (B) GO biological processes and KEGG pathways enriched in the sALS–control differentially expressed genes. The most representative member (lowest p‐value) of each GO term cluster is displayed. Log2 fold change indicates enrichment of member genes in differentially expressed genes vs all detected genes. (C) Example IPA upstream analysis network for transcription factor STAT1, which was predicted to be activated in sALS. Red genes were upregulated and green genes were downregulated in sALS vs controls. Orange arrows indicate predicted activation, blue lines indicate predicted inhibition and grey arrows indicate no effect predicted. (D) Biological pathways predicted by IPA to have altered activity in sALS based on differentially expressed genes. Individual bubbles represent ingenuity canonical pathways (x‐axis), which have been categorised into their member biological pathways (y‐axis). Orange and blue bubbles represent pathways predicted to be activated or inhibited, respectively (z‐score). The bubble size represents the p‐value, which indicates the probability of association of differentially expressed genes with the ingenuity canonical pathway by random chance alone (right‐tailed Fisher's exact test).
FIGURE 2
FIGURE 2
Fifteen genes were identified to have differential transcript usage between sALS patients and controls. FBXO31 is shown as a representative example (see Figure S5 for other genes). Top panel: visual depiction of assessed transcripts and their functional domains. Bottom panel: comparison of gene expression (left), isoform expression (middle) and isoform fraction (right) between control and ALS patient groups. Significant differences are indicated by an asterisk.
FIGURE 3
FIGURE 3
Application of machine learning to peripheral blood gene expression accurately distinguished sALS patients from controls. (A) The distribution of sALS patient disease duration was heavily skewed. (B) The ROC curves of the sALS–control classification results using the top 20 genes identified from different input feature sets. (C), (D) Scatter plots of the true disease duration vs predicted disease duration using regression models. Gene expression data without (C) or with (D) clinical data (sex, age at collection, site of onset) were used as input.
FIGURE 4
FIGURE 4
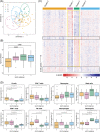
Unsupervised clustering analysis of blood gene expression data identified four sALS subgroups. (A) Cluster membership of the 96 sALS cases is visualised on a t‐SNE plot. Ellipses indicate 95% confidence intervals for each cluster. (B) Age at collection was identified to be significantly different between sALS subgroups (p = 0.0029, Kruskal–Wallis rank‐sum test). Significant p‐values (FDR < 0.05) from post hoc Wilcoxon rank‐sum exact tests are displayed. (C) Heatmap of 5756 genes identified to be significantly differentially expressed between sALS subgroups using the overlap method. Genes defining cluster 0 relative to all other clusters are highlighted by the black boxes. Genes defining clusters 1 and 2 are highlighted by the yellow boxes. Gene counts are z‐score normalised. (D) Proportions of eight major leukocytes were variable between sALS subgroups. Cell type proportions identified to be significantly different between sALS subgroups are indicated by asterisks (post hoc Wilcoxon rank‐sum exact test with Benjamini‐Hochberg correction; *p < 0.05, **p < 0.001, ***p < 0.0001). Cell types were deconvolved from bulk blood RNA‐seq using CIBERSORTx and the LM22 signature matrix. Dendritic cells, eosinophils, γδT cells and plasma cells made up <1% of the total cell proportion across subgroups so were excluded from the analysis.
FIGURE 5
FIGURE 5
GO biological processes and KEGG pathways enriched for genes that were significantly upregulated or downregulated in sALS subgroups. The number of differentially expressed genes (DEGs) for each cluster is indicated by n value. Enrichment analysis was not performed on cluster 3 because of a low number of overlapping DEGs. The most representative member (lowest p‐value) of the top ten GO term clusters is displayed. Gene count indicates the number of DEGs in each pathway. Log2 fold change indicates enrichment of member genes in DEGs vs all detected genes. A complete list of enriched pathways can be found in Tables S13a‐f.

References

    1. Verber NS, Shepheard SR, Sassani M, et al. Biomarkers in motor neuron disease: a state of the art review. Front Neurol. 2019;10:291. doi:10.3389/fneur.2019.00291 - DOI - PMC - PubMed
    1. Saris CGJ, Horvath S, van Vught PWJ, et al. Weighted gene co‐expression network analysis of the peripheral blood from amyotrophic lateral sclerosis patients. BMC Genomics. 2009;10(1):405. doi:10.1186/1471-2164-10-405 - DOI - PMC - PubMed
    1. Van Rheenen W, Diekstra FP, Harschnitz O, et al. Whole blood transcriptome analysis in amyotrophic lateral sclerosis: a biomarker study. PLoS ONE. 2018;13(6):e0198874. doi:10.1371/journal.pone.0198874 - DOI - PMC - PubMed
    1. Liguori M, Nuzziello N, Introna A, et al. Dysregulation of microRNAs and target genes networks in peripheral blood of patients with sporadic amyotrophic lateral sclerosis. Front Mol Neurosci. 2018;11:288. doi:10.3389/fnmol.2018.00288 - DOI - PMC - PubMed
    1. Mougeot JLC, Li Z, Price AE, Wright FA, Brooks BR. Microarray analysis of peripheral blood lymphocytes from ALS patients and the SAFE detection of the KEGG ALS pathway. BMC Med Genomics. 2011;4(1):1‐19, 74. doi:10.1186/1755-8794-4-74 - DOI - PMC - PubMed

Publication types