. 2023 Nov 1;14(21):3913-3927.
doi: 10.1021/acschemneuro.3c00464. Epub 2023 Oct 11.

Evaluation of N- and O-Linked Indole Triazines for a Dual Effect on α-Synuclein and Tau Aggregation

Affiliations

Evaluation of N- and O-Linked Indole Triazines for a Dual Effect on α-Synuclein and Tau Aggregation

Eduardo Ramirez et al. ACS Chem Neurosci. .

Abstract

Alzheimer's disease (AD) is the most prevalent neurodegenerative disorder underlying dementia in the geriatric population. AD manifests by two pathological hallmarks: extracellular amyloid-β (Aβ) peptide-containing senile plaques and intraneuronal neurofibrillary tangles comprised of aggregated hyperphosphorylated tau protein (p-tau). However, more than half of AD cases also display the presence of aggregated α-synuclein (α-syn)-containing Lewy bodies. Conversely, Lewy bodies disorders have been reported to have concomitant Aβ plaques and neurofibrillary tangles. Our drug discovery program focuses on the synthesis of multitarget-directed ligands to abrogate aberrant α-syn, tau (2N4R), and p-tau (1N4R) aggregation and to slow the progression of AD and related dementias. To this end, we synthesized 11 compounds with a triazine-linker and evaluated their effectiveness in reducing α-syn, tau isoform 2N4R, and p-tau isoform 1N4R aggregation. We utilized biophysical methods such as thioflavin T (ThT) fluorescence assays, transmission electron microscopy (TEM), photoinduced cross-linking of unmodified proteins (PICUP), and M17D intracellular inclusion cell-based assays to evaluate the antiaggregation properties and cellular protection of our best compounds. We also performed disaggregation assays with isolated Aβ-plaques from human AD brains. Our results demonstrated that compound 10 was effective in reducing both oligomerization and fibril formation of α-syn and tau isoform 2N4R in a dose-dependent manner via ThT and PICUP assays. Compound 10 was also effective at reducing the formation of recombinant α-syn, tau 2N4R, and p-tau 1N4R fibrils by TEM. Compound 10 reduced the development of α-syn inclusions in M17D neuroblastoma cells and stopped the seeding of tau P301S using biosensor cells. Disaggregation experiments showed smaller Aβ-plaques and less paired helical filaments with compound 10. Compound 10 may provide molecular scaffolds for further optimization and preclinical studies for neurodegenerative proteinopathies.

Keywords: antiaggregation compounds; hyperphosphorylated tau; paired helical filaments; tau; α-Synuclein.


Conflict of interest statement

The authors declare no competing financial interest.

Figures

Scheme 1
Scheme 1. Preparation of Monosubstituted Triazine Derivatives Using 2,4-Dichloro-1,3,5-triazine
Scheme 2
Scheme 2. Preparation of Disubstituted Triazine Derivatives Using 2,4-Dichloro-1,3,5-triazine
Figure 1
Figure 1
Kinetic curves of the best compound exhibiting the lowest FI (i.e., compound 10). A disubstituted O-triazine, i.e., compound 7, was selected as a negative control. Compound 10 is a disubstituted N-triazine. Compounds 7 and 10 were tested at a final concentration of 100 μM in the presence of α-syn at 2 μM. The control (CTRL) consists of α-syn admixed with 0.25% DMSO without compound treatment. The curves represent the average of 3 technical replicates.
Figure 2
Figure 2
Kinetics of tau isoform 2N4R and p-tau isoform 1N4R fibril formation obtained with different compounds monitored using thioflavin fluorescence assays. (A) The compounds were tested at a final concentration of 100 μM in the presence of tau 2N4R at 6 μM. Compound 7 was used as a negative control. CTRL, control; BG, background. (B) The compounds were tested at a final concentration of 48 and 96 μM in the presence of p-tau 1N4R at 6 μM. Apomorphine was used as a positive control. The curves result from the average of 3 technical replicates. CTRL, control; BG, background.
Figure 3
Figure 3
Curve showing a dose-dependent reduction of tau 2N4R fibril formation by compound 10. Incubations were carried out with 6 μM tau isoform 2N4R at 42 h with varying concentrations of compound 10 evaluated by the ThT fluorescence assay. For each concentration (3.125, 6.25, 12.5, 25, 50, 100 μM), triplicate data were collected from five consecutive time points at the plateau phase. The resulting molar ratios (protein:compound) consist of ∼1:0 (control DMSO), 1:0.5 (compound at 3.125 μM), 1:1 (compound at 6.25 μM), 1:2 (compound at 12.5 μM), 1:4 (compound at 25 μM), 1:8 (compound at 50 μM), and 1:16 (compound at 100 μM).
Figure 4
Figure 4
Triazine derivative compound 10 inhibits the α-syn and tau isoform 2N4R oligomer formation in contrast to other representatives. (A) α-Syn (60 μM) was cross-linked (PICUP assay) with different compounds at 50 μM (∼molar ratio 1:0.8). (B) Tau isoform 2N4R (6 μM) was cross-linked (PICUP assay) with different compounds at 50 μM (∼molar ratio 1:8). The monomeric form of the protein was observed across all of the conditions and compounds. Coomassie blue-stained 16% polyacrylamide gel showed higher molecular weight of α-syn and tau oligomers with the DMSO control (A, lane 3) as well as compound 7 (A, lane 4). Only compound 10 was effective in stopping the formation of α-syn and tau 2N4R oligomerization (uncross-linked) (A, lanes 5; B, lane 5).
Figure 5
Figure 5
Triazine derivatives, compound 10, inhibit the α-syn and tau isoform 2N4R oligomerization in a dose-dependent manner. (A) α-Syn (60 μM) and (B) tau isoform 2N4R (6 μM) were cross-linked (PICUP assay) with different concentrations of compound 10. Disubstituted aminoindole triazine, compound 10, was tested at the following concentrations: 50 μM, 12.5 μM, 3.125 μM. Compound 7 at 50 μM was utilized as a negative control for both experiments.
Figure 6
Figure 6
Ultrastructural examination of α-syn, tau 2N4R, and p-tau 1N4R after incubation with compound 10. Proteins (60 μM) were incubated with <0.25% DMSO or compound 10 at 600 μM (molar ratio 1:10) in 10 mM PBS buffer (pH 7.4) for 24 h at 37 °C prior to visualization by transmission electron microscopy. (A) α-Syn after incubation with DMSO. (B) α-Syn after incubation with compound 10. (C) Tau (2N4R) after incubation with DMSO. (D) Tau (2N4R) after incubation with compound 10. (E) p-Tau (1N4R) after incubation with DMSO. (F) p-Tau (1N4R) after incubation with compound 10. Scale bar: 200 nm.
Figure 7
Figure 7
Compound 7 does not reduce inclusion formation using the M17D neuroblastoma cells that express inclusion-prone α-synuclein 3K::YFP. (A) M17D cells that express an αS3K::YFP fusion protein (dox-inducible) were treated with 0.1% DMSO (control) and compound 7 (negative control) at various concentrations at t = 24 h. Cells were induced with dox at t = 48 h. Punctate YFP signals were measured and normalized to 0.1% DMSO at t = 96 h (left panels); the cell confluence percentage was also plotted (middle panels). For each compound, four independent experiments (N = 4; n = 24; except DMSO, n = 12) were performed. Western blot analysis of the cultures (right panels) allowed for the plotting of total αS/GAPDH ratios, normalized to 0.1% DMSO (N = 4; n = 24, except DMSO, n = 4). Data are presented as fold-change relative to 0.1% DMSO. All samples with or without compound treatment contained 0.1% DMSO. Ordinary one-way ANOVA plus Dunnett’s multiple comparison test (*, p < 0.1, **, p < 0.01, ***, p < 0.001, ****, p < 0.0001).
Figure 8
Figure 8
Compound 10 prevents αS inclusion formation in a dose-dependent manner. M17D cells expressing the inclusion-prone αS-3K::YFP fusion protein (dox-inducible) were treated with 0.1% DMSO (vehicle) as well as 1.25, 2.5, 5, and 10 μM compound 10 at t = 24 h after plating. Cells were induced with doxycycline at t = 48 h. A) Incucyte-based analysis of punctate YFP signals relative to 0.1% DMSO was done at t = 96 h (N = 2 independent experiments, n = 6–12 individual wells total (all concentrations n = 12 except 10 μM, n = 6). B) Same as panel A, but confluence as fold change relative to 0.1% DMSO (vehicle) were plotted. C) Representative IncuCyte images of reporter cells treated with vehicle (0.1% DMSO) vs 2.5 and 10 μM of compound 79 (t = 96 h), green channel. Arrows indicate αS-rich YFP-positive inclusions. Scale bar for all images acquired: 50 μm. All data are presented as fold-changes relative to DMSO control + /- standard deviation. All samples with or without compound treatment contained 0.1% DMSO. One-way ANOVA, Dunnett’s posthoc test; *, p < 0.05; **, p < 0.01; ***, p < 0.0 01.
Figure 9
Figure 9
Compound 10 reduces tau seeding activity in vitro. (A) Experimental design to test the effect of compounds on tau seeding activity. htauP301S plasmid was transfected to overexpress in tau HEK 293T cells, and the cells were treated with the compounds 24 h later. Cell viability and tau seeding activity were assessed 48 h after treatment with compounds at concentrations of 2.5, 5, and 20 μM. The control consisted of 0.01% DMSO. All samples with or without compound treatment contained 0.01% DMSO. (B) Viability of cells after treatment with the compounds. (C) Representative images of the FRET signal from biosensor cells after transfection with cell lysates. (D) Seeding activity of cells overexpressing htauP301S and after treatment with the compounds.
Figure 10
Figure 10
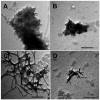
Transmission electron microscopy (TEM) analysis of Aβ-plaques and paired helical filaments after incubation with DMSO (control) or compound 10. Extracted plaques from Alzheimer’s brains were incubated with 1.5% DMSO (control vehicle) or compound 10 (50 μM with 1.5% DMSO) in 10 mM PBS buffer (pH 7.4) for 120 h at 37 °C prior to visualization by transmission electron microscopy. (A) Aβ-plaque in the presence of DMSO. (B) Aβ-plaque in the presence of compound 10. (C) Paired helical filaments in the presence of DMSO. (D) Paired helical filaments in the presence of compound 10. Scale bar: 200 nm.

References

    1. Grundke-Iqbal I.; Iqbal K.; Tung Y. C.; Quinlan M.; Wisniewski H. M.; Binder L. I. Abnormal phosphorylation of the microtubule-associated protein tau (tau) in Alzheimer cytoskeletal pathology. Proc. Natl. Acad. Sci. U. S. A. 1986, 83 (13), 4913–4917. 10.1073/pnas.83.13.4913. - DOI - PMC - PubMed
    1. Spillantini M. G.; Schmidt M. L.; Lee V. M.; Trojanowski J. Q.; Jakes R.; Goedert M. Alpha-synuclein in Lewy bodies. Nature 1997, 388 (6645), 839–840. 10.1038/42166. - DOI - PubMed
    1. Dugger B. N.; Dickson D. W. Pathology of Neurodegenerative Diseases. Cold Spring Harbor Perspect. Biol. 2017, 9 (7), a028035.10.1101/cshperspect.a028035. - DOI - PMC - PubMed
    1. Jucker M.; Walker L. C. Self-propagation of pathogenic protein aggregates in neurodegenerative diseases. Nature 2013, 501 (7465), 45–51. 10.1038/nature12481. - DOI - PMC - PubMed
    1. Brettschneider J.; Del Tredici K.; Lee V. M.; Trojanowski J. Q. Spreading of pathology in neurodegenerative diseases: a focus on human studies. Nat. Rev. Neurosci 2015, 16 (2), 109–120. 10.1038/nrn3887. - DOI - PMC - PubMed

Publication types