. 2023 Nov;71(11):577-599.
doi: 10.1369/00221554231204926. Epub 2023 Oct 11.

Immunohistochemical Study of Airways Fibrous Remodeling in Smoking Mice

Affiliations

Immunohistochemical Study of Airways Fibrous Remodeling in Smoking Mice

Emilia Balzano et al. J Histochem Cytochem. 2023 Nov.

Abstract

The fibrotic remodeling in chronic obstructive pulmonary disease (COPD) is held responsible for narrowing of small airways and thus for disease progression. Oxidant damage and cell senescence factors are recently involved in airways fibrotic remodeling. Unfortunately, we have no indications on their sequential expression at anatomical sites in which fibrotic remodeling develops in smoking subjects. Using immunohistochemical techniques, we investigated in two strains of mice after cigarette smoke (CS) exposure what happens at various times in airway areas where fibrotic remodeling occurs, and if there also exists correspondence among DNA damage induced by oxidants, cellular senescence, the presence of senescence-secreted factors involved in processes that affect transcription, metabolism as well as apoptosis, and the onset of fibrous remodeling that appears at later times in mice exposed to CS. A clear positivity for fibrogenic cytokines TGF-β, PDGF-B, and CTGF, and for proliferation marker PCNA around airways that will be remodeled is observed in both strains. Increased expression of p16ink4A senescence marker and MyoD is also seen in the same areas. p16ink4A and MyoD can promote cell cycle arrest, terminal differentiation of myofibroblasts, and can oppose their dedifferentiation. Of interest, an early progressive attenuation of SIRT-1 is observed after CS exposure. This intracellular regulatory protein can reduce premature cell senescence. These findings suggest that novel agents, which promote myofibroblast dedifferentiation and/or the apoptosis of senescent cells, may dampen progression of airway changes in smoking COPD subjects.

Keywords: airways changes; animal model; cell senescence; cigarette smoke; histone deacetylase SIRT-1; oxidative DNA damage; proliferation markers.


Conflict of interest statement

Competing InterestsThe author(s) declared no potential conflicts of interest with respect to the research, authorship, and/or publication of this article.

Figures
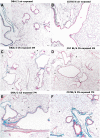
Figure 1.
Figure 1.
Representative histologic sections from lung parenchyma at different times from the start of the study. (A) Lung from an air-exposed DBA/2 mouse showing a normal architecture. (B) Lung from an air-exposed C57BL/6 mouse showing a normal architecture. (C) Lung from a DBA/2 mouse after 4 months of cigarette smoke exposure. Areas of fibrotic remodeling are seen around bronchioles (arrowhead). Emphysematous changes (*). (D) Lung from a C57BL/6 mouse after 4 months of CS exposure. Some emphysematous changes are present (*) but no areas of airway fibrotic remodeling are seen. (E) Lung from a DBA/2 mouse after 7 months of smoke exposure. Airway fibrotic remodeling changes (arrowhead) are more severe (sea green areas) around bronchioles. (F) Lung from a C57BL/6 mouse after 7 months of smoke exposure showing patchy areas of lung emphysema (*) and areas of fibrotic remodeling around bronchioles (arrowhead). (A–F) Masson’s trichrome stain. Scale bars = 100 µm. Abbreviation: CS, cigarette smoke.
Figure 2.
Figure 2.
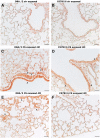
Representative immunohistochemical reaction for alpha-SMA and p16ink4A in mouse lungs from the different experimental groups. (A and B) Lung slices from a control DBA/2 mouse after immunostaining for alpha-smooth muscle cells (alpha-SMA) (A) and p16ink4A (B) showing a very faint reaction on pulmonary airways. (C and D) Lung slices from a control C57BL/6 mouse after immunostaining for alpha-smooth muscle cells (C) and p16ink4A (D) showing a very faint or null reaction on pulmonary airways. (E–H) Lung slices from DBA/2 (E, F) and C57BL/6 (G, H) mice at 7 months of exposure to CS after immunostaining for alpha-SMA. An intense staining is present around the airways of both strains. In the inserts, higher magnification of the micrographs (F) and (H) is reported. (I and J) Lung slices from DBA/2 (I) and C57BL/6 (J) mice at 7 months of exposure to CS after immunostaining for alpha-SMA. An intense staining is present beneath the epithelial layer of the airways of both strains. (K–N) Alpha-smooth muscle cells (green) and p16ink4A (red) colocalization on airway structures of DBA/2 (L) and C57BL/6 (N) mice on lung slices taken at 7 months of CS exposure. No signals for p16ink4A are present on lung slides of air control DBA/2 (K) and C57BL/6 (M) mice. (A–J) Scale bars = 50 µm. Abbreviations: alpha-SMA, α-smooth muscle actin; p16ink4A, tumor suppressor protein p16ink4A; CS, cigarette smoke.
Figure 3.
Figure 3.
Representative immunohistochemical reaction for the transcription factor MyoD in mouse lungs from the different experimental groups. (A and B) Immunohistochemical staining for MyoD in lungs of DBA/2 (A) and C57BL/6 (B) control mice. No reaction is observed in tissue slices. (C and D) At 4 months of CS exposure a marked expression of this transcription factor can be seen on the airway structures and subpleural areas of DBA/2 mice (C). No reaction is observed in the pulmonary structures of C57BL/6 mice (D). (E and F) An intense staining for MyoD is seen on epithelial cells and in cells beneath the basal membrane of airways at 7 months after cigarette smoke exposure in both strains of mice. Airways of DBA/2 (E) and C57BL/6 (F) are shown. (A–F) Scale bars = 50 µm. Abbreviation: CS: cigarette smoke.
Figure 4.
Figure 4.
Representative sections from lung parenchyma after immunolocalization of 8-oxo-7,8-dihydro-2′-deoxyguanosine (8-OHdG). (A) Immunohistochemical staining for 8-OHdG in lung from an air-exposed DBA/2 mouse at 4 months from the start of the study showing no positivity. (B) Immunohistochemical staining for 8-OHdG in lung from an air-exposed C57BL/6 mouse at 4 months from the start of the study showing no positivity. (C and D) Positive staining for 8-OHdG is seen on the nuclei of parenchyma and bronchiolar cells (>) in lung for DBA/2 (C) and C57BL/6 (D) mice at 4 months of CS exposure. (E) An intense staining for 8-OHdG is present in subpleural areas of DBA/2 mice (>) at 4 months of CS exposure. (F) A very faint or practically null reaction is seen in subpleural areas of C57BL/6 mice at the same time from the start of the treatments. (A–F) Scale bars = 50 µm. Abbreviation: CS: cigarette smoke.
Figure 5.
Figure 5.
Representative sections from the lung parenchyma of DBA/2 mice after immunolocalization of TGF-β, PDGF-B, and CTGF. Real-time PCR analysis of mRNAs for TGF-β, PDGF-B, and CTGF. (A–C) Immunohistochemical staining for TGF-β in lung slices from air control (A) and CS-exposed DBA/2 mice at 4 (B) and 7 (C) months from the start of the study. Intense positivity (>) on bronchi, bronchioles, and on cells of the central part of the parenchyma is evident at 4 and 7 months. Air control mice have no cells that stained positive for TGF-β. (D–F) Immunohistochemical staining for PDGF-B in lung from CS-exposed DBA/2 mice at 4 (E) and 7 (F) months from the start of the study showing positivity around peripheral airways (>). A very faint or null immunoreaction is present in lung slices of air control mice (D). (G–I) The immunohistochemical stain for CTGF in the lung slices from DBA/2 mice at 4 (H) and 7 (I) months of CS exposure. CTGF shows a similar distribution to that observed for TGF-β and PDGF-B in DBA/2 mice. In the insert of Fig. (I), higher magnification of the CTGF reaction can be appreciated. No reaction is observed in lung slices of air control mice (G). (J) Real-time PCR analysis of mRNA for TGF-β, PDGF-B and CTGF carried out in lungs from six DBA/2 mice at 4 and 7 months after CS exposure reveals a marked and significant increase of these cytokines. Values of transcripts for TGF-β, PDGF-B and CTGF are corrected for 18S rRNA and normalized to a median control value of 1.0. Error bars indicate mean ± SD. *p<0.05 versus controls. (A–I) Scale bars = 100 µm. Abbreviations: TGF-β, transforming growth factor-β; PDGF-B, platelet-derived growth factor B; CTGF, connective tissue growth factor; PCR, Polymerase Chain Reaction; mRNA, messenger RNA.
Figure 6.
Figure 6.
Representative sections from the lung parenchyma of C57BL/6 mice after immunolocalization of TGF-β, PDGF-B, and CTGF. Real-time PCR analysis of mRNAs for TGF-β, PDGF-B, and CTGF. (A–C) Immunohistochemical staining for TGF-β in lung slices from air control (A) and CS-exposed C57BL/6 mice at 4 (B) and 7 (C) months from the start of the study. Intense positivity on bronchi, bronchioles, and the central part of the parenchyma is evident at 4 and 7 months. In insert of Fig. 6(C) higher magnification of the TGF-β reaction can be appreciated. Air control mice have no cells that stained positive for TGF-β (A). (D–F) Immunohistochemical staining for PDGF-B in lung from cigarette smoke exposed C57BL/6 mice at 4 (E) and 7 (F) months from the start of the study showing positivity around peripheral airways (>). No immunoreaction for PDGF-B is observed in lung slices of air control mice (D). (G–I) The immunohistochemical stain for CTGF in the lung slices from C57BL/6 mice at 4 (H) and 7 (I) months of CS exposure. CTGF shows a similar distribution to that observed for TGF-β and PDGF-B in the same strain. No reaction is observed in lung slices of air control mice (G). (J) Real-time PCR analysis of mRNA for TGF-β, PDGF-B and CTGF carried out in lungs from six C57BL/6 mice at 4 and 7 months after cigarette smoke exposure reveals a significant increase of these cytokines. Values of transcripts for TGF-β, PDGF-B and CTGF are corrected for 18S rRNA and normalized to a median control value of 1.0. Error bars indicate mean ± SD. (A–I) Scale bars = 100 µm. Abbreviations: TGF-β, transforming growth factor-β; PDGF-B, platelet-derived growth factor B; CTGF, connective tissue growth factor; mRNA, messenger RNA; rRNA, ribosomal ribonucleic acid. *p<0.05 versus controls.
Figure 7.
Figure 7.
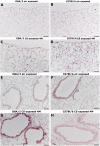
Representative histologic section after immunostaining for proliferating cell nuclear antigen (PCNA). (A and B) Lung slices from DBA/2 (A) and C57BL/6 (B) control mice showing no reaction for proliferating cell nuclear antigen (PCNA) on lung and airway structures. (C and D) Airway structures from DBA/2 (C) and C57BL/6 (D) CS-exposed mice at 4 months showing a clear positivity of proliferating cell nuclear antigen staining on airway cells (>). (E and F) Lung parenchyma cells from DBA/2 (E) and C57BL/6 (F) CS-exposed mice at 4 months showing a positive reaction for proliferating cell nuclear antigen (>) in peripheral and subpleural areas. (A–F) Scale bars = 100 µm. Abbreviation: CS, cigarette smoke.
Figure 8.
Figure 8.
Immunohistochemical reaction for NAD-dependent deacetylase SIRT-1. (A and B) Positive staining for SIRT-1 in the lungs of air-exposed animals from DBA/2 (A) and C57BL/6 (B) mice is seen in alveolar and airway epithelial cells (>). (C and D) At 1 month of CS exposure, decreased expression of SIRT-1 is observed in DBA/2 mice (C), when a faint positivity is still maintained in C57BL/6 mice (D). (E and F) At 4 months of CS exposure, very little or no reaction is observed in C57BL/6J (E) and DBA/2 (F) mice. (A–F) Scale bars = 100 µm. Abbreviations: NAD, nicotinamide adenine dinucleotide; SIRT-1, sirtuin-1; CS: cigarette smoke.
Figure 9.
Figure 9.
SIRT-1 positive cells in small airways at the various times from the start of the experiments. The number of individual cells staining positive for SIRT-1 in small airways structures was counted using a light microscopy and expressed as the number of cells per bronchiole with 150–200 µm internal diameter. A minimum of ten bronchioles was counted per each animal. Error bars indicate mean ± SD. Abbreviations: SIRT-1, sirtuin-1; SD, standard deviation.*p<0.05 versus air controls: **p<0.05 versus smoking mice at 1 month of exposure.
Figure 10.
Figure 10.
Representative immunohistochemical reaction for cleaved Caspase-3 in mouse lungs from the different experimental groups. (A and B) Immunohistochemical analysis reveals no evident reaction of cleaved caspase-3 in bronchial epithelial cells and in lung parenchyma from DBA/2 (A) and C57BL/6 (B) mice exposed to room air. (C and D) After 4 months of CS exposure, a widespread reaction for cleaved caspase-3 is observed in the lung parenchyma from DBA/2 (C) and C57BL/6 (D) mice. This reaction is evident at the time when the development of emphysema is not fully complete. (E and F) A faint reaction of cleaved caspase-3 is seen in cells of the airways structures and in lung parenchyma from DBA/2 (E) and C57BL/6 (F) mice exposed to room air. (G and H) After 4 months of CS exposure an almost absence of positivity is seen in the sub-bronchiolar fibromuscular layer of DBA/2 (G) and C57BL/6 (H) mice. A positivity for cleaved caspase-3 is seen in several epithelial cells lining airways of DBA/2 mice. (A–H) Scale bars = 50 µm. Abbreviation: CS: cigarette smoke.
Figure A1.
Figure A1.
Western blotting analysis for SIRT-1 carried out on lung homogenate from a male C57Bl/6 mouse after SDS-PAGE.

References

    1. Mannino DM, Watt G, Hole D, Gillis C, Hart C, McConnachie A, Davey Smith G, Upton M, Hawthorne V, Sin DD, Man SF, Van Eeden S, Mapel DW, Vestbo J. The natural history of chronic obstructive pulmonary disease. Eur Respir J. 2006;27:627–43. - PubMed
    1. Cigarette smoking and health. American Thoracic Society. Am J Respir Crit Care Med. 1996;153:861–5. - PubMed
    1. Fletcher C, Peto R. The natural history of chronic airflow obstruction. Br Med J. 1977;1:1645–8. - PMC - PubMed
    1. Tuder RM, Petrache I. Pathogenesis of chronic obstructive pulmonary disease. J Clin Invest. 2012;122:2749–55. - PMC - PubMed
    1. Rennard SI, Locantore N, Delafont B, Tal-Singer R, Silverman EK, Vestbo J, Miller BE, Bakke P, Celli B, Calverley PM, Coxson H, Crim C, Edwards LD, Lomas DA, MacNee W, Wouters EF, Yates JC, Coca I, Agustí A, Evaluation of COPD Longitudinally to Identify Predictive Surrogate Endpoints. Identification of five chronic obstructive pulmonary disease subgroups with different prognoses in the ECLIPSE cohort using cluster analysis. Ann Am Thorac Soc. 2015;12(3):303–12. - PubMed

Publication types

Substances

LinkOut - more resources