. 2023 Nov 10;51(20):10884-10908.
doi: 10.1093/nar/gkad797.

Where the minor things are: a pan-eukaryotic survey suggests neutral processes may explain much of minor intron evolution

Affiliations

Where the minor things are: a pan-eukaryotic survey suggests neutral processes may explain much of minor intron evolution

Graham E Larue et al. Nucleic Acids Res. .

Abstract

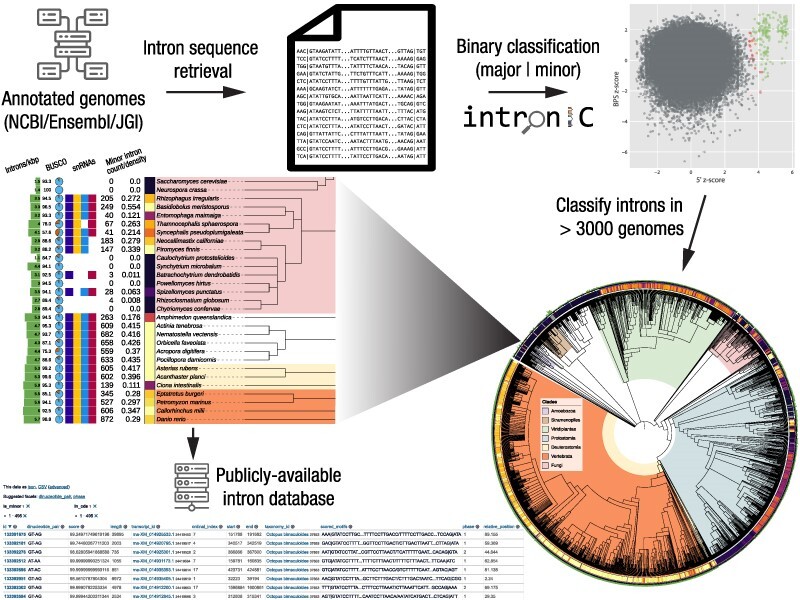
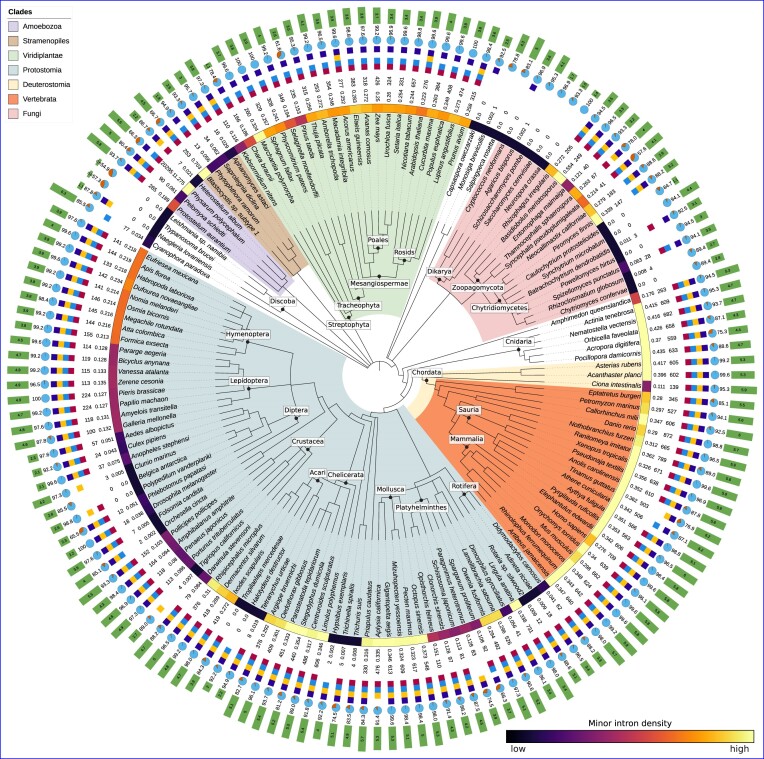
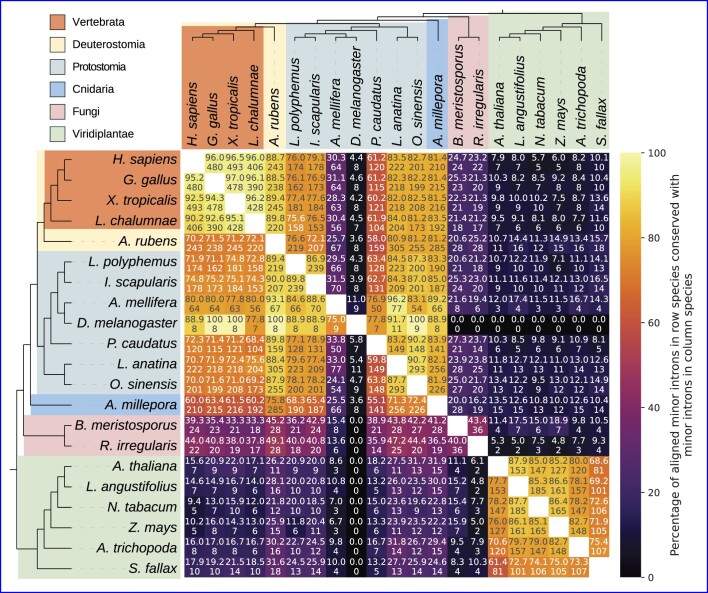
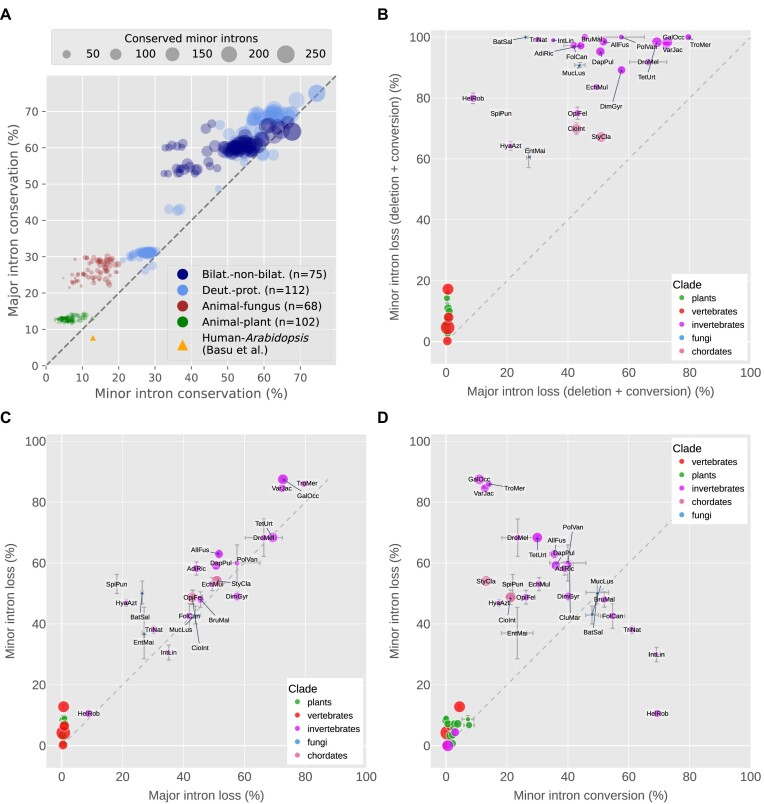
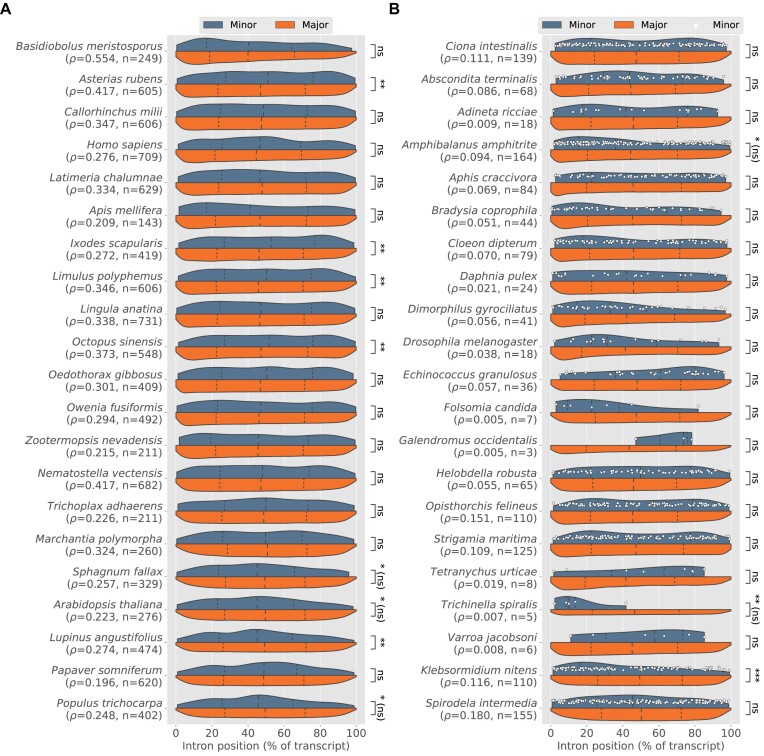
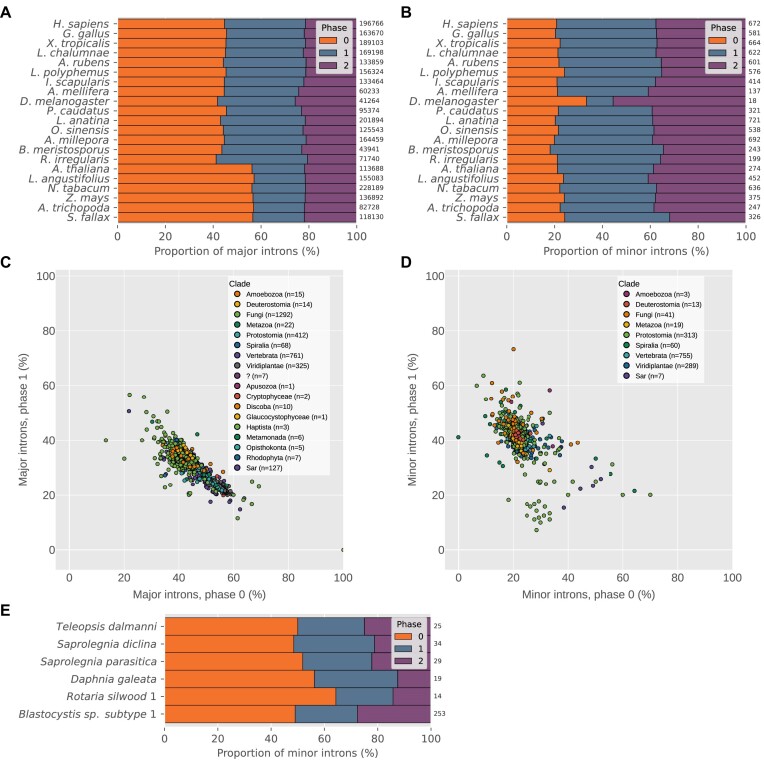
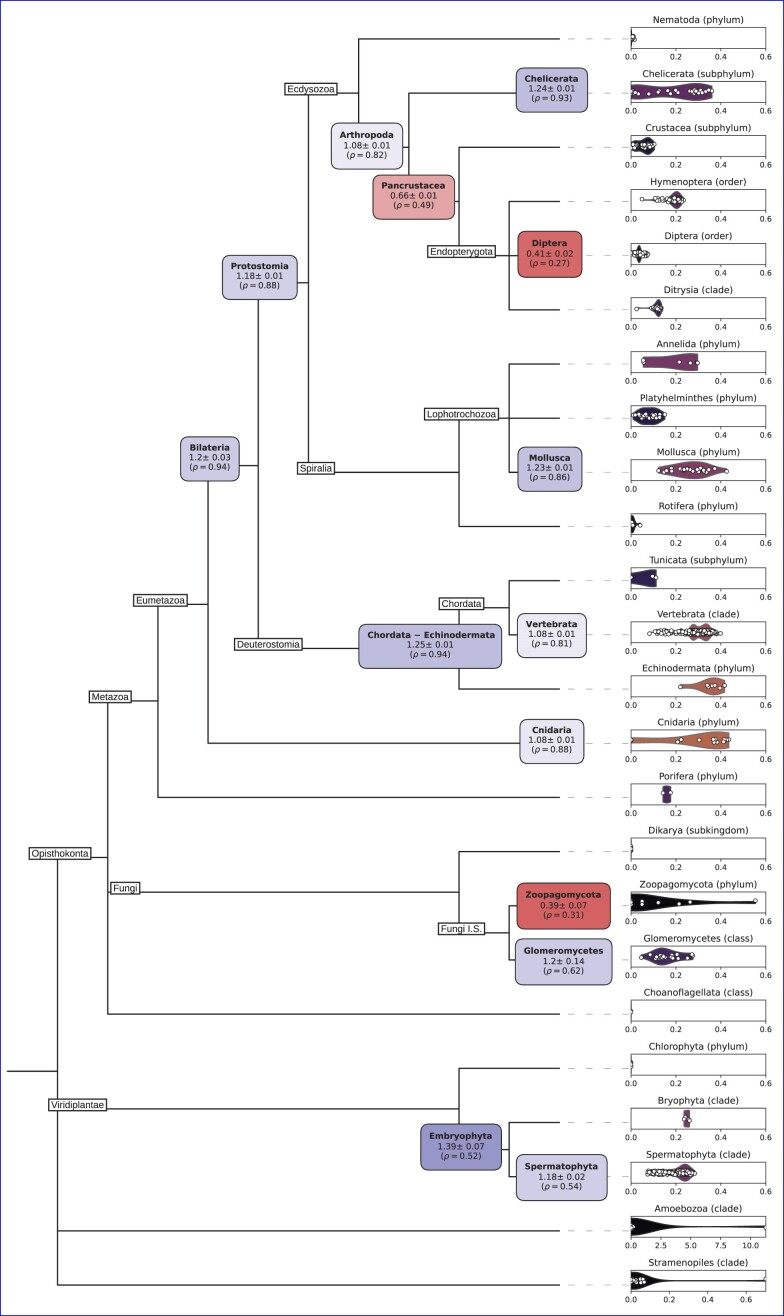
Spliceosomal introns are gene segments removed from RNA transcripts by ribonucleoprotein machineries called spliceosomes. In some eukaryotes a second 'minor' spliceosome is responsible for processing a tiny minority of introns. Despite its seemingly modest role, minor splicing has persisted for roughly 1.5 billion years of eukaryotic evolution. Identifying minor introns in over 3000 eukaryotic genomes, we report diverse evolutionary histories including surprisingly high numbers in some fungi and green algae, repeated loss, as well as general biases in their positional and genic distributions. We estimate that ancestral minor intron densities were comparable to those of vertebrates, suggesting a trend of long-term stasis. Finally, three findings suggest a major role for neutral processes in minor intron evolution. First, highly similar patterns of minor and major intron evolution contrast with both functionalist and deleterious model predictions. Second, observed functional biases among minor intron-containing genes are largely explained by these genes' greater ages. Third, no association of intron splicing with cell proliferation in a minor intron-rich fungus suggests that regulatory roles are lineage-specific and thus cannot offer a general explanation for minor splicing's persistence. These data constitute the most comprehensive view of minor introns and their evolutionary history to date, and provide a foundation for future studies of these remarkable genetic elements.


Figures

Graphical Abstract
Graphical Abstract
Figure 1.
Figure 1.
Minor intron densities and other metadata for selected species of interest. The colored strip following the species name represents the relative minor intron density (darker = lower, lighter = higher). Additional data from inside to outside are as follows: minor intron density (%), number of putative minor introns (including introns in non-coding regions of genes), minor snRNAs present in the annotated transcriptome (red: U11, light blue: U12, yellow: U4atac, purple: U6atac), BUSCO score versus the eukaryotic BUSCO gene set, median total (minor and major) intron density in introns/kbp coding sequence. Taxonomic relationships based upon data from the NCBI Taxonomy Database (37); figure generated using iTOL (68). A similar visualization for all species in our dataset can be found in Supplementary Figure S1.
Figure 2.
Figure 2.
Pairwise minor intron conservation between various species. Bottom number is the number of minor introns conserved between the pair; top number is the number of conserved minor introns as a percentage of the minor introns present in the alignments for the associated species (the row species). For example, there are eight minor introns conserved between D. melanogaster and L. polyphemus, which is 88.9% of the Drosophila minor introns present in the alignment, but only 4.3% of the corresponding minor introns in Limulus. Full names of species are as follows: Homo sapiens, Gallus gallus, Xenopus tropicalis, Latimeria chalumnae, Asterias rubens, Limulus polyphemus, Ixodes scapularis, Apis mellifera, Drosophila melanogaster, Priapulus caudatus, Lingula anatina, Octopus sinensis, Acropora millepora, Basidiobolus meristosporus, Rhizophagus irregularis, Arabidopsis thaliana, Lupinus angustifolius, Nicotiana tabacum, Zea mays, Amborella trichopoda, Sphagnum fallax.
Figure 3.
Figure 3.
Conservation and loss of minor and major introns. (A) Comparison of major (y-axis) versus minor (x-axis) intron conservation across hundreds of pairs of species. Bilat.-non-bilat.: bilaterian versus non-bilaterian (animal); Deut.-prot.: deuterostome versus protostome. The yellow triangle indicates levels of conservation of major and minor introns between Homo sapiens and Arabidopsis thaliana as reported by Basu et al. (74). Size of markers indicates number of minor introns conserved between each pair. (B) Minor versus major intron loss, where ‘loss’ includes both sequence deletion and conversion to an intron of the other type. Bars indicate standard error of the mean for averaged values. Marker size represents relative minor intron density. (C) Minor versus major intron loss, where ‘loss’ represents actual deletion of the intron sequence. (D) Minor intron loss versus conversion, where ‘loss’ represents actual deletion of the intron sequence. Species abbreviations for are as follow: AdiRic: Adineta ricciae, AllFus: Allacma fusca, BatSal: Batrachochytrium salamandrivorans, BruMal: Brugia malayi, CioInt: Ciona intestinalis, CluMar: Clunio marinus, DapPul: Daphnia pulicaria, DimGyr: Dimorphilus gyrociliatus, DroMel: Drosophila melanogaster, EchMul: Echinococcus multilocularis, EntMai: Entomophaga maimaiga, FolCan: Folsomia candida, GalOcc: Galendromus occidentalis, HelRob: Helobdella robusta, HyaAzt: Hyalella azteca, IntLin: Intoshia linei, MucLus: Mucor lusitanicus, OpiFel: Opisthorchis felineus, PolVan: Polypedilum vanderplanki, SpiPun: Spizellomyces punctatus, StyCla: Styela clava, TetUrt: Tetranychus urticae, TriNat: Trichinella nativa, TroMer: Tropilaelaps mercedesae, VarJac: Varroa jacobsoni.
Figure 4.
Figure 4.
Intron position distributions for major (red) and minor (yellow) introns in selected species. (A) Species enriched in minor introns. (B) Species with significant inferred minor intron loss; white dots represent individual minor introns. For both plots: Dashed lines represent the first, second and third quartiles of each distribution; ρ indicates minor intron density; n is number of minor introns; statistically significant differences between minor and major introns are indicated with asterisks (two-tailed Mann–Whitney U test; *P ≤ 0.05; **P ≤ 0.001; ***P ≤ 0.0001; "ns" not significant; asterisks followed by "(ns)" indicate statistical significance assignments that did not survive correction for multiple testing under Benjamini–Hochberg). Note that in some cases of significant difference between the two intron types, e.g. within animals, it is the major introns with greater 5′ bias.
Figure 5.
Figure 5.
Minor and major intron phase biases. (A,B) Phase distributions of major and minor introns, respectively, in various species. Numbers at the ends of bars represent the total number of constituent introns. (C) Proportions of phase 1 (y-axis) versus phase 0 (x-axis) major introns. Correlation of phase 0 to phase 1 ρs = −0.81, p ≪ 0.0001. (D) Proportions of phase 1 (y-axis) versus phase 0 (x-axis) minor introns in species with at least 10 high-confidence minor introns. Correlation of phase 0 to phase 1 ρs = −0.48, p ≪ 0.0001. (E) Unusually high proportions of phase 0 minor introns in certain species (graphical elements as in (A) and (B)). Proportions of phase 0 minor introns for all species are significantly different from expected values derived from the proportion of phase 0 minor introns in human (phase 0 versus sum of other phases, Boschloo’s exact test P < 0.05). Species in (C) and (D) with fewer than 10 identified introns of the corresponding type were excluded, as were species in (D) with uncertain/borderline minor intron presence (see Curation of minor intron data/edge cases).
Figure 6.
Figure 6.
Non-canonical minor intron motifs in animals and plants. (AB) Non-canonical intron termini found in conserved minor introns in animals and plants, respectively. Introns with non-canonical termini comprise formula image of the total set of orthologous minor introns in animals and formula image in plants (see Supplementary Table S1 for complete data including canonical minor introns). (C) Sequence logos of the 5′SS, BPS and 3′SS regions of selected non-canonical minor introns in animals and plants. The terminal dinucleotide pairs for each intron subtype are highlighted in gray.
Figure 7.
Figure 7.
Features of MIGs and minor introns. (A and B) Median genic intron density (introns/kbp coding sequence) and gene length (sum of coding sequence), respectively, for major-intron-only genes (y-axis) versus minor intron-containing genes (x-axis). (C) Median major intron length (y-axis) versus median minor intron length (x-axis) for all species with high-confidence minor introns. Size of markers indicates number of minor introns in the genome. Inset: subset of the data with length ≤ 1000 bp. In all plots, species not confidently identified as containing at least ten minor introns were excluded. All three plots share the legend from (A).
Figure 8.
Figure 8.
Minor intron density distributions in selected clades, and ancestral reconstructions of minor intron densities at selected nodes. Ancestral density node label color indicates enrichment (blue) or reduction (red) relative to the reference species in the alignments; the first number underneath each node label is the average estimated minor intron density at that node as a fraction of the reference species’ minor intron density; ρ indicates the node’s average estimated ancestral minor intron density. For animals, the reference species is Homo sapiens; for plants, Lupinus angustifolius; for fungi, Rhizophagus irregularis. Terminal violin plots show the distribution of minor intron densities (percent of all introns classified as minor) in extant lineages of the labeled taxonomic group.
Figure 9.
Figure 9.
Evidence of minor introns and splicing machinery in Rhizophagus irregularis. (A) BPS versus 5′SS scores for annotated introns in Rhizophagus, showing the expected cloud of introns with minor-intron-like 5′SS and BPS scores in the first quadrant. (B) Comparison of minor intron sequence motifs in Rhizophagus, human and Arabidopsis. (C) Conservation states of Rhizophagus minor and major introns in different species. NI = ‘No Intron’. (D) Examples of Rhizophagus minor introns in conserved alignments with minor introns in other species. (E) The four minor snRNAs U11, U12, U4atac and U6atac found in Rhizophagus. SM binding sites are in green; sequences predicted to basepair with intronic motifs are in cyan. (F) Comparison of minor intron phase distributions in different species including Rhizophagus, showing the expected bias away from phase 0 in all species. Species abbreviations are as follow: HomSap: Homo sapiens, NemVec: Nematostella vectensis, AraTha: Arabidopsis thaliana, PhyPat: Physcomitrium patens, RhiMic: Rhizopus microsporus, ZeaMay: Zea mays, GalGal: Gallus gallus.
Figure 10.
Figure 10.
Gene expression and intron retention comparisons across cell types in Rhizophagus irregularis. (A) Comparison of expression of proliferation-index genes (PI, light purple) and all other genes (non-PI, dark purple) across cell types, n = 70 PI and n = 9276 non-PI in each cell type. (B) As in (A), but for minor intron-containing genes (MIGs) compared to non-MIGs; n = 96 MIG and n = 9249 non-MIG for each cell type. (C) Intron retention values across cell types for minor (blue, left) and major (orange, right) introns. Cell types are labeled as described in the text.

Similar articles

Cited by

References

    1. Will C.L., Lührmann R.. Spliceosome structure and function. Cold Spring Harb. Perspect. Biol. 2011; 3:a003707. - PMC - PubMed
    1. Matera A.G., Wang Z.. A day in the life of the spliceosome. Nat. Rev. Mol. Cell Biol. 2014; 15:108–121. - PMC - PubMed
    1. Jurica M.S. Detailed close-ups and the big picture of spliceosomes. Curr. Opin. Struct. Biol. 2008; 18:315–320. - PMC - PubMed
    1. Jeffreys A.J., Flavell R.A.. The rabbit beta-globin gene contains a large large insert in the coding sequence. Cell. 1977; 12:1097–1108. - PubMed
    1. Gilbert W. Why genes in pieces?. Nature. 1978; 271:501. - PubMed

Publication types