. 2023 Oct 11:12:RP89083.
doi: 10.7554/eLife.89083.

Multimodal analysis of methylomics and fragmentomics in plasma cell-free DNA for multi-cancer early detection and localization

Van Thien Chi Nguyen #  1   2 Trong Hieu Nguyen #  1   2 Nhu Nhat Tan Doan  1   2 Thi Mong Quynh Pham  1   2 Giang Thi Huong Nguyen  1   2 Thanh Dat Nguyen  1   2 Thuy Thi Thu Tran  1   2 Duy Long Vo  3 Thanh Hai Phan  4 Thanh Xuan Jasmine  4 Van Chu Nguyen  5   6 Huu Thinh Nguyen  3 Trieu Vu Nguyen  7 Thi Hue Hanh Nguyen  1   2 Le Anh Khoa Huynh  1   8 Trung Hieu Tran  1   2 Quang Thong Dang  3 Thuy Nguyen Doan  3 Anh Minh Tran  3 Viet Hai Nguyen  3 Vu Tuan Anh Nguyen  3 Le Minh Quoc Ho  3 Quang Dat Tran  3 Thi Thu Thuy Pham  4 Tan Dat Ho  4 Bao Toan Nguyen  4 Thanh Nhan Vo Nguyen  4 Thanh Dang Nguyen  4 Dung Thai Bieu Phu  4 Boi Hoan Huu Phan  4 Thi Loan Vo  4 Thi Huong Thoang Nai  4 Thuy Trang Tran  4 My Hoang Truong  4 Ngan Chau Tran  4 Trung Kien Le  3 Thanh Huong Thi Tran  5   6 Minh Long Duong  5   6 Hoai Phuong Thi Bach  5   6 Van Vu Kim  5   6 The Anh Pham  5   6 Duc Huy Tran  3 Trinh Ngoc An Le  3 Truong Vinh Ngoc Pham  3 Minh Triet Le  3 Dac Ho Vo  1   2 Thi Minh Thu Tran  1   2 Minh Nguyen Nguyen  1   2 Thi Tuong Vi Van  1   2 Anh Nhu Nguyen  1   2 Thi Trang Tran  1   2 Vu Uyen Tran  1   2 Minh Phong Le  1   2 Thi Thanh Do  1   2 Thi Van Phan  1   2 Hong-Dang Luu Nguyen  1   2 Duy Sinh Nguyen  1   2 Van Thinh Cao  9 Thanh-Thuy Thi Do  2 Dinh Kiet Truong  2 Hung Sang Tang  1   2 Hoa Giang  1   2 Hoai-Nghia Nguyen  1   2 Minh-Duy Phan  1   2 Le Son Tran  1   2
Affiliations

Multimodal analysis of methylomics and fragmentomics in plasma cell-free DNA for multi-cancer early detection and localization

Van Thien Chi Nguyen et al. Elife. .

Abstract

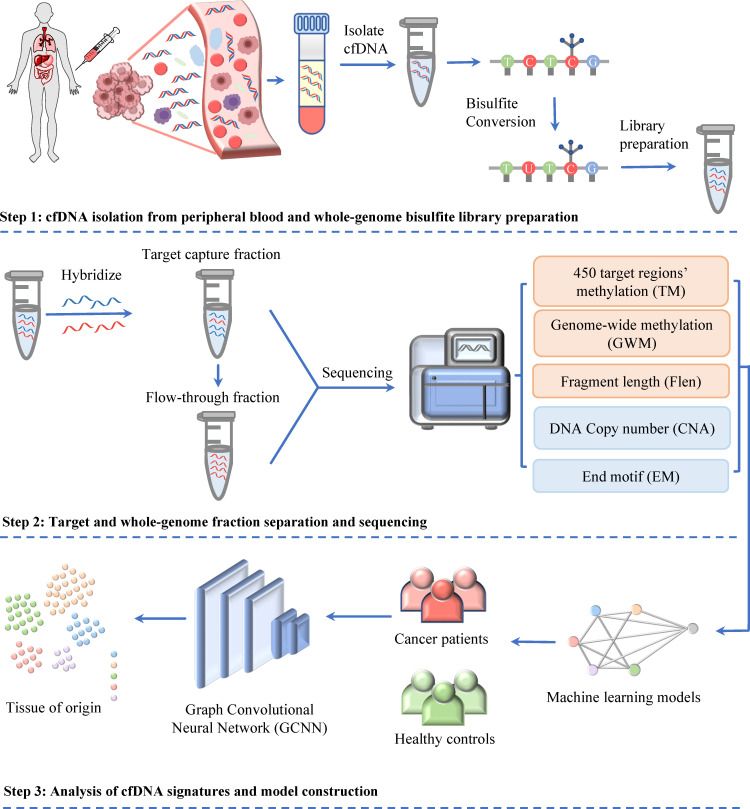
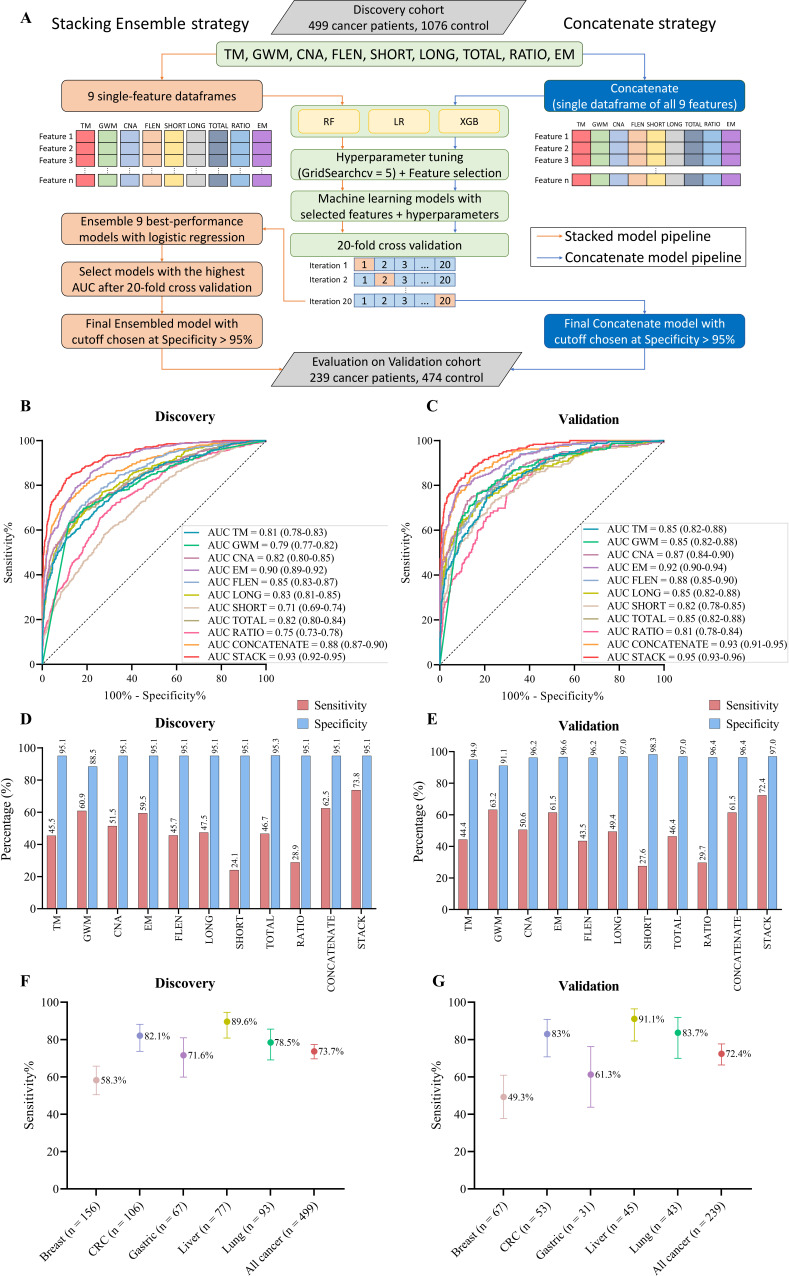
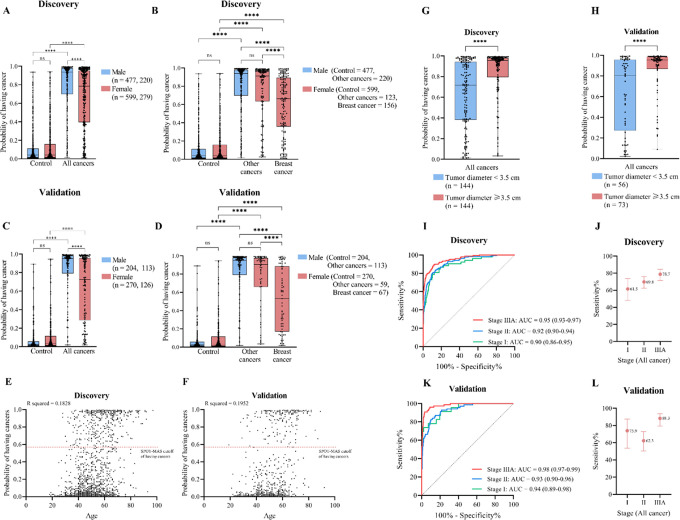
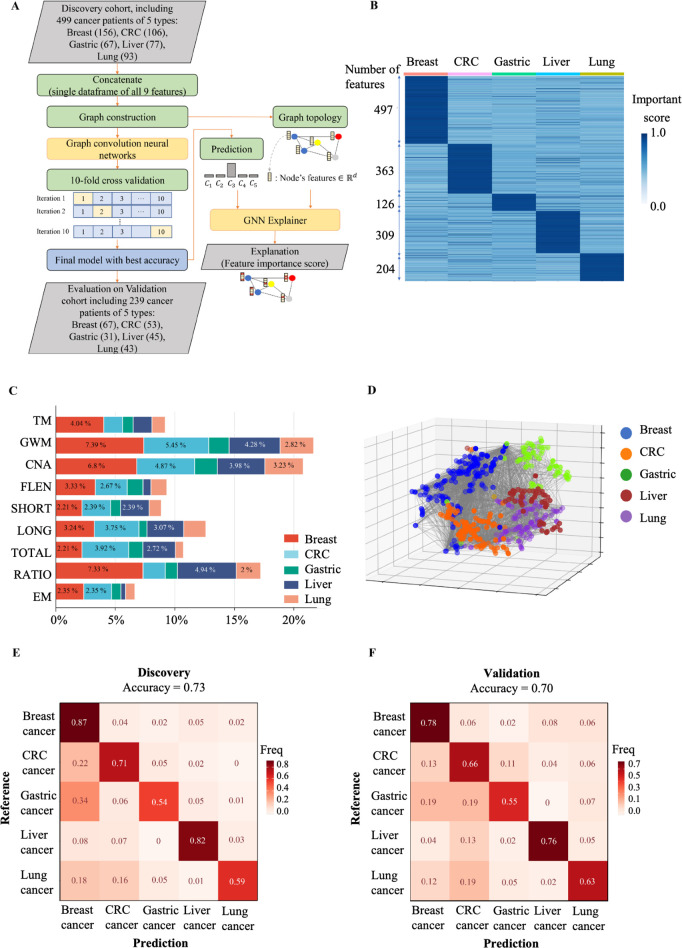
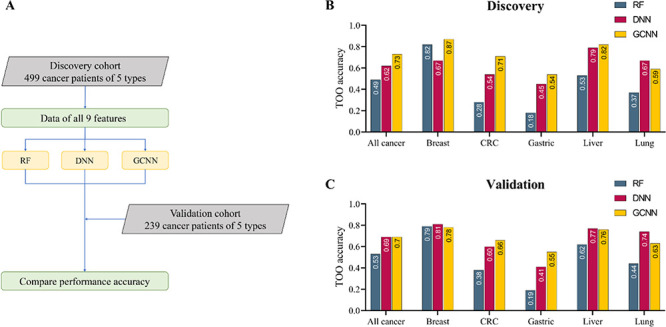
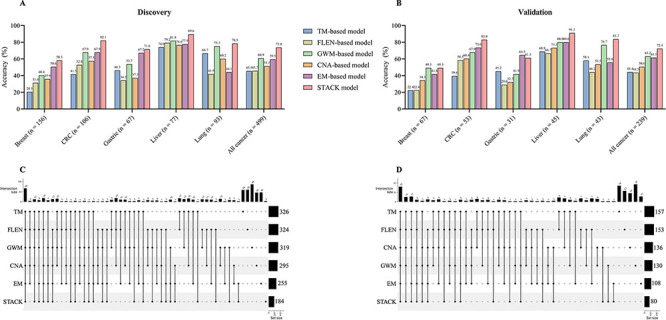
Despite their promise, circulating tumor DNA (ctDNA)-based assays for multi-cancer early detection face challenges in test performance, due mostly to the limited abundance of ctDNA and its inherent variability. To address these challenges, published assays to date demanded a very high-depth sequencing, resulting in an elevated price of test. Herein, we developed a multimodal assay called SPOT-MAS (screening for the presence of tumor by methylation and size) to simultaneously profile methylomics, fragmentomics, copy number, and end motifs in a single workflow using targeted and shallow genome-wide sequencing (~0.55×) of cell-free DNA. We applied SPOT-MAS to 738 non-metastatic patients with breast, colorectal, gastric, lung, and liver cancer, and 1550 healthy controls. We then employed machine learning to extract multiple cancer and tissue-specific signatures for detecting and locating cancer. SPOT-MAS successfully detected the five cancer types with a sensitivity of 72.4% at 97.0% specificity. The sensitivities for detecting early-stage cancers were 73.9% and 62.3% for stages I and II, respectively, increasing to 88.3% for non-metastatic stage IIIA. For tumor-of-origin, our assay achieved an accuracy of 0.7. Our study demonstrates comparable performance to other ctDNA-based assays while requiring significantly lower sequencing depth, making it economically feasible for population-wide screening.

Keywords: cancer biology; circulating tumor DNA; genetics; genomics; human; liquid biopsy; multimodal analysis.


Conflict of interest statement

VN VTCN is affiliated with Gene Solutions. The author has no other competing interests to declare, TN HTN is affiliated with Gene Solutions. The author has no other competing interests to declare, ND NNTD is affiliated with Gene Solutions. The author has no other competing interests to declare, TP TMQP is affiliated with Gene Solutions. The author has no other competing interests to declare, GN GTHN is affiliated with Gene Solutions. The author has no other competing interests to declare, TN TDN is affiliated with Gene Solutions. The author has no other competing interests to declare, TT TTTT is affiliated with Gene Solutions. The author has no other competing interests to declare, DV, TP, TJ, VN, HN, TN, QD, TD, AT, VN, VN, LH, QT, TP, TH, BN, TN, TN, DP, BP, TV, TN, TT, MT, NT, TL, TT, MD, HB, VK, TP, DT, TL, TP, ML, VC, TD No competing interests declared, TN THHN is affiliated with Gene Solutions. The author has no other competing interests to declare, LH LAKH is affiliated with Gene Solutions. The author has no other competing interests to declare, TT THT is affiliated with Gene Solutions. The author has no other competing interests to declare, DV DHV is affiliated with Gene Solutions. The author has no other competing interests to declare, TT TMTT is affiliated with Gene Solutions. The author has no other competing interests to declare, MN MNN is affiliated with Gene Solutions. The author has no other competing interests to declare, TV TTVV is affiliated with Gene Solutions. The author has no other competing interests to declare, AN ANN is affiliated with Gene Solutions. The author has no other competing interests to declare, TT TTT is affiliated with Gene Solutions. The author has no other competing interests to declare, VT VUT is affiliated with Gene Solutions. The author has no other competing interests to declare, ML MPL is affiliated with Gene Solutions. The author has no other competing interests to declare, TD TTD is affiliated with Gene Solutions. The author has no other competing interests to declare, TP TVP is affiliated with Gene Solutions. The author has no other competing interests to declare, HN HDN is affiliated with Gene Solutions. The author has no other competing interests to declare, DN DSN holds equity in Gene Solutions.DSN is affiliated with Gene Solutions. The author has no other competing interests to declare, DT DKT is affiliated with Gene Solutions. The author has no other competing interests to declare, HT HST is affiliated with Gene Solutions. The author has no other competing interests to declare, HG HG holds equity in Gene Solutions. The funder Gene Solutions provided support in the form of salaries for HG who is inventor on the patent application (USPTO 17930705).HG is affiliated with Gene Solutions. The author has no other competing interests to declare, HN HNN holds equity in Gene Solutions. The funder Gene Solutions provided support in the form of salaries for HNN who is inventor on the patent application (USPTO 17930705).HNN is affiliated with Gene Solutions. The author has no other competing interests to declare, MP MDP holds equity in Gene Solutions. The funder Gene Solutions provided support in the form of salaries for MDP who is inventor on the patent application (USPTO 17930705).MDP is affiliated with Gene Solutions. The author has no other competing interests to declare, LT LST holds equity in Gene Solutions. The funder Gene Solutions provided support in the form of salaries for LST who is inventor on the patent application (USPTO 17930705).LST is affiliated with Gene Solutions. The author has no other competing interests to declare

Figures

Figure 1.
Figure 1.. Workflow of SPOT-MAS (screening for the presence of tumor by methylation and size) assay for multi-cancer detection and localization.
There are three main steps in the SPOT-MAS assay. First, cell-free DNA (cfDNA) is isolated from peripheral blood, then treated with bisulfite conversion and adapter ligation to make whole-genome bisulfite cfDNA library. Second, whole-genome bisulfite cfDNA library is subjected to hybridization by probes specific for 450 target regions to collect the target capture fraction. The whole-genome fraction was retrieved by collecting the ‘flow-through’ and hybridized with probes specific for adapter sequences of DNA library. Both the target capture and whole-genome fractions were subjected to massive parallel sequencing and the resulting data were pre-processed into five different features of cfDNA: target methylation (TM), genome-wide methylation (GWM), fragment length profile (FLEN), DNA copy number (CNA), and end motif (EM). Finally, machine learning models and graph convolutional neural networks are adopted for classification of cancer status and identification tissue of origin.
Figure 2.
Figure 2.. Analysis of targeted methylation in cell-free DNA (cfDNA).
(A) Volcano plot shows log2 fold change (logFC) and significance (-log10 Benjamini-Hochberg adjusted p-value from Wilcoxon rank-sum test) of 450 target regions when comparing 499 cancer patients and 1076 healthy controls in the discovery cohort. There are 402 DMRs (p-value <0.05), color-coded by genomic locations. (B) Number of differentially methylated regions (DMRs) in the four genomic locations. (C) Kyoto Encyclopedia of Genes and Genomes (KEGG) and WikiPathway (WP) pathway enrichment analysis using g:Profiler for genes associated with the DMRs. A total of 36 pathways are enriched, suggesting a link between differences in methylation regions and tumorigenesis.
Figure 3.
Figure 3.. Genome-wide methylation changes in cell-free DNA (cfDNA) of cancer patients.
(A) Density plot showing the distribution of genome-wide methylation ratio for all cancer patients (red curve, n=499) and healthy participants (blue curve, n=1076). The left-ward shift in cancer samples indicates global hypomethylation in the cancer genome (p<0.0001, two-sample Kolmogorov-Smirnov test). (B) Log2 fold change of methylation ratio between cancer patients and healthy participants in each bin across 22 chromosomes. Each dot indicates a bin, identified as hypermethylated (red), hypomethylated (blue), or no significant change in methylation (gray).
Figure 4.
Figure 4.. Analysis of copy number aberration (CNA) in cell-free DNA (cfDNA).
(A) Log2 fold change of DNA copy number in each bin across 22 autosomes between 499 cancer patients and 1076 healthy participants in the discovery cohort. Each dot represents a bin identified as gain (red), loss (blue), or no change (gray) in copy number. (B) Proportions of different CNA bins in each autosomes.
Figure 4—figure supplement 1.
Figure 4—figure supplement 1.. Association between methylation changes and copy number aberration (CNA).
(A) Box plot indicates the log2 fold change in CNA of hypomethylated bins and bins with unchanged methylation. (B) Box plot shows log2 fold change in methylation of bins with CNA gain, loss, or unchanged CNA. p-Value estimated by the one-tailed Mann-Whitney U test.
Figure 5.
Figure 5.. Analysis of fragment length patterns of circulating tumor DNA (ctDNA) in plasma.
(A) Density plot of fragment length between cancer patients (red, n=499) and healthy participants (blue, n=1076) in the discovery cohort. Inset corresponds to an x-axis expansion of short fragment (<150 bp). (B) Ratio of short to long fragments across 22 autosomes. Each dot indicates a mean ratio for each bin in cancer patients (red) and healthy participants (blue).
Figure 5—figure supplement 1.
Figure 5—figure supplement 1.. Correlations between bisulfite and non-bisulfite converted data.
Pearson’s correlation analysis shows correlations of fragment length patterns (A) or end motifs (B) between bisulfite and non-bisulfite-treated cell-free DNA (cfDNA) from controls (n=3) and cancer samples (n=9).
Figure 6.
Figure 6.. Differences in 4-mer end motif between cancer and healthy cell-free DNA (cfDNA).
(A) Heatmap shows log2 fold change of 256 4-mer end motifs in cancer patients (n=499) compared to healthy controls (n=1076). (B) Box plots showing the top 10 motifs with significant differences in frequency between cancer patients (red) and healthy controls (blue) using Wilcoxon rank-sum test with Bonferroni-adjusted p-value <0.0001.
Figure 7.
Figure 7.. Model construction and performance validation for SPOT-MAS (screening for the presence of tumor by methylation and size).
(A) Two-model construction strategies for cancer detection. (B, C) Receiver operating characteristic (ROC) curves comparing the performance of single-feature models, and two combination models (concatenate and ensemble stacking) in the discovery (B) and validation cohorts (C). (D, E) Bar charts showing the specificity and sensitivity of single-feature models and two combination models (concatenate and ensemble stacking) in the discovery (D) and validation cohorts (E). (F, G) Dot plots showing the sensitivity of SPOT-MAS assay in detection of five different cancer types in the discovery (F) and validation cohorts (G). The points and error bars represent the sensitivity and 95% confidence intervals. Feature abbreviations as follows: TM – target methylation density, GWM – genome-wide methylation density, CNA – copy number aberration, EM – 4-mer end motif, FLEN – fragment length distribution, LONG – long fragment count, SHORT – short fragment count, TOTAL – all fragment count, RATIO – ratio of short/long fragment.
Figure 7—figure supplement 1.
Figure 7—figure supplement 1.. Exhaustive search for the optimal stacking ensemble model.
The red line indicates the area under the curve (AUC) ranking of 511 ensemble combinations. The inset shows the top 10 combinations with the highest AUC value.
Figure 7—figure supplement 2.
Figure 7—figure supplement 2.. The effects of age, gender, tumor diameter, and cancer stages on model performance.
(A, C) Box plots show probability scores of having cancer for male and female participants in the discovery (A) and validation cohort (C). (B, D) Box plots show probability scores of having cancer for male and female participants when breast cancer samples are separated from the other four cancer types in the discovery (B) and validation cohort (D). (E, F) Pearson’s correlation analysis shows no correlation between age and model prediction scores. (G, H) Box plots show prediction scores of patients with tumor diameter <3.5 cm versus those with tumor diameter >3.5 cm in the discovery (G) and validation cohort (H). (I, K) Receiver operating characteristic (ROC) curves show the classification performance of the stacking ensemble model on cancer patients with different stages (I, II, and IIIA) in the discovery (I) and validation cohort (K). (J, L) Dot plots show the sensitivity and 95% confidence intervals of SPOT-MAS (screening for the presence of tumor by DNA methylation and size) assay in the detection of stage I, II, and IIIA cancer in the discovery (J) and validation cohort (L). (A–D, G–H) Boxes correspond to interquartile ranges (IQR) which include values between 25th to 75th percentile. The horizontal line inside the box indicated the median. The whiskers extended to the smallest or largest data points. The one-tailed Mann-Whitney U test was used to compare the prediction scores among different groups. ns: not significant; ****, p<0.0001.
Figure 8.
Figure 8.. The performance of SPOT-MAS (screening for the presence of tumor by methylation and size) assay in prediction of the tissue of origin.
(A) Model construction strategy to predict tissue of origin by combining nine sets of cell-free DNA (cfDNA) features using graph convolutional neural networks. (B) Heatmap shows feature important scores of five cancer types. (C) Bar chart indicates the contribution of important features for classifying five different cancers. (D) Three dimensions graph represents the classification of five cancer types. (E, F) Cross-tables show agreement between the prediction (x-axis) and the reference (y-axis) to predict tissue of origin in the discovery cohort (E) and validation cohort (F).
Figure 8—figure supplement 1.
Figure 8—figure supplement 1.. Construction of machine learning models for tissue of origin (TOO) identification.
(A) Model construction strategy. Random forest (RF), convolutional neural network (CNN), and graph convolutional neural network (GCNN) are used to classify the five cancer types from the input of concatenated nine sets of cell-free DNA (cfDNA) features. The performance of constructed models was evaluated on the validation cohort. (B, C) Bar charts comparing the performance accuracy of the three models in the discovery (B) and validation cohort (C).
Figure 8—figure supplement 2.
Figure 8—figure supplement 2.. Comparison of accuracy for detecting five cancer types between single-feature model and stack model.
(A, B) The accuracy of single-feature models and stack model for detecting five cancer types in the discovery (A) and validation cohort (B). (C, D) The number of missed cases by the single-feature models and stack model in the discovery (C) and validation cohort (D).

Update of

  • doi: 10.1101/2023.04.12.23288460
  • doi: 10.7554/eLife.89083.1
  • doi: 10.7554/eLife.89083.2

References

    1. Baldacchino S, Grech G. Somatic copy number aberrations in metastatic patients: The promise of liquid biopsies. Seminars in Cancer Biology. 2020;60:302–310. doi: 10.1016/j.semcancer.2019.12.014. - DOI - PubMed
    1. Brennan K, Flanagan JM. Is there a link between Genome-Wide Hypomethylation in Blood and Cancer Risk? Cancer Prevention Research. 2012;5:1345–1357. doi: 10.1158/1940-6207.CAPR-12-0316. - DOI - PubMed
    1. Buitrago D, Labrador M, Arcon JP, Lema R, Flores O, Esteve-Codina A, Blanc J, Villegas N, Bellido D, Gut M, Dans PD, Heath SC, Gut IG, Brun Heath I, Orozco M. Impact of DNA methylation on 3D genome structure. Nature Communications. 2021;12:3243. doi: 10.1038/s41467-021-23142-8. - DOI - PMC - PubMed
    1. Caggiano C, Celona B, Garton F, Mefford J, Black BL, Henderson R, Lomen-Hoerth C, Dahl A, Zaitlen N. Comprehensive cell type decomposition of circulating cell-free DNA with CelFiE. Nature Communications. 2021;12:2717. doi: 10.1038/s41467-021-22901-x. - DOI - PMC - PubMed
    1. Chan KCA, Jiang P, Chan CWM, Sun K, Wong J, Hui EP, Chan SL, Chan WC, Hui DSC, Ng SSM, Chan HLY, Wong CSC, Ma BBY, Chan ATC, Lai PBS, Sun H, Chiu RWK, Lo YMD. Noninvasive detection of cancer-associated genome-wide hypomethylation and copy number aberrations by plasma DNA bisulfite sequencing. PNAS. 2013;110:18761–18768. doi: 10.1073/pnas.1313995110. - DOI - PMC - PubMed

Publication types