

Tract-wise microstructural analysis informs on current and future disability in early multiple sclerosis
- PMID: 37819462
- PMCID: PMC10827809
- DOI: 10.1007/s00415-023-12023-3
Tract-wise microstructural analysis informs on current and future disability in early multiple sclerosis
Abstract
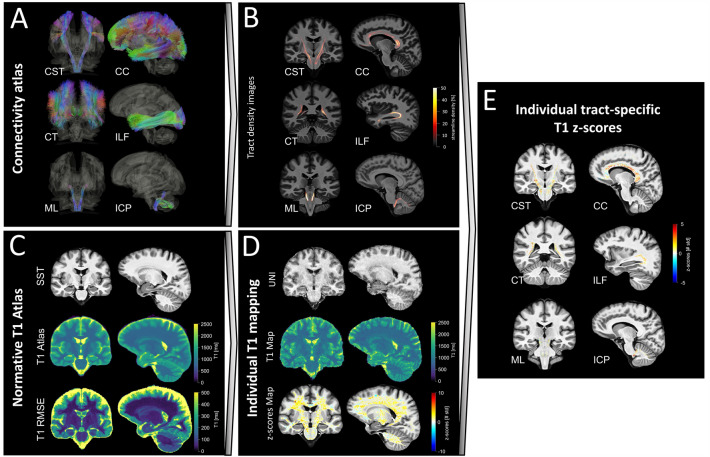
Objectives: Microstructural characterization of patients with multiple sclerosis (MS) has been shown to correlate better with disability compared to conventional radiological biomarkers. Quantitative MRI provides effective means to characterize microstructural brain tissue changes both in lesions and normal-appearing brain tissue. However, the impact of the location of microstructural alterations in terms of neuronal pathways has not been thoroughly explored so far. Here, we study the extent and the location of tissue changes probed using quantitative MRI along white matter (WM) tracts extracted from a connectivity atlas.
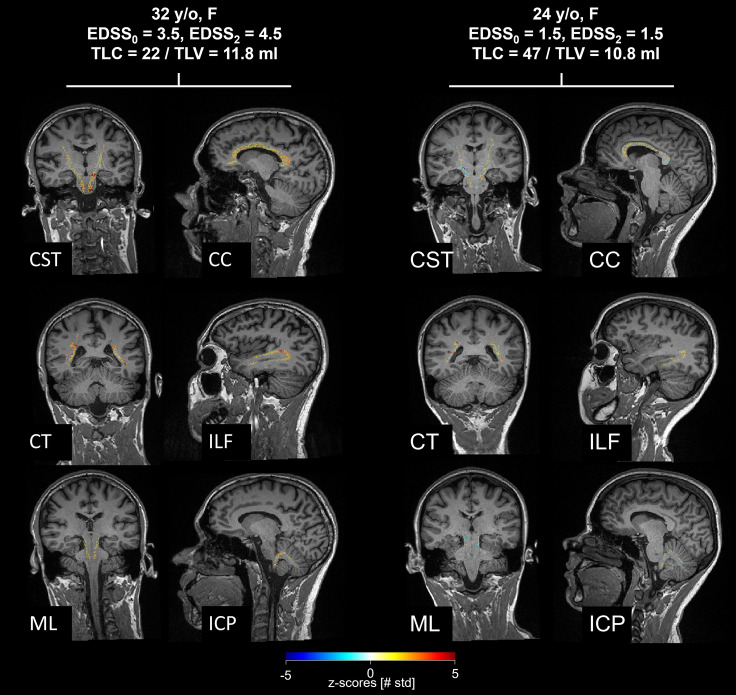
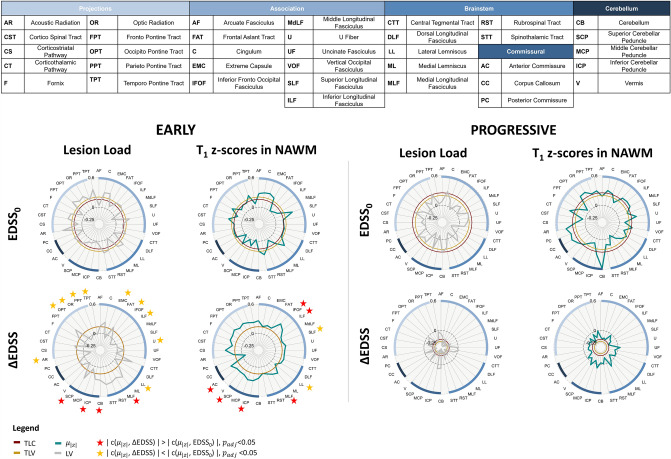
Methods: We quantified voxel-wise T1 tissue alterations compared to normative values in a cohort of 99 MS patients. For each WM tract, we extracted metrics reflecting tissue alterations both in lesions and normal-appearing WM and correlated these with cross-sectional disability and disability evolution after 2 years.
Results: In early MS patients, T1 alterations in normal-appearing WM correlated better with disability evolution compared to cross-sectional disability. Further, the presence of lesions in supratentorial tracts was more strongly associated with cross-sectional disability, while microstructural alterations in infratentorial pathways yielded higher correlations with disability evolution. In progressive patients, all major WM pathways contributed similarly to explaining disability, and correlations with disability evolution were generally poor.
Conclusions: We showed that microstructural changes evaluated in specific WM pathways contribute to explaining future disability in early MS, hence highlighting the potential of tract-wise analyses in monitoring disease progression. Further, the proposed technique allows to estimate WM tract-specific microstructural characteristics in clinically compatible acquisition times, without the need for advanced diffusion imaging.
Keywords: Demyelinating diseases; Magnetic resonance imaging; Multiple sclerosis; Relaxometry; White matter.
© 2023. The Author(s).
Conflict of interest statement
The authors of this manuscript declare relationships with the following companies: V. Ravano, J-P. Thiran and J. Richiardi have no financial or proprietary interests in any material discussed in this article. G.F. Piredda, J.A. Disselhorst, T. Hilbert, B. Maréchal and T. Kober are employed by Siemens Healthineers International AG, Switzerland. M. Vaneckova received compensation for speaker honoraria, travel and consultant fees from Biogen, Sanofi Genzyme, Novartis, Roche and Teva, as well as support for research activities from Biogen. J. Krasensky received financial support for research activities from Biogen Idec. M. Andelova received financial support for conference travel from Novartis, Genzyme, Merck Serono, Biogen Idec and Roche. T. Uher received financial support for conference travel from Biogen Idec, Novartis, Sanofi, Roche and Merck Serono and speaker honoraria from Biogen Idec, Novartis and Roche as well as support for research activities from Biogen Idec and Sanofi. B. Srpova received compensation for traveling and conference fees from Novartis, Sanofi Genzyme, Biogen Idec, Roche and Merck as well as support for research activities from Biogen Idec. E.K. Havrdova received speaker honoraria and consultant fees from Biogen Idec, Merck Serono, Novartis, Genzyme and Teva, as well as support for research activities from Biogen Idec and Merck Serono. K. Vodehnalova received compensation for traveling, conference fees and consulting fees from Merck, Teva, Sanofi Genzyme, Biogen Idec, Novartis, Roche. D. Horakova received compensation for travel, speaker honoraria, and consultant fees from Biogen Idec, Novartis, Merck, Bayer, Sanofi Genzyme, Roche and Teva, as well as support for research activities from Biogen Idec. She was also supported by the Czech Ministry of Education project Progress Q27/LF1. P. Nytrova received speaker honoraria and consultant fees from Biogen, Novartis, Merck, Roche, and financial support for research activities from Roche and Merck.
Figures
Similar articles
-
Periventricular gradient of T1 tissue alterations in multiple sclerosis.Neuroimage Clin. 2022;34:103009. doi: 10.1016/j.nicl.2022.103009. Epub 2022 Apr 16. Neuroimage Clin. 2022. PMID: 35561554 Free PMC article.
-
Evidence of early microstructural white matter abnormalities in multiple sclerosis from multi-shell diffusion MRI.Neuroimage Clin. 2019;22:101699. doi: 10.1016/j.nicl.2019.101699. Epub 2019 Jan 30. Neuroimage Clin. 2019. PMID: 30739842 Free PMC article.
-
Advanced diffusion-weighted imaging models better characterize white matter neurodegeneration and clinical outcomes in multiple sclerosis.J Neurol. 2022 Sep;269(9):4729-4741. doi: 10.1007/s00415-022-11104-z. Epub 2022 Apr 10. J Neurol. 2022. PMID: 35397753
-
T1/T2-weighted ratio: A feasible MRI biomarker in multiple sclerosis.Mult Scler. 2024 Mar;30(3):283-291. doi: 10.1177/13524585241233448. Epub 2024 Feb 22. Mult Scler. 2024. PMID: 38389172 Review.
-
Advanced Diffusion MR Imaging for Multiple Sclerosis in the Brain and Spinal Cord.Magn Reson Med Sci. 2022 Mar 1;21(1):58-70. doi: 10.2463/mrms.rev.2021-0091. Epub 2022 Feb 15. Magn Reson Med Sci. 2022. PMID: 35173096 Free PMC article. Review.
References
MeSH terms
Grants and funding
LinkOut - more resources
Full Text Sources
Medical
