. 2023 Nov 8;8(21):e168596.
doi: 10.1172/jci.insight.168596.

A nerve-goblet cell association promotes allergic conjunctivitis through rapid antigen passage

Affiliations

A nerve-goblet cell association promotes allergic conjunctivitis through rapid antigen passage

Meiko Kimura et al. JCI Insight. .

Abstract

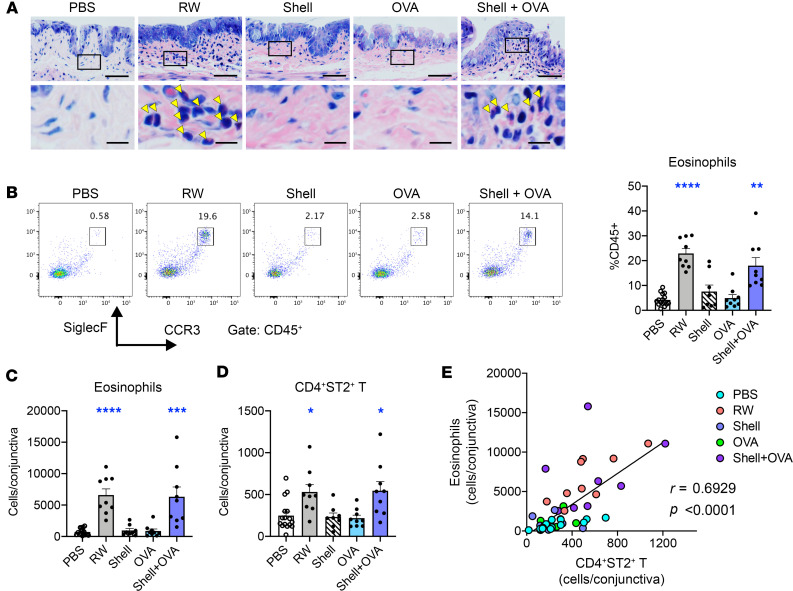
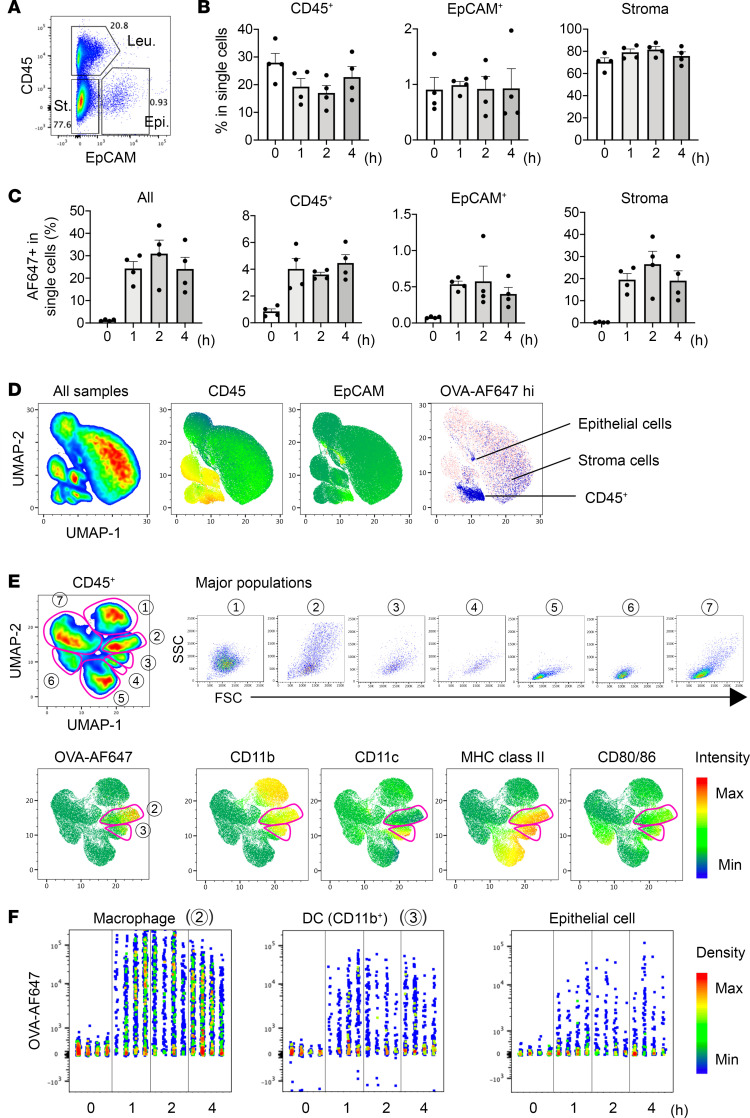
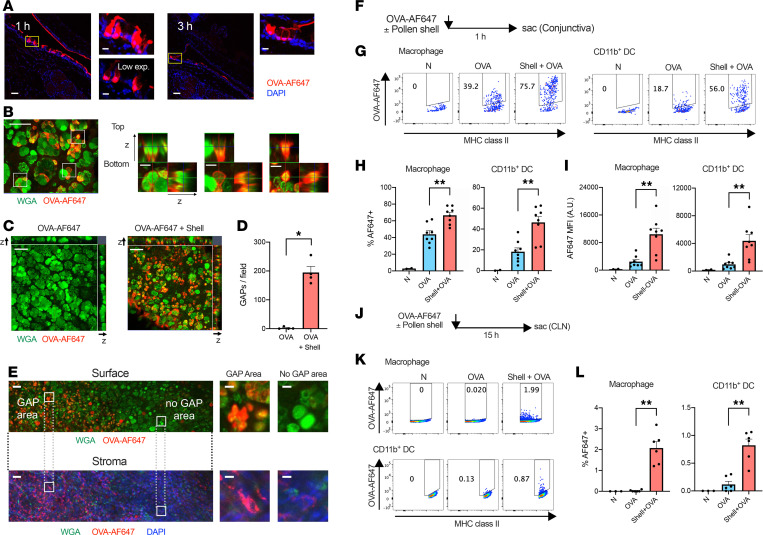
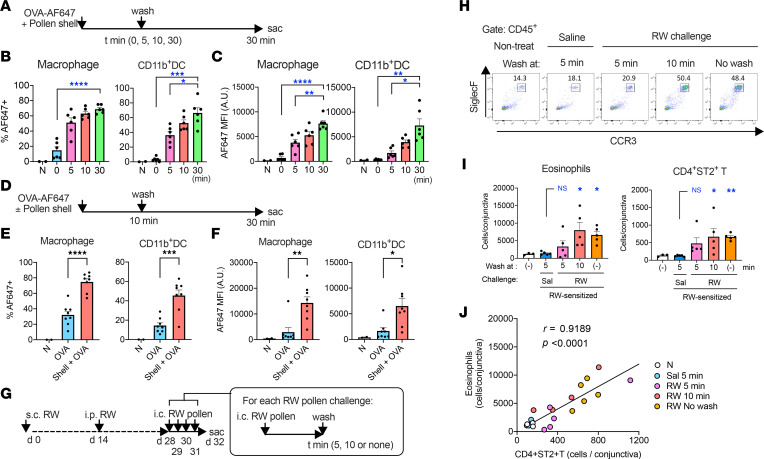
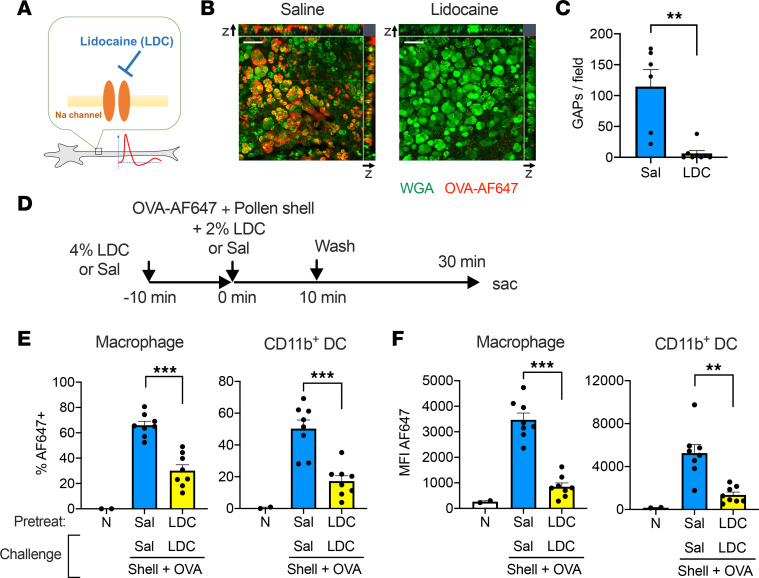
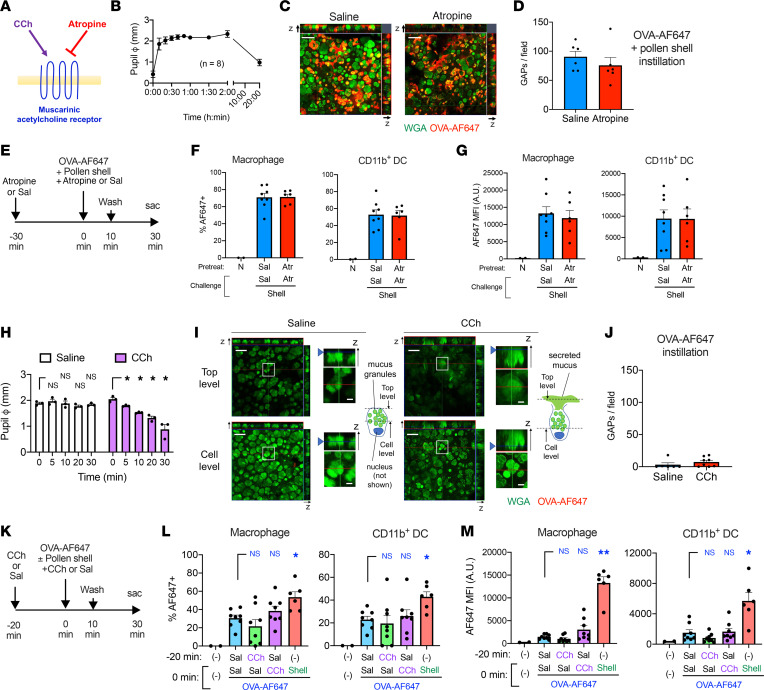
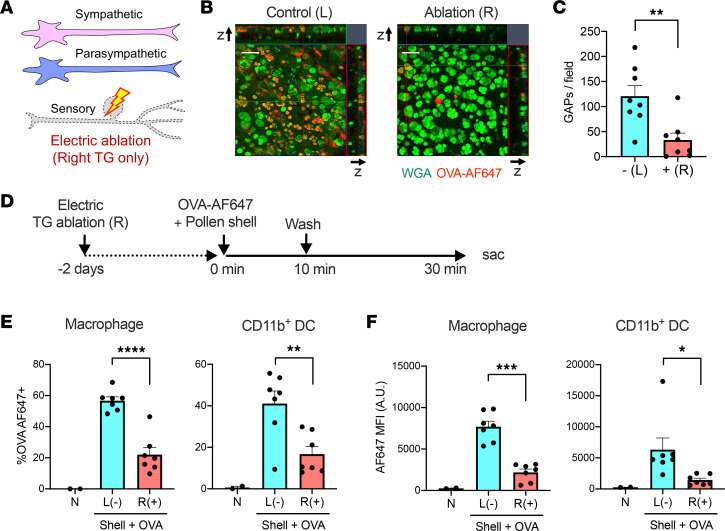
The penetration of allergens through the epithelial layer is the initial step in the development of allergic conjunctivitis. Although pollinosis patients manifest symptoms within minutes after pollen exposure, the mechanisms of the rapid transport of the allergens remain unclear. In the present study, we found that the instillation of pollen shells rapidly induces a large number of goblet cell-associated antigen passages (GAPs) in the conjunctiva. Antigen acquisition by stromal cells, including macrophages and CD11b+ dendritic cells, correlated with surface GAP formation. Furthermore, a substantial amount of antigen was transported to the stroma during the first 10 minutes of pollen exposure, which was sufficient for the full induction of an allergic conjunctivitis mouse model. This inducible, rapid GAP formation and antigen acquisition were suppressed by topical lidocaine or trigeminal nerve ablation, indicating that the sensory nervous system plays an essential role. Interestingly, pollen shell-stimulated GAP formation was not suppressed by topical atropine, suggesting that the conjunctival GAPs and intestinal GAPs are differentially regulated. These results identify pollen shell-induced GAP as a therapeutic target for allergic conjunctivitis.

Keywords: Allergy; Immunology; Ophthalmology.


Conflict of interest statement

Conflict of interest: The authors have declared that no conflict of interest exists.

Figures

Figure 1
Figure 1. Repeated topical application of OVA combined with RW pollen shells elicits eosinophilic conjunctivitis.
(A) Giemsa staining of the conjunctival tissue at ×200 magnification. Scale bars: 50 μm (lower magnification) and 10 μm (insets). Arrowheads denote eosinophils. (BD) Conjunctival eosinophil populations among CD45+ cells (B and C) and cell numbers of indicated populations in the conjunctiva (D). Pooled results of 2 independent experiments (n = 8–18). Data are shown as mean ± SEM. *P < 0.05, **P < 0.01, ***P < 0.001, ****P < 0.0001 by 2-tailed Kruskal-Wallis test with Dunn’s multiple-comparison test. (E) Pearson’s correlation between CD4+ST2+ T cell and eosinophil numbers in the conjunctiva. The B6 mouse strain was used for all experiments.
Figure 2
Figure 2. Kinetics and cell populations for antigen uptake.
(A) Frequencies of the pooled dispersed conjunctival cell populations. Leu, leukocytes; Epi, epithelial cells; St, stromal cells. (B and C) Kinetics of the frequencies of indicated cell populations (B) and those of indicated cell populations that are OVA-AF647 positive (C) (n = 4, each time point). Data are shown as mean ± SEM (B and C). (D) Unsupervised clustering of the conjunctival cells. The expression levels of CD45 and EpCAM are shown in heatmaps. OVA-AF647–high cells are shown in blue. (E) Unsupervised clustering of the CD45+ cells revealed 7 distinct populations with differential forward- and side-scatter distributions. The expression levels of the indicated markers are shown in heatmaps. (F) Kinetics of OVA-AF647 uptake by the indicated cell populations (n = 4, each time point). B6 mice were used for all experiments.
Figure 3
Figure 3. RW pollen shells promote GAP formation and antigen uptake through the conjunctiva.
(A) Localization of OVA-AF647 in the conjunctiva at the indicated time periods after topical instillation of RW pollen shells and OVA-AF647. (B) Representative morphology of GAPs in the conjunctiva. (C and D) GAP formation in the conjunctiva 5 minutes after instillation of the indicated formula. Representative images (C) and quantitation (D) (n = 4, each condition). *P < 0.05 by 2-tailed Mann-Whitney test. (E) Representative images of the conjunctival surface with the corresponding stroma below. Scale bars: 50 μm (lower magnification) and 10 μm (insets) (AC and E). (F) Diagram for OVA-AF647 uptake experiment. Naive mice were challenged once, and the antigen uptake was evaluated. (GI) Frequencies of OVA-AF647+ cells and mean fluorescence intensity (MFI) in the indicated cell populations (n = 2–8). A.U., arbitrary units; N, nontreated. The nontreated samples were used for setting the positive gate and were excluded from the statistical analysis. **P < 0.01 by 2-tailed Student’s t test with Welch’s correction. (J) Diagram of the antigen transport experiment. CLN, cervical lymph nodes. (K and L) Frequencies of OVA-AF647+ cells in the indicated populations in the cervical lymph nodes (n = 3–6). B6 mice were used for all experiments. Data are shown as mean ± SEM (D, H, I, and L).
Figure 4
Figure 4. Early antigen passage is essential for the antigen uptake and the development of allergic conjunctivitis.
(A) Experimental diagram for panels B and C. (B and C) The frequencies of OVA-AF647+ cells (B) and the mean fluorescence intensity (MFI) (C) of the indicated cell populations in the conjunctiva that was exposed to OVA-AF647 with RW pollen shells for the indicated periods of time (n = 2–6). A.U., arbitrary units; N, nontreated. The nontreated samples were used for setting the positive gate and were excluded from the statistical analysis. *P < 0.05; **P < 0.01; ***P < 0.001; ****P < 0.0001 by 2-tailed Brown-Forsythe and Welch’s ANOVA test with Dunnett’s T3 multiple-comparison test against the 30-minute exposure. (D) Experimental diagram for panels E and F. Naive mice were challenged once, and the antigen uptake was evaluated. (E and F) The antigen uptake by indicated cell types after instillation of the indicated formula (n = 2–8). *P < 0.05, **P < 0.01, ***P < 0.001, ****P < 0.0001 by 2-tailed Student’s t test with Welch’s correction. (G) Experimental diagram of the systemically sensitized model of allergic conjunctivitis with eye wash at the indicated time points after instillation of pollen suspension. (H) Representative gating of eosinophil populations among CD45+ cells. (I and J) Cell numbers of indicated populations (I) and their correlation (J) (n = 3–5). Sal, saline. In I, (–) indicates no treatment. Data are shown as mean ± SEM (B, C, E, F, and I). *P < 0.05, **P < 0.01 by Kruskal-Wallis test with Dunn’s multiple-comparison test against saline-challenged mice. B6 mice were used for AF and BALB/c mice were used for GJ.
Figure 5
Figure 5. Topical lidocaine inhibits RW pollen shell–stimulated GAP formation and antigen uptake.
(A) Lidocaine blocks Na+ channels in neurons. (B and C) GAP formation after instillation of OVA-AF647 and RW pollen shells. The indicated formula was also instilled 10 minutes prior to and together with OVA-AF647. Representative image (B) and quantitation (C) (n = 6–8). Sal, saline. Scale bars: 50 μm. **P < 0.01 by 2-tailed Mann-Whitney test. (D) The diagram of the antigen passage experiment. LDC, lidocaine. (E and F) The frequencies of OVA-AF647+ cells (E) and the mean fluorescence intensity (MFI) (F) of the indicated cell populations (n = 2–8). N, nontreated. Data are shown as mean ± SEM (C, E, and F). The nontreated samples were used for setting the positive gate and were excluded from the statistical analysis. **P < 0.01, ***P < 0.001 by 2-tailed Mann-Whitney test. B6 mice were used for all experiments.
Figure 6
Figure 6. Muscarinic acetylcholine receptors (mAchRs) are not essential for RW pollen shell–stimulated GAP formation.
(A) mAchRs are stimulated by carbamylcholine (CCh) and inhibited by atropine (Atr). (B) Kinetics of mydriasis after atropine instillation. (C and D) GAP formation 5 minutes after instillation of OVA-AF647 and pollen shells. The indicated formula was instilled 30 minutes prior to the challenge. Representative image (C) and quantification (D) (n = 6, each). Scale bar: 50 μm. (E) Diagram of the antigen passage experiment. Sal, saline. (F and G) The frequencies of OVA-AF647+ cells (F) and the mean fluorescence intensity (MFI) (G) of the indicated cell types (n = 2–8). N, nontreated. (H) Kinetics of miosis after CCh instillation to the euthanized mice (n = 3, each). *P < 0.05 by 2-way ANOVA with Holm-Šidák multiple-comparison test. (I and J) GAP formation and mucus secretion after instillation of OVA-AF647 along with the indicated formula. Representative images (I) and GAP quantitation (J) (n = 6–8). Scale bars: 50 μm (lower magnification) and 10 μm (insets). Annotated diagrams of the goblet cells in the insets are also shown. (K) Diagram for the antigen passage experiment in L and M. (L and M) The frequencies of OVA-AF647+ cells (L) and the MFI (M) of the indicated cell types. The nontreated samples were used for setting the positive gate and were excluded from the statistical analysis. *P < 0.05, **P < 0.01 by 1-way ANOVA with Holm-Šidák multiple-comparison test (L) and Kruskal-Wallis test with Dunn’s multiple-comparison test (M) against saline- and OVA-AF647–treated mice (n = 2–8). In L and M, (–) indicates no treatment. Data are shown as mean ± SEM (B, D, FH, J, L, and M). B6 mice were used for all the experiments.
Figure 7
Figure 7. Trigeminal nerve ablation inhibits RW pollen shell–stimulated GAP formation and early antigen uptake.
(A) The trigeminal (TG) nerve was ablated by bipolar coagulation. (B and C) GAP formation 5 minutes after instillation of OVA-AF647 and pollen shells. Representative image (B) and quantitation (C) (n = 8). Scale bars: 50 μm. **P < 0.01 by 2-tailed, paired Student’s t test. (D) Experimental diagram of the early antigen passage after TG ablation. (E and F) The frequencies of OVA-AF647+ cells (E) and the mean fluorescence intensity (MFI) (F) of the indicated cell types (n = 2–7). The nontreated samples were used for setting the positive gate and were excluded from the statistical analysis. In C, E, and F, – or (–) indicates no TG ablation and + or (+) indicates TG ablation. *P < 0.05, **P < 0.01, ***P < 0.001, ****P < 0.0001 by 2-tailed, paired Student’s t test. B6 mice were used for all experiments.

References

    1. Velcich A, et al. Colorectal cancer in mice genetically deficient in the mucin Muc2. Science. 2002;295(5560):1726–1729. doi: 10.1126/science.1069094. - DOI - PubMed
    1. Bergstrom KS, et al. Muc2 protects against lethal infectious colitis by disassociating pathogenic and commensal bacteria from the colonic mucosa. PLoS Pathog. 2010;6(5):e1000902. doi: 10.1371/journal.ppat.1000902. - DOI - PMC - PubMed
    1. Hodges RR, Dartt DA. Tear film mucins: front line defenders of the ocular surface; comparison with airway and gastrointestinal tract mucins. Exp Eye Res. 2013;117:62–78. doi: 10.1016/j.exer.2013.07.027. - DOI - PMC - PubMed
    1. Swamynathan SK, Wells A. Conjunctival goblet cells: ocular surface functions, disorders that affect them, and the potential for their regeneration. Ocul Surf. 2020;18(1):19–26. doi: 10.1016/j.jtos.2019.11.005. - DOI - PMC - PubMed
    1. Portal C, et al. Ocular mucins in dry eye disease. Exp Eye Res. 2019;186:107724. doi: 10.1016/j.exer.2019.107724. - DOI - PubMed

Publication types