. 2023 Dec 14;41(12):1142-1156.
doi: 10.1093/stmcls/sxad071.

Lethal Phenotype-Based Database Screening Identifies Ceramide as a Negative Regulator of Primitive Streak Formation

Affiliations

Lethal Phenotype-Based Database Screening Identifies Ceramide as a Negative Regulator of Primitive Streak Formation

Jing Pu et al. Stem Cells. .

Abstract

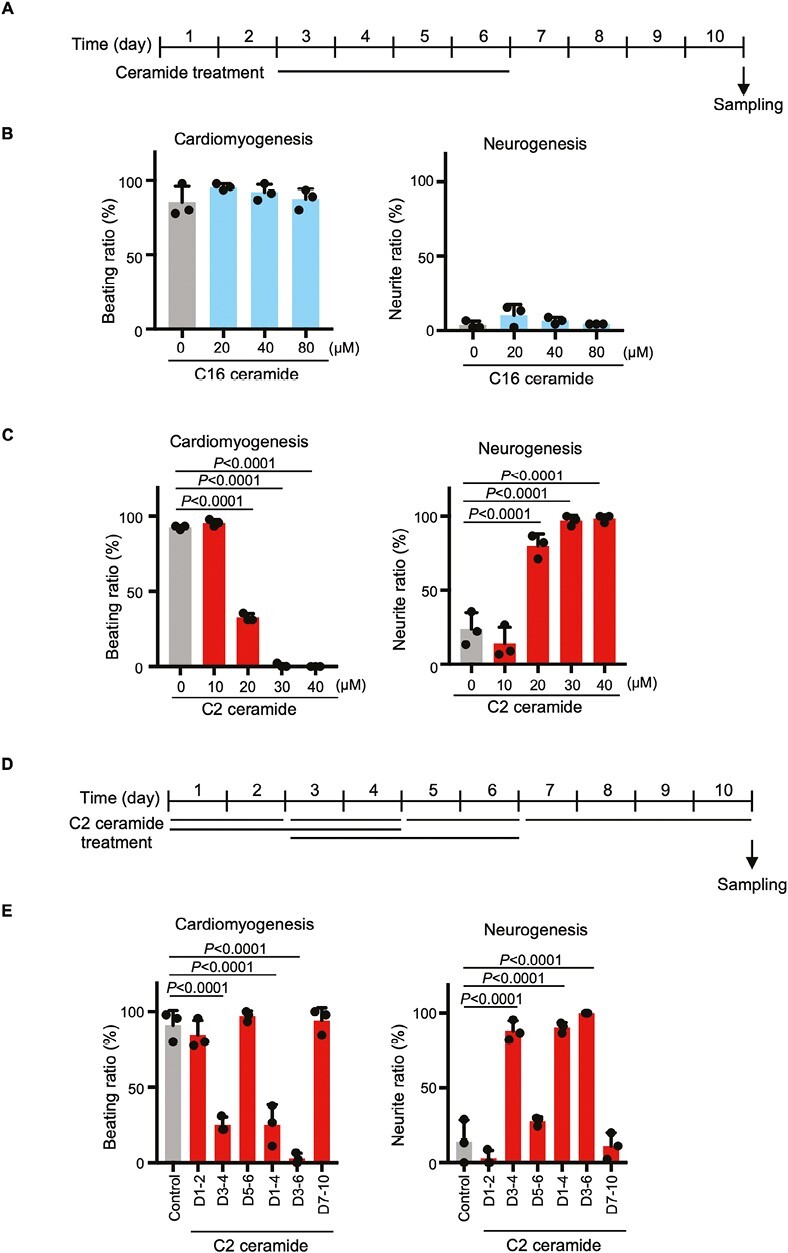
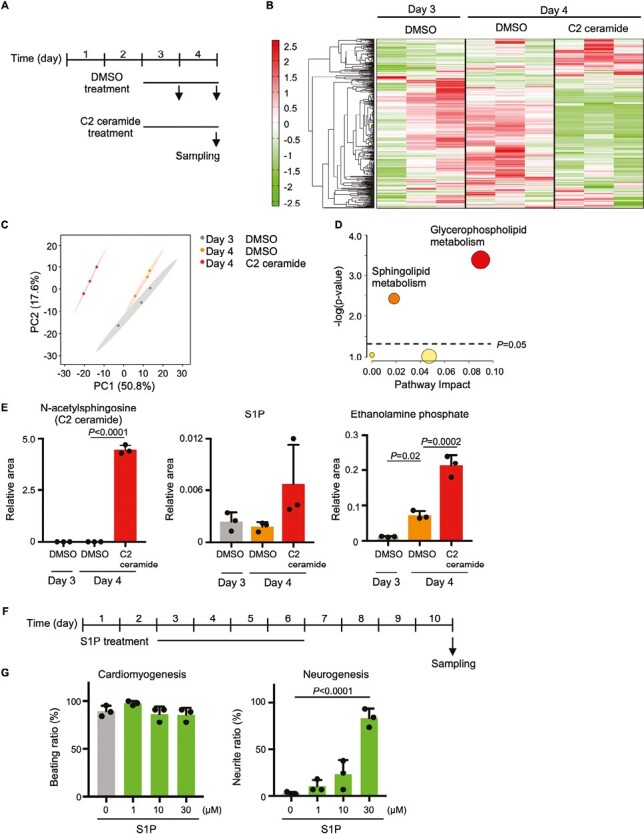
In early embryogenesis, the primitive streak (PrS) generates the mesendoderm and is essential for organogenesis. However, because the PrS is a minute and transient tissue, elucidating the mechanism of its formation has been challenging. We performed comprehensive screening of 2 knockout mouse databases based on the fact that failure of PrS formation is lethal. We identified 812 genes involved in various cellular functions and responses that might be linked to PrS formation, with the category of greatest abundance being "Metabolism." In this study, we focused on genes of sphingolipid metabolism and investigated their roles in PrS formation using an in vitro mouse ES cell differentiation system. We show here that elevated intracellular ceramide negatively regulates gene expression essential for PrS formation and instead induces neurogenesis. In addition, sphingosine-1-phosphate (a ceramide derivative) positively regulates neural maturation. Our results indicate that ceramide regulates both PrS formation and the induction of neural differentiation.

Keywords: cardiac differentiation; ceramide; neural differentiation; primitive streak; sphingosine-1-phosphate.


Conflict of interest statement

The authors declared no potential conflicts of interest.

Figures

Graphical Abstract
Graphical Abstract
Figure 1.
Figure 1.
Comprehensive screening of knockout mouse databases for genes whose loss induces embryonic lethality by E10. (A) Diagram of the scheme used for KO mouse database screening. See main text for details. (B) Enrichment analysis. The circle size reflects the number of genes assigned to each term. The largest group, “Metabolic pathways,” is highlighted in red.
Figure 2.
Figure 2.
Effects of NB-DNJ and D-NMAPPD on PrS formation. (A) Diagram of the sphingolipid metabolic pathway. Genes encoding relevant enzymes and their specific inhibitors are shown in blue and green, respectively. (B) Experimental scheme for the EB differentiation assays in C and D. (C) Immunostaining of EBs with anti-β-tubulin III antibody to detect morphological changes after treatment with the indicated inhibitors for days 3-6. Scale bar = 400 μm. Data are representative of 3 biologically independent experiments. (D) Quantitation of dose-dependent effects of NB-DNJ or D-NMAPPD on EB cardiomyogenesis and neurogenesis. Data are the mean + s.d. of n = 3 biologically independent samples. Statistical analysis was performed by one-way ANOVA with the Tukey test. (E) Experimental scheme for the time course experiments in F. (F) Quantitation of cardiomyogenesis and neurogenesis in EBs that were treated with 50 μM NB-DNJ or 30 μM D-NMAPPD for the indicated periods. Data are the mean + s.d. of n = 3 biologically independent samples. Statistical analysis was performed by one-way ANOVA with the Tukey test. (G) Experimental scheme for the time course experiments in H. (H) Real-time PCR analysis of indicated genes’ mRNA levels in EBs treated with DMSO, 50 μM NB-DNJ, or 50 μM D-NMAPPD for days 3-6. Data are expressed relative to Gapdh and are the mean ± s.d. of n = 3 biologically independent samples. Statistical analysis was performed by 2-way ANOVA with the Dunnett’s multiple comparison test. *P < .05, **P < .01, ***P < .001.
Figure 3.
Figure 3.
Effects of NB-DNJ on lipid metabolism. (A) Experimental scheme for metabolomic analysis of NB-DNJ-treated EBs. (B) Clustering analysis of lipid metabolites in control EBs and in EBs treated with the indicated concentrations of NB-DNJ for the indicated periods. Red, upregulated metabolites; green, downregulated metabolites. (C) PCA plot of lipid metabolites in the control and NB-DNJ-treated EBs in B. (D) Quantitation of lactosylceramide (upper panel) and sphingomyelin (lower panel) in EBs treated with NB-DNJ as indicated. Data are expressed as the relative area, which indicates the amount of a metabolite normalized to internal standards, and are the mean + s.d. of n = 3 biologically independent samples. Statistical analysis was performed by one-way ANOVA with the Tukey test.
Figure 4.
Figure 4.
Effects of ceramides on cardiomyogenesis and neurogenesis. (A) Experimental scheme for the EB differentiation experiments in B and C. (B) Quantitation of cardiomyogenesis and neurogenesis in EBs that were treated with the indicated concentrations of C16 ceramide for days 3-6. Data are the mean + s.d. of n = 3 biologically independent samples. Statistical analysis was performed by one-way ANOVA with the Tukey test. (C) Quantitation of cardiomyogenesis and neurogenesis in EBs that were treated with the indicated concentrations of C2 ceramide for days 3-6. Data are the mean + s.d. of n = 3 biologically independent samples. Statistical analysis was performed by one-way ANOVA with the Tukey test. (D) Experimental scheme for time course experiments in E. (E) Quantitation of cardiomyogenesis and neurogenesis in EBs treated with 30 μM C2 ceramide for the indicated periods. Data are the mean + s.d. of n = 3 biologically independent samples. Statistical analysis was performed by one-way ANOVA with the Tukey test.
Figure 5.
Figure 5.
Effects of ceramide on gene expression. (A) Experimental scheme for the transcriptomic analysis of EBs that were treated with DMSO (vehicle control) or 30 μM C2 ceramide for days 3-4. (B) GO analysis of genes whose expression levels in control EBs increased on day 4 compared to day 3, but were inhibited by C2 ceramide treatment. (C) Quantitation of Brachyury T, Wnt3 and Bmp2 mRNA levels in the EBs in (A), as determined by RNA-sequencing analysis. Data are expressed as transcripts per million (TPM). (D) Experimental scheme for the time course assays in E and J. (E) Real-time PCR analysis of Brachyury T, Wnt3 and Bmp2 mRNA levels in EBs treated with DMSO or 30 μM C2 ceramide for days 3-4. Data are expressed relative to Gapdh and are the mean ± s.d. of n = 3 biologically independent samples. Statistical analysis was performed by 2-way ANOVA with the Bonferroni test. *P < .05, **P < .01, ***P < .001. (F) Experimental scheme for the real-time PCR experiments in G. (G) Real-time PCR analysis of Brachyury T, Wnt3 and Bmp2 mRNA levels in EBs treated with 45 μM C2 ceramide for days 3-5. Data are expressed relative to Gapdh and are the mean ± s.d. of n = 3 biologically independent samples. Statistical analysis was performed by 2-way ANOVA with the Tukey test. (H) GO analysis of genes whose expression levels in control EBs did not increase on day 4 compared to day 3, but were induced by C2 ceramide treatment. (I) Quantitation of Sox1 mRNA levels in the EBs in (A), as determined by RNA-sequencing analysis. Data were analyzed as for (C). (J) Real-time PCR analysis of Sox1 mRNA levels in EBs treated with DMSO or 30 μM C2 ceramide for days 3-4. Data were analyzed as for (E).
Figure 6.
Figure 6.
Effects of ceramide on cellular metabolism. (A) Experimental scheme for metabolomic analysis of C2 ceramide-treated EBs. (B) Clustering analysis of metabolites in EBs treated with either DMSO or 30 μM C2 ceramide for days 3-4. (C) PCA plot of metabolites in the DMSO- or C2 ceramide-treated EBs in (B). (D) Pathway analysis of metabolites in (B) whose levels were increased on day 4 compared to day 3 and altered by C2 ceramide treatment. (E) Quantitation of N-acetylsphingosine, S1P and ethanolamine phosphate in the EBs in (B). Data are the mean + s.d. of n = 3 biologically independent samples. Statistical analysis was performed by one-way ANOVA with the Tukey test. (F) Experimental scheme for the EB differentiation experiments in (G). (G) Quantitation of cardiomyogenesis and neurogenesis in EBs treated with the indicated concentrations of S1P for days 1-6. Data are the mean + s.d. of n = 3 biologically independent samples. Statistical analysis was performed by one-way ANOVA with the Tukey test.
Figure 7.
Figure 7.
Effects of S1P, C2 ceramide, and D-NMAPPD on neurogenesis. (A) Experimental scheme for the EB drug treatments in (B). (B) Immunostaining with anti-β-tubulin III antibody to reveal morphological changes in EBs treated with methanol (MeOH), 30 μM S1P, DMSO, 30 μM C2 ceramide or 30 μM D-NMAPPD for days 3-6. Scale bar = 100 μm. Data are representative of 2 biologically independent experiments. (C) Experimental scheme for the EB drug treatments in (D). (D). Real-time PCR analysis of Sox1 mRNA levels in EBs treated as in (C). Data are the mean + s.d. of n = 3 biologically independent samples. Statistical analysis was performed by one-way ANOVA with the Tukey test. (E) Scheme illustrating how ceramide metabolism might regulate cardiomyogenesis and neurogenesis in mouse EBs. Ceramide is involved in both sphingolipid (left) and glycerophosholipid (right) metabolism. High levels of ceramide induce neurogenesis at the expense of cardiomyogenesis mainly by inhibiting PrS formation. In addition, ceramide-derived S1P promotes the maturation of neuroectoderm to form neurons. Glycerophospholipid metabolism is altered during ceramide-induced neurogenesis.

Similar articles

Cited by

References

    1. Haniffa M, Taylor D, Linnarsson S, et al. A roadmap for the Human Developmental Cell Atlas. Nature. 2021;597(7875):196-205. 10.1038/s41586-021-03620-1 - DOI - PMC - PubMed
    1. Shparberg R, Glover H, Morris MB.. Modelling mammalian commitment to the neural lineage using embryos and embryonic stem cells. Front Physiol. 2019;10.705. - PMC - PubMed
    1. Desbaillets I, Ziegler U, Groscurth P, Gassmann M.. Embryoid bodies: an in vitro model of mouse embryogenesis. Exp Physiol. 2000;85(6):645-651. - PubMed
    1. Takayanagi H, Kim S, Koga T, et al. Induction and activation of the transcription factor NFATc1 (NFAT2) integrate RANKL signaling in terminal differentiation of osteoclasts. Dev Cell. 2002;3(6):889-901. 10.1016/s1534-5807(02)00369-6 - DOI - PubMed
    1. Itskovitz-Eldor J, Schuldiner M, Karsenti D, et al. Differentiation of human embryonic stem cells into embryoid bodies compromising the three embryonic germ layers. Mol Med. 2000;6(2):88-95. - PMC - PubMed

Publication types