. 2023 Oct 11;19(10):e1010905.
doi: 10.1371/journal.pgen.1010905. eCollection 2023 Oct.

Transcriptomic comparison of two selective retinal cell ablation paradigms in zebrafish reveals shared and cell-specific regenerative responses

Affiliations

Transcriptomic comparison of two selective retinal cell ablation paradigms in zebrafish reveals shared and cell-specific regenerative responses

Kevin Emmerich et al. PLoS Genet. .

Abstract

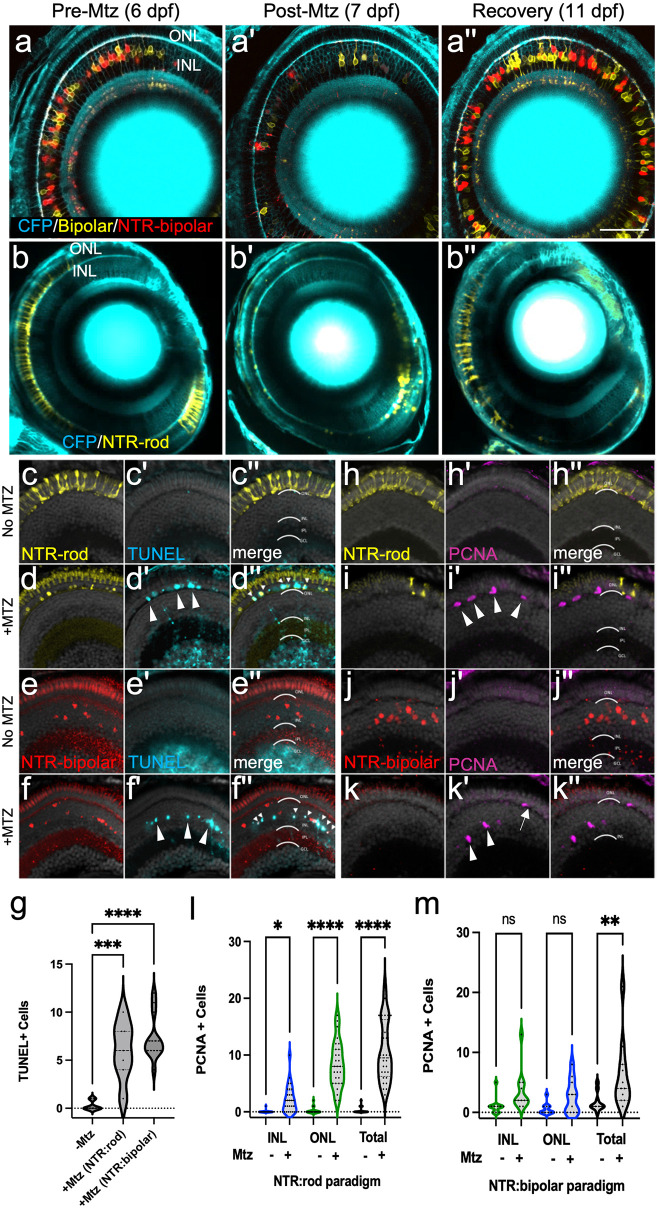
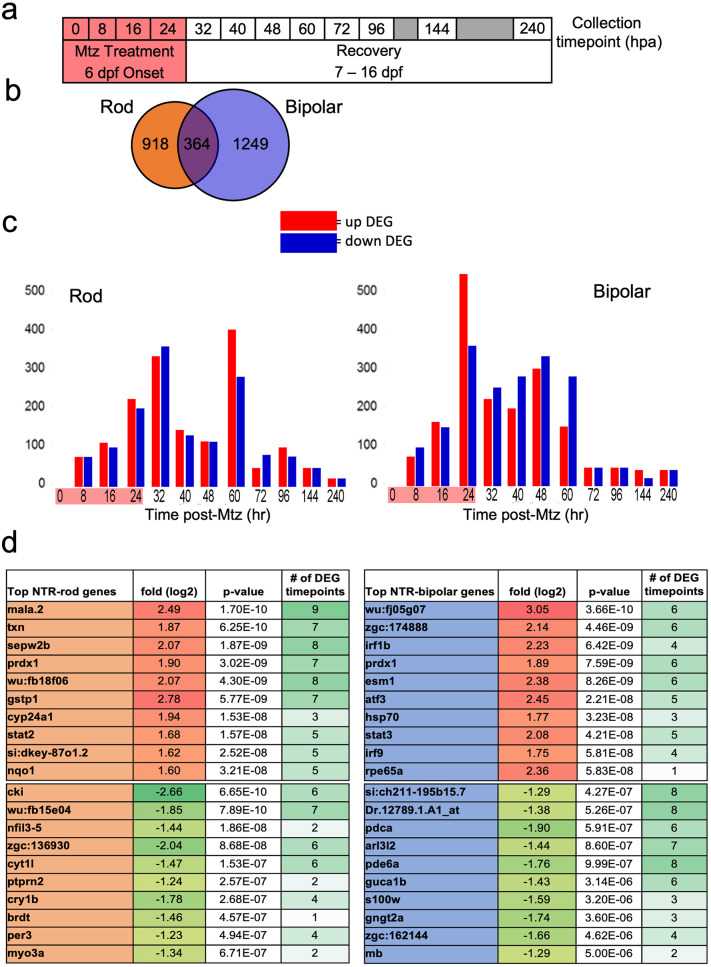
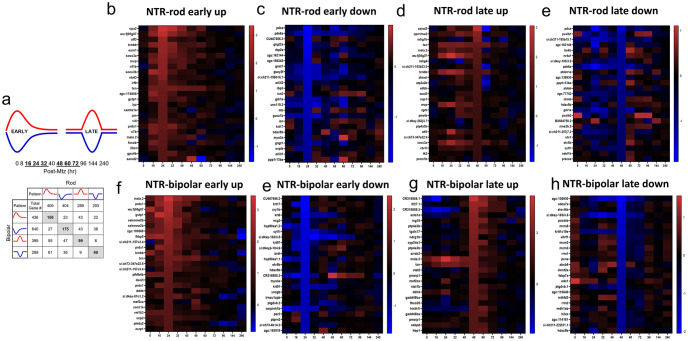
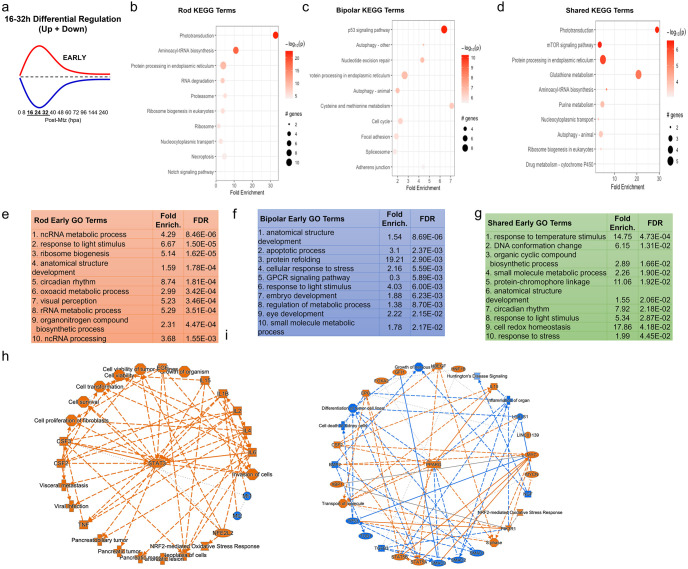
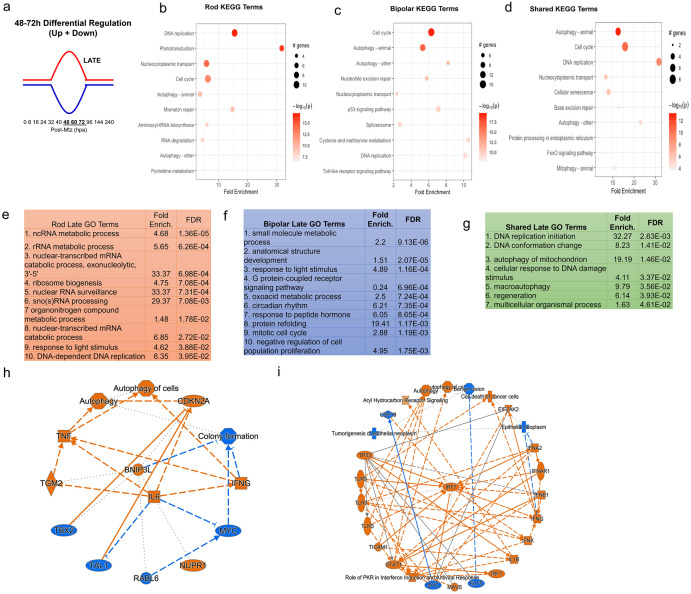
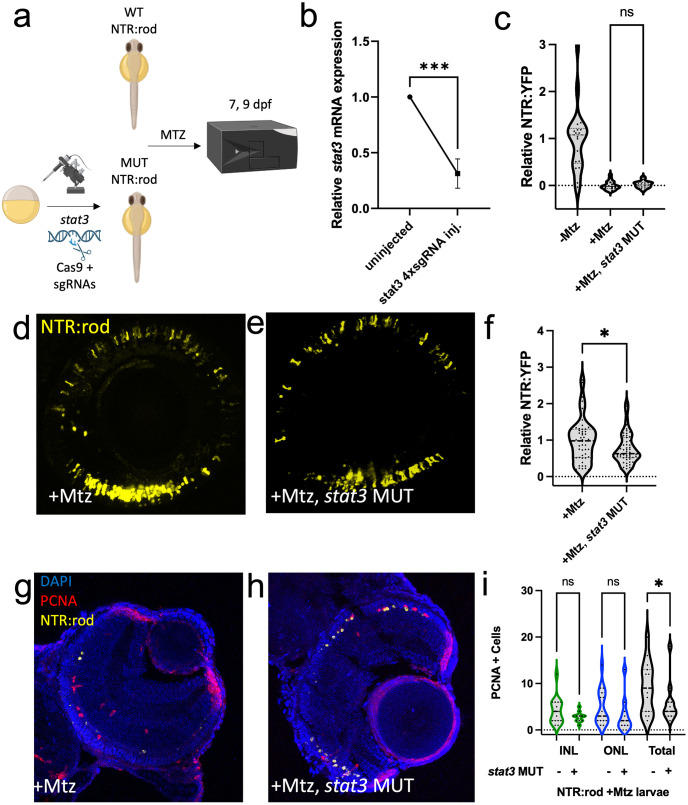
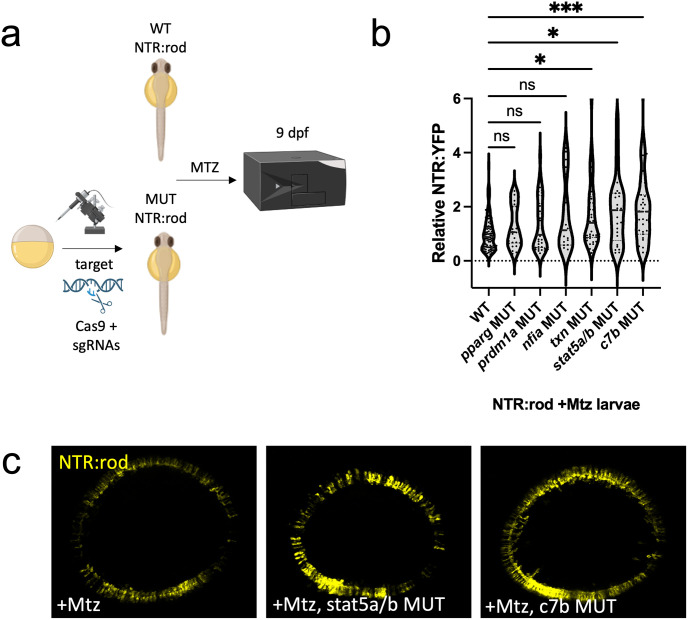
Retinal Müller glia (MG) can act as stem-like cells to generate new neurons in both zebrafish and mice. In zebrafish, retinal regeneration is innate and robust, resulting in the replacement of lost neurons and restoration of visual function. In mice, exogenous stimulation of MG is required to reveal a dormant and, to date, limited regenerative capacity. Zebrafish studies have been key in revealing factors that promote regenerative responses in the mammalian eye. Increased understanding of how the regenerative potential of MG is regulated in zebrafish may therefore aid efforts to promote retinal repair therapeutically. Developmental signaling pathways are known to coordinate regeneration following widespread retinal cell loss. In contrast, less is known about how regeneration is regulated in the context of retinal degenerative disease, i.e., following the loss of specific retinal cell types. To address this knowledge gap, we compared transcriptomic responses underlying regeneration following targeted loss of rod photoreceptors or bipolar cells. In total, 2,531 differentially expressed genes (DEGs) were identified, with the majority being paradigm specific, including during early MG activation phases, suggesting the nature of the injury/cell loss informs the regenerative process from initiation onward. For example, early modulation of Notch signaling was implicated in the rod but not bipolar cell ablation paradigm and components of JAK/STAT signaling were implicated in both paradigms. To examine candidate gene roles in rod cell regeneration, including several immune-related factors, CRISPR/Cas9 was used to create G0 mutant larvae (i.e., "crispants"). Rod cell regeneration was inhibited in stat3 crispants, while mutating stat5a/b, c7b and txn accelerated rod regeneration kinetics. These data support emerging evidence that discrete responses follow from selective retinal cell loss and that the immune system plays a key role in regulating "fate-biased" regenerative processes.


Conflict of interest statement

I have read the journal’s policy and the authors of this manuscript have the following competing interests: JSM holds patents for the NTR inducible cell ablation system (US #7,514,595) and uses thereof (US #8,071,838 and US#8431768).

Figures

Fig 1
Fig 1. Two Nitroreductase (NTR) models enabling inducible retinal cell-type specific ablation.
(a-b series) In vivo time-series imaging following the NTR-bipolar (a-a”) or NTR-rod (b-b”) response to metronidazole (Mtz) treatment to induce cell death and regeneration. Images were taken in the same fish at 6 dpf (before Mtz onset, a, b), 7 dpf (after treatment, a’, b’) and 11 dpf (following recovery, a”, b”). Larvae for each ablation paradigm express CFP derived from Tg(pax6-DF4:gap43-CFP)q01 to label general retinal structures. (c-f series) Representative histological staining for TUNEL (terminal deoxynucleotidyl transferase dUTP nick end labeling) at 7 dpf in uninjured NTR-rod larvae (c-c”) and Mtz treated NTR-rod larvae (d-d”) as well as in uninjured and Mtz-treated NTR-bipolar larvae (e-e”, f-f”, respectively). (g) Quantification of TUNEL+ cell counts at 7 dpf in untreated fish (-Mtz) or following the ablation of each cell type [+Mtz (NTR-rod) and +Mtz (NTR-bipolar)]. For the statistical analysis, Welch’s one-way ANOVA was followed by student’s t test with Dunnett’s method for multiple comparisons correction. (h-k series). Representative histological staining for PCNA (proliferative cell nuclear antigen) at 9 dpf in uninjured NTR-rod larvae (h-h”) and Mtz treated NTR-rod larvae (i-i”) as well as in uninjured (j-j”) and Mtz-treated NTR-bipolar larvae (k-k”). (l,m) Quantification of PCNA+ cell counts at 9 dpf in (l) untreated NTR-rod fish or following the ablation of rods (m) and in untreated NTR-bipolar fish or following the ablation of bipolar cells. For both paradigms, quantification is split into total number of proliferative cells and those in the INL or ONL. For statistical comparisons, Student’s t test was used to assess the indicated paired conditions. Asterisks indicate the following p-value ranges: * = p<0.05, ** = p<0.01, *** = p<0.001, and **** = p<0.0001, “ns” indicates p>0.05.
Fig 2
Fig 2. Microarray data collection, DEG identification and top hits.
(a) Experimental design for tissue collection of whole eyes for microarray analysis. Treatment with Mtz for 24h was induced at 6 dpf following screening for NTR-rod+ or NTR-bipolar+ fish. Eyes were collected in triplicate at the following 12 timepoints including t0, t8, t16, 24, t32, t40, t48, t60, t72, t92, t144 and t240. (b) Venn diagram illustrating the total number of differentially expressed genes (DEGs) unique to either cell type or shared between the two at all timepoints. (c) Chart showing distribution of upregulated and downregulated DEGs in each paradigm. (d) Top 10 up and downregulated genes across the entire data set based on p-value as well as the number of timepoints that gene was identified as differentially expressed out of 12.
Fig 3
Fig 3. Identification of early and late DEG patterns and heatmaps for top DEGs in each.
(a) DEGs for each paradigm were split into upregulated (red) and downregulated (blue) as well as early (16-32h) and late (48-72h) based on peaks in Fig 2. The distribution of DEGs in these 8 patterns is shown in terms of unique and shared DEGs across both cell types. (b-h) The top 25 genes are plotted in heatmaps as a function of the largest fold changes at the middle timepoint in each pattern (24h and 60h) to demonstrate top genes defining each 8 patterns (NTR-rod and NTR-bipolar for patterns early-up, early-down, late-up and late-down).
Fig 4
Fig 4. Pathway analysis of early DEG pattern in both paradigms.
(a) Curve demonstrating expression pattern for early upregulated (red) and downregulated (blue) genes along our timepoints. (b-d) Top 10 enriched KEGG pathway terms including p-value and # of genes found as DEGs in the NTR-rod (b), NTR-bipolar (c) or from shared DEGs across both paradigms (d). (e-g) Top 10 enriched Gene Ontology pathway terms including fold enrichment and false discovery rate in the NTR-rod (e), NTR-bipolar (f) or from shared DEGs across both paradigms (g). (h-i) Unsupervised gene networks produced from ingenuity pathway analysis for DEGs in the NTR-rod (h) and NTR-bipolar (i) paradigm. Orange indicates upregulated gene/pathway term while blue indicates downregulated.
Fig 5
Fig 5. Pathway analysis of late DEG pattern in both paradigms.
(a) Graphic demonstrating expression pattern for late upregulated (red) and downregulated (blue) genes along our timepoints. (b-d) Top 10 enriched KEGG pathway terms including p-value and # of genes found as DEGs in the NTR-rod (b), NTR-bipolar (c) or from shared DEGs across both paradigms (d). (e-g) Top 10 enriched Gene Ontology pathway terms including fold enrichment and false discovery rate in the NTR-rod (e), NTR-bipolar (f) or from shared DEGs across both paradigms (g, only 7 terms enriched in this group). (h-i) Unsupervised gene networks produced from ingenuity pathway analysis for DEGs in the NTR-rod (h) and NTR-bipolar (i) paradigm. Orange indicates upregulated gene/pathway term while blue indicates downregulated.
Fig 6
Fig 6. Stat3 is required for rod photoreceptor regeneration.
(a) Experimental design depicting CRISPR/Cas9-based mutation (MUT) of stat3 in NTR-rod embryos. Control (+Mtz) and crispant NTR-rod larvae (+Mtz, stat3 MUT) were treated with 10mM Mtz from 5–6 dpf and rod fluorescence was assessed via plate reader assay at 7 dpf (to examine the extend of rod cell loss) and 9 dpf (to examine the extent of rod cell regeneration). Created with Biorender.com. (b) Relative stat3 mRNA expression (qRT-PCR assay) in non-injected controls compared to stat3 crispant fish. (c) Quantification of NTR-YFP expression in rod cells by plate reader assay at 7 dpf in non-ablated (-Mtz) wildtype, and ablated control (+Mtz) and stat3 MUT larvae (+Mtz, stat3 MUT). (d-e) Representative in vivo confocal images of regenerated rod cells at 9 dpf in control (+Mtz) and stat3 MUT larvae (+Mtz, stat3 MUT). (f) Quantification of rod cell regeneration by plate reader assay at 9 dpf in control (+Mtz) and stat3 MUT larvae (+Mtz, stat3 MUT). (g-h) Representative immunohistological staining for PCNA at 7 dpf in control (+Mtz) and stat3 MUT larvae (+Mtz, stat3 MUT) fish. (i) Quantification of INL, ONL, and total PCNA+ cells at 7 dpf in control (+Mtz) and stat3 MUT larvae (+Mtz, stat3 MUT). For statistical comparisons, Student’s t test was used to assess the indicated paired conditions. Asterisks indicate the following p-value ranges: * = p<0.05, ** = p<0.01, *** = p<0.001, and **** = p<0.0001, “ns” indicates p>0.05.
Fig 7
Fig 7. Rod cell regeneration is enhanced in txn, stat5a/b and c7b crispants.
(a) Experimental design depicting CRISPR/Cas9-based targeting of target genes via CRISPR/Cas9 in NTR-rod embryos. Control (+Mtz) and mutated NTR-rod larvae (+Mtz, gene target MUT) were treated with 10mM Mtz from 5–6 dpf and rod fluorescence was assessed via plate reader assay at 9 dpf (to examine the extent of rod cell regeneration). Created with Biorender.com. (b) Quantification of rod cell regeneration by plate reader assay at 9 dpf in Mtz-treated control and MUT larvae for target genes pparg, prdm1a, nfia, txn, stat5a/b and c7b. (c) Representative in vivo confocal images of regenerated rod cells at 9 dpf in control (+Mtz) and stat5a/b or c7b MUT larvae. For statistical comparisons, Welch’s one-way ANOVA was followed by student’s t test with Dunnett’s method for multiple comparisons correction. Asterisks indicate the following p-value ranges: * = p<0.05, ** = p<0.01, *** = p<0.001, and **** = p<0.0001, “ns” indicates p>0.05.

References

    1. Too LK, Simunovic MP. Retinal Stem/Progenitor Cells Derived From Adult Müller Glia for the Treatment of Retinal Degeneration. Front Cell Dev Biol 2021;9:749131; doi: 10.3389/fcell.2021.749131 - DOI - PMC - PubMed
    1. Lahne M, Nagashima M, Hyde DR, Hitchcock PF. Reprogramming Müller Glia to Regenerate Retinal Neurons. Annu Rev Vis Sci 2020;6:171–193; doi: 10.1146/annurev-vision-121219-081808 - DOI - PMC - PubMed
    1. Lenkowski JR, Raymond PA. Müller glia: Stem cells for generation and regeneration of retinal neurons in teleost fish. Prog Retin Eye Res 2014;40:94–123; doi: 10.1016/j.preteyeres.2013.12.007 - DOI - PMC - PubMed
    1. Ueki Y, Wilken MS, Cox KE, Chipman L, Jorstad N, Sternhagen K, et al. Transgenic expression of the proneural transcription factor Ascl1 in Müller glia stimulates retinal regeneration in young mice. Proc Natl Acad Sci U S A 2015;112(44):13717–13722; doi: 10.1073/pnas.1510595112 - DOI - PMC - PubMed
    1. Jorstad NL, Wilken MS, Grimes WN, Wohl SG, VandenBosch LS, Yoshimatsu T, et al. Stimulation of functional neuronal regeneration from Müller glia in adult mice. Nature 2017;548(7665):103–107; doi: 10.1038/nature23283 - DOI - PMC - PubMed

Publication types

LinkOut - more resources