Clinical Trial
. 2023 Dec 15;29(24):5079-5086.
doi: 10.1158/1078-0432.CCR-23-1807.

Phase II Trial of Nivolumab in Metastatic Rare Cancer with dMMR or MSI-H and Relation with Immune Phenotypic Analysis (the ROCK Trial)

Affiliations
Clinical Trial

Phase II Trial of Nivolumab in Metastatic Rare Cancer with dMMR or MSI-H and Relation with Immune Phenotypic Analysis (the ROCK Trial)

Hitomi S Okuma et al. Clin Cancer Res. .

Abstract

Purpose: Mismatch repair deficiency (dMMR)/microsatellite instability-high (MSI-H) are positive predictive markers for immune checkpoint inhibitors. However, data on the activity of nivolumab in advanced dMMR/MSI-H rare cancers and more accurate biomarkers are worth exploring.

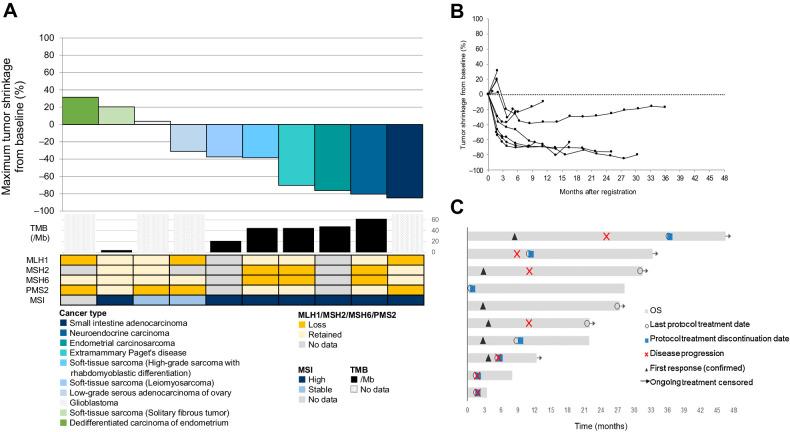
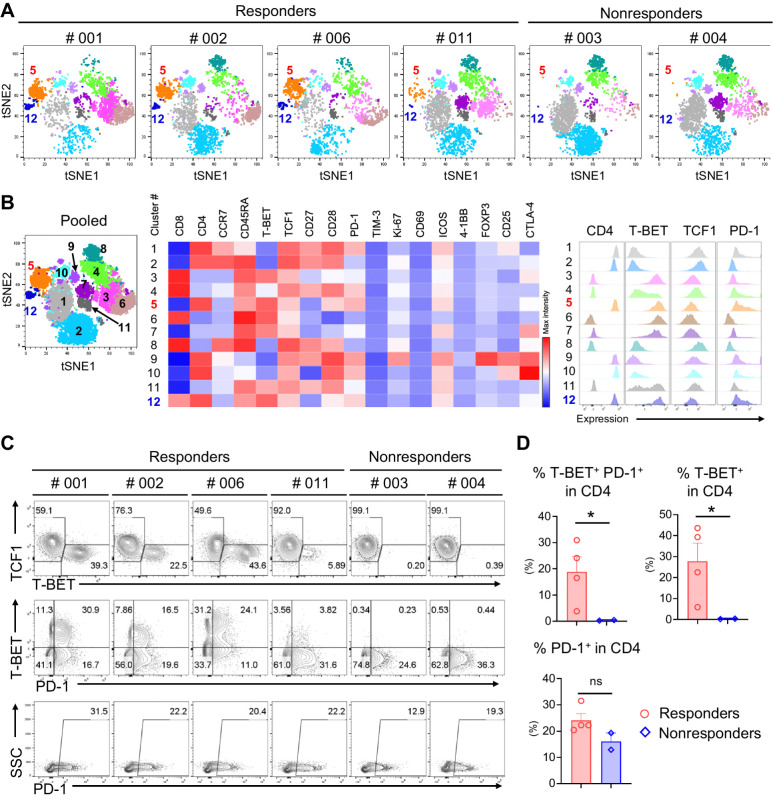
Patients and methods: We conducted a multicenter phase II, open-label, single-arm clinical trial to explore the effectiveness and safety of nivolumab monotherapy in patients with advanced rare cancers with dMMR/MSI-H, in parallel with immune phenotype analysis, to explore new biomarkers. A Bayesian adaptive design was applied. Characterization of peripheral blood mononuclear cells (PBMC) was characterized by multicolor flow cytometric analysis and CyTOF using samples collected before and after the intervention. The dMMR was identified by the complete loss of MLH1/MSH2/MSH6/PMS2.

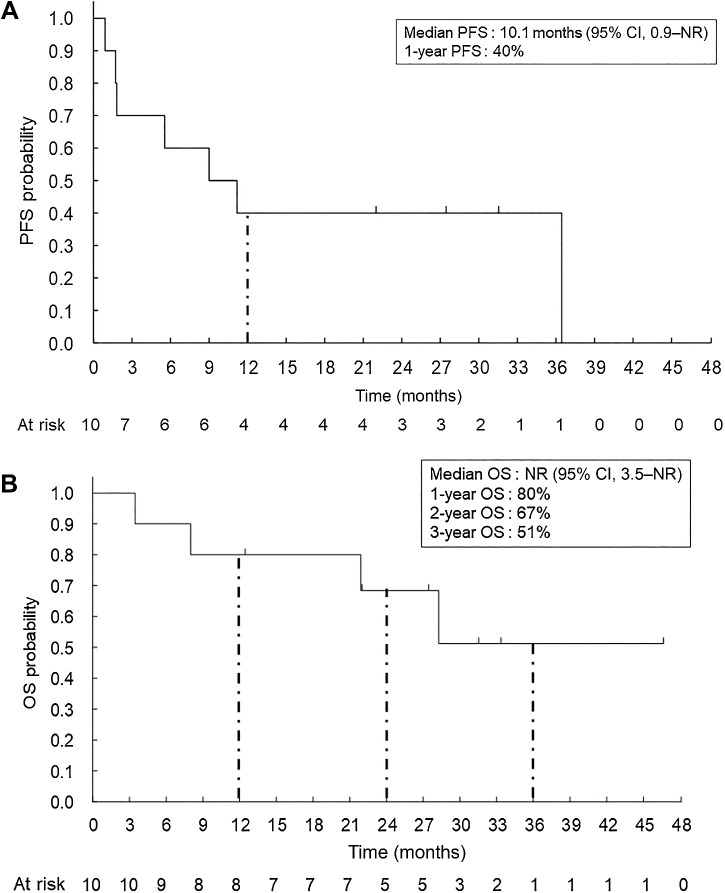
Results: From May 2018 to March 2021, 242 patients were screened, and 11 patients were enrolled, of whom 10 were included in the full analysis. Median follow-up was 24.7 months (interquartile range, 12.4-31.5). Objective response rate was 60% [95% confidence interval (CI), 26.2-87.8] by central assessment and 70% (95% CI, 34.8-93.3) by local investigators. Median progression-free survival was 10.1 months (95% CI, 0.9-11.1). No treatment-related adverse events of grade 3 or higher were observed. Patients with a tumor mutation burden of ≥10/Mb showed a 100% response rate (95% CI, 47.8-100). Responders had increased T-bet+ PD-1+ CD4+ T cells in PBMC compared with nonresponders (P < 0.05).

Conclusions: The trial met its primary endpoint with nivolumab, demonstrating clinical benefit in advanced dMMR/MSI-H rare solid cancers. Besides, the proportion of T-bet+ PD-1+ CD4+ T-cells may serve as a novel predictive biomarker.


Figures

Figure 1. A, Waterfall plot of tumor response, showing the best percentage change in target lesion size as assessed by an independent central review. Cancer types are represented by different colors. The waterfall plot below shows the tumor tissue TMB (mutations/Mb), tumor tissue dMMR status (protein expression of MLH1, MSH2, MSH6, and PMS2), and tumor tissue MSI status for each patient. Patients with no data for either TMB, MMR, or MSI are shown in gray (for MMR and MSI) or shaded gray (for TMB). For the patient who achieved CR, the target lesions were lymph nodes. Thus, although the sum of target lesions did not reach 0 mm, the ORR was determined as “CR”. B, Spider plot of tumor response, showing longitudinal changes in target lesion size from baseline, assessed by an independent central review. C, Swimmer's plot of tumor response, showing time to response and duration of response.
Figure 1.
A, Waterfall plot of tumor response, showing the best percentage change in target lesion size as assessed by an independent central review. Cancer types are represented by different colors. The waterfall plot below shows the tumor tissue TMB (mutations/Mb), tumor tissue dMMR status (protein expression of MLH1, MSH2, MSH6, and PMS2), and tumor tissue MSI status for each patient. Patients with no data for either TMB, MMR, or MSI are shown in gray (for MMR and MSI) or shaded gray (for TMB). For the patient who achieved CR, the target lesions were lymph nodes. Thus, although the sum of target lesions did not reach 0 mm, the ORR was determined as “CR”. B, Spider plot of tumor response, showing longitudinal changes in target lesion size from baseline, assessed by an independent central review. C, Swimmer's plot of tumor response, showing time to response and duration of response.
Figure 2. PFS and OS. Kaplan–Meier analysis for PFS (A) and OS (B) was performed according to the investigator assessments for the full analysis set (N = 10). One-year PFS rate is also shown. One-year OS, 2-year OS, and 3-year OS are also indicated.
Figure 2.
PFS and OS. Kaplan–Meier analysis for PFS (A) and OS (B) was performed according to the investigator assessments for the full analysis set (N = 10). One-year PFS rate is also shown. One-year OS, 2-year OS, and 3-year OS are also indicated.
Figure 3. Immune profiling of PBMCs from patients at the baseline. t-SNE plots based on the multicolor FCM analysis of PBMCs at the baseline showing distinctly isolated 12 clusters (A and B). Cluster #5 (CD4+ T-BET+ TCF1− PD-1+ as shown in the mid heat map and the right histograms of B) and Cluster #12 (CD4+ T-BET+ TCF1− PD-1++) were highly enriched among the responders. Flow plots showed enriched T-BET+ or T-BET+ PD-1+ cells among responders and complete lack of these populations among nonresponders (C and D, top). PD-1 expression alone did not predict the responses (C and D, bottom). *, P < 0.05; ns, not significant.
Figure 3.
Immune profiling of PBMCs from patients at the baseline. t-SNE plots based on the multicolor FCM analysis of PBMCs at the baseline showing distinctly isolated 12 clusters (A and B). Cluster #5 (CD4+ T-BET+ TCF1 PD-1+ as shown in the mid heat map and the right histograms of B) and Cluster #12 (CD4+ T-BET+ TCF1 PD-1++) were highly enriched among the responders. Flow plots showed enriched T-BET+ or T-BET+ PD-1+ cells among responders and complete lack of these populations among nonresponders (C and D, top). PD-1 expression alone did not predict the responses (C and D, bottom). *, P < 0.05; ns, not significant.

References

    1. Pakish JB, Zhang Q, Chen Z, Liang H, Chisholm GB, Yuan Y, et al. Immune microenvironment in microsatellite-instable endometrial cancers: hereditary or sporadic origin matters. Clin Cancer Res 2017;23:4473–81. - PMC - PubMed
    1. Le DT, Uram JN, Wang H, Bartlett BR, Kemberling H, Eyring AD, et al. PD-1 blockade in tumors with mismatch repair deficiency. N Engl J Med 2015;372:2509–20. - PMC - PubMed
    1. Howitt BE, Shukla SA, Sholl LM, Ritterhouse LL, Watkins JC, Rodig S, et al. Association of polymerase e-mutated and microsatellite-instable endometrial cancers with neoantigen load, number of tumor-infiltrating lymphocytes, and expression of PD-1 and PD-L1. JAMA Oncol 2015;1:1319–23. - PubMed
    1. Huang RSP, Haberberger J, Severson E, Duncan DL, Hemmerich A, Edgerly C, et al. A pan-cancer analysis of PD-L1 immunohistochemistry and gene amplification, tumor mutation burden, and microsatellite instability in 48,782 cases. Mod Pathol 2021;34:252–63. - PubMed
    1. Latham A, Srinivasan P, Kemel Y, Shia J, Bandlamudi C, Mandelker D, et al. Microsatellite instability is associated with the presence of lynch syndrome pan-cancer. J Clin Oncol 2019;37:286–95. - PMC - PubMed

Publication types

Supplementary concepts