. 2023 Oct 11;19(10):e1011000.
doi: 10.1371/journal.pgen.1011000. eCollection 2023 Oct.

AGAMOUS mediates timing of guard cell formation during gynoecium development

Affiliations

AGAMOUS mediates timing of guard cell formation during gynoecium development

Ailbhe J Brazel et al. PLoS Genet. .

Abstract

In Arabidopsis thaliana, stomata are composed of two guard cells that control the aperture of a central pore to facilitate gas exchange between the plant and its environment, which is particularly important during photosynthesis. Although leaves are the primary photosynthetic organs of flowering plants, floral organs are also photosynthetically active. In the Brassicaceae, evidence suggests that silique photosynthesis is important for optimal seed oil content. A group of transcription factors containing MADS DNA binding domains is necessary and sufficient to confer floral organ identity. Elegant models, such as the ABCE model of flower development and the floral quartet model, have been instrumental in describing the molecular mechanisms by which these floral organ identity proteins govern flower development. However, we lack a complete understanding of how the floral organ identity genes interact with the underlying leaf development program. Here, we show that the MADS domain transcription factor AGAMOUS (AG) represses stomatal development on the gynoecial valves, so that maturation of stomatal complexes coincides with fertilization. We present evidence that this regulation by AG is mediated by direct transcriptional repression of a master regulator of the stomatal lineage, MUTE, and show data that suggests this interaction is conserved among several members of the Brassicaceae. This work extends our understanding of the mechanisms underlying floral organ formation and provides a framework to decipher the mechanisms that control floral organ photosynthesis.


Conflict of interest statement

The authors do not have any competing interests.

Figures
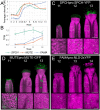
Fig 1
Fig 1. Expression of stomatal bHLH transcription factors during gynoecium development.
(A-B) Levels of SPCH, MUTE, and FAMA mRNAs at described stages of flower development in (A) whole flower buds [42] and (B) laser-microdissected gynoecia [43]. Error bars in (A-B) are s.e.m of three and four independent biological replicates, respectively. M, log-ratio of time-point to a common reference; TPM, transcripts per million. (C-E) Maximum intensity projections of stitched confocal laser scanning z-stacked micrographs of (C) SPCHpro:SPCH-YFP, (D) MUTEpro:MUTE-GFP, (E) FAMApro:NLS-2xYFP transgenes at different stages of gynoecium development as indicated. White boxes indicate areas that were magnified to produce the insets. Fluorescent protein is colored green and chlorophyll fluorescence is colored magenta. Scale bars for images of whole gynoecia are 100 μm. Scale bars for insets are 20 μm.
Fig 2
Fig 2. Progression of stomatal development on gynoecial and silique valves.
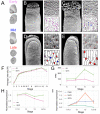
(A) Example stomatal lineage cells used to define early, mid, and late stages of stomatal development for morphological analysis (not to scale). Cells of the stomatal lineage are distinguished based on the presence of an asymmetric cell division and/or presumed early stage GMCs (Early stage), the rounding of a cell similar to a GMC (Mid stage), and the presence of a symmetric cleavage (Late stage). (B-E) Scanning electron micrographs of gynoecia at floral stage (B) 12, (C) 13, (D) 15–16 gynoecia and (E) a stage >17 silique with magnifications of the cell surface (from white box). Scale bars for images of whole gynoecia are 100 μm. Scale bars for magnifications are 20 μm. Purple, blue, and red highlights indicate early, mid, and late stage stomatal lineage morphology, respectively. (F-H) Levels of AG and SEP3 mRNAs over the course of (F) flower development determined by microarray analysis [42] and (G) gynoecium development determined by laser-capture microdissection combined with RNA-Seq [43] and (G) gynoecium development determined by RT-qPCR. (I) Levels of SPCH, MUTE, and FAMA mRNAs during gynoecium development determined by RT-qPCR. Error bars in (F-I) are s.e.m of (F-G) three and (H-I) four independent biological replicates, respectively. M, log-ratio of time-point to a reference; TPM, transcripts per million. Expression in (H-I) was normalized to the average of late stage 11/early stage 12 gynoecia time-point.
Fig 3
Fig 3. Transcriptional response of master regulators of stomatal development to repression of AG activity.
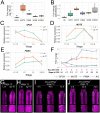
(A-B) Levels of mRNAs encoding stomatal bHLH transcription factor regulators, as determined by RT-qPCR, in (A) ag-10 stage 10–13 gynoecia relative to L-er stage 10–13 gynoecia, (B) dexamethasone-treated AG-amiRNAi (OPpro:AG-amiRNA/35Spro:GR-LhG4) in stage 10–13 gynoecia relative to mock-treated AG-amiRNAi in stage 10–13 gynoecia 24 h after treatments. Each dot in (A-B) represents the technical mean of an individual independent biological replicate. (C-E) Levels of (C) SPCH, (D) MUTE, and (E) FAMA mRNAs during gynoecium development as determined by RT-qPCR. Data for L-er is the same as in Fig 2I but was originally paired with the ag-10 experiments presented in this figure. Errors bars are s.e.m. of four independent biological replicates (F) Levels of SPCH, MUTE, FAMA, and AG mRNAs, as determined by RT-qPCR, in stage 13 gynoecia after treatment with dexamethasone relative to untreated (0 d) in stage 13 gynoecia. “Day after DEX” indicates the number of days that gynoecia were treated with DEX before being harvested at anthesis (stage 13), with “0 d” representing the untreated sample. “Stage at DEX” indicates the approximate stage of the flower/gynoecium when DEX treatment was applied. Error bars are s.e.m of three independent biological replicates. (G-J) Maximum intensity projections of stitched confocal laser scanning z-stack micrographs of (G, I) stage 12 and (H, J) stage 13 gynoecia from plants harboring a FAMApro:2xYFP transgene in (G-H) L-er and ag-10 backgrounds, and (I-J) the AG-amiRNAi (OPpro:AG-amiRNA/35Spro:GR-LhG4) background before treatment (0 h) and after dexamethasone treatment (48 h and 72 h). YFP is colored green and chlorophyll fluorescence is colored magenta. Scale bars for images of whole gynoecia are 100 μm. Scale bars for insets are 20 μm.
Fig 4
Fig 4. Interaction between AG, SHP1, SHP2, SEP3, and first intron of MUTE.
(A) Tracks indicating enrichment of sequences in the first intron of MUTE from two replicates of ChIP-Seq of AG-GFP (green tracks) and SEP3 (yellow tracks, combined results of two replicates), proteins in the floral induction system (FIS) [41,54]. Corresponding control ChIP-Seq experiments are colored in black. A schematic of the gene structure of MUTE blue is below (exon, rectangles; introns, lines). Two CArG motifs were identified within the first intron of MUTE (purple rectangles). (B) Binding logos from MEME and STREME analyses of 1421 binding sites identified in a ChIP-Seq of AG [41]. (C-F) Protein-DNA gel shift assays using combinations of AG, SEP3, SEP3ΔC, SHP1, and SHP2 recombinant protein and (C) a wild-type AtMUTE probe (AtMUTE_i1), (D) a probe where CArG_1 is mutated (mCArG_1), (E) a probe where CArG_2 is mutated (mCArG_2), and (F) a probe where both CArG motifs are mutated (mCArG_1+2). M, molecular weight marker. (G) An mVISTA alignment of the first intron of MUTE from various members of the Brassicaceae relative to A. thaliana. Regions highlighted in salmon have been designated as “Conserved Non-Coding Sequences” by mVISTA. Purple lines indicate the position of each CArG motif. (H-I) Protein-DNA gel shift assays using combinations of AG, SEP3, SEP3ΔC, SHP1, and SHP2 protein and (H) a wild-type CrMUTE probe (CrMUTE_i1) and (I) a wild-type EsMUTE probe (EsMUTE_i1). M, molecular weight marker. (J) Sequence alignments using some of the conserved region identified in (B) containing both CArG motifs. Asterisks indicate conserved nucleotide and the two CArG motifs are highlighted by purple rectangles. Unadjusted images for both replicates of the protein-DNA gel shift assays can be found in S10 Fig.
Fig 5
Fig 5. Stomatal development on gynoecial valves in response to reduced AG and SHP activity.
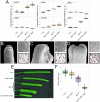
(A-F) Scanning electron micrographs of (A-C) stage 12 and (D-F) stage 13 L-er, ag-10, and ag-10 shp1 shp2 gynoecia, as indicated. Purple, blue, and red highlights indicate early, mid, and late-stage stomatal lineage morphology, respectively. (G-H) Scanning electron micrographs of a (G) ful-1 and (H) ag-10 ful-1 silique. Asterisks indicate presence of stomata. Scale bars for images of whole gynoecia are 100 μm. Scale bars for magnifications are 20 μm. (I-J) Index of early, mid, and late stomatal lineages based on morphological and cell size analysis of scanning electron micrographs from (I) stage 12 and (J) stage 13 L-er, shp1 shp2, ag-10, ag-10 shp1 shp2 gynoecia. Each dot represents an individual sample.
Fig 6
Fig 6. Redundancy between AG and SHP1/2 during gynoecium and silique development.
(A) Levels of MUTE, FAMA, ERL1, ERL2, STOM, and EPF1 mRNAs as determined by RT-qPCR, in L-er, shp1 shp2, ag-10, ag-10 shp1 shp2 stage 10–13 gynoecia relative to average of L-er samples. Each dot represents the technical mean of an individual independent biological replicate. (B-D) Scanning electron micrographs of mature siliques of (B) L-er, (C) ag-10, and (D) ag-10 shp1 shp2. Purple, blue, and red highlights indicate early, mid, and late-stage stomatal lineage morphology. Scale bars for images of whole gynoecia are 200 μm. Scale bars for magnifications are 20 μm. (E) Mature siliques of L-er, shp1 shp2, ag-10, ag-10 shp1 shp2. Scale is 1 mm. (F) Length of L-er, shp1 shp2, ag-10, ag-10 shp1 shp2 mature siliques.
Fig 7
Fig 7. Model describing regulation of MUTE expression before and after fertilization.
Before fertilization (i.e., before stage 13) a heterodimer of AGAMOUS (AG) and SEP3 (pink and green circles, respectively) are bound to the first intron of MUTE, which act to repress its transcription (roundhead line). At the same time, dimers of SPEECHLESS (SPCH, light orange circles) and SCREAM (SCRM)/SCRM2 (light blue circles) are likely bound to the promoter of MUTE. As AG and SEP3 protein levels (pink and green lines, respectively) decrease in the valve they reach a critical threshold (dotted line) where they no longer efficiently repress MUTE transcription. The absence of the AG-SEP3 dimer allows the SPCH-SCRM/2 complex to promote MUTE transcription (arrowhead). MUTE mRNA levels begin to increase (orange line) and after translation of the MUTE mRNA into protein (wavy orange line and circle, respectively), a complex of MUTE-SCRM/2 promotes the expression of FAMA so that mature stomatal complexes begin to form to coincide with fertilization (stage 13), represented by the stomatal index (SI, brown line). Activation of MUTE expression by SPCH has not been demonstrated, although SPCH binding to the MUTE promoter has been detected [61]. SPCH may promote the expression other genes whose products are responsible for directly promoting MUTE expression [61,62]. Gene bodies are depicted by solid black lines (up and downstream regions, introns) and yellow rectangles (exons). Cartoons of stomatal lineage and flower development stages are depicted below.

Similar articles

Cited by

References

    1. Smyth DR, Bowman JL, Meyerowitz EM. Early flower development in Arabidopsis. Plant Cell. 1990;2: 755–767. doi: 10.1105/tpc.2.8.755 - DOI - PMC - PubMed
    1. Pyke KA, Page AM. Plastid Ontogeny during Petal Development in Arabidopsis. Plant Physiology. 1998;116: 797–803. doi: 10.1104/pp.116.2.797 - DOI - PMC - PubMed
    1. Nadeau JA, Sack FD. Stomatal Development in Arabidopsis. The Arabidopsis Book. 2002;1: e0066. doi: 10.1199/tab.0066 - DOI - PMC - PubMed
    1. Alvarez J, Smyth DR. CRABS CLAW and SPATULA Genes Regulate Growth and Pattern Formation during Gynoecium Development in Arabidopsis thaliana. International Journal of Plant Sciences. 2002;163: 17–41. doi: 10.1086/324178 - DOI
    1. Geisler M, Yang M, Sack FD. Divergent regulation of stomatal initiation and patterning in organ and suborgan regions of the Arabidopsis mutants too many mouths and four lips. Planta. 1998;205: 522–530. doi: 10.1007/s004250050351 - DOI - PubMed

Publication types

MeSH terms