

Triglyceride content increases while cholesterol content decreases in HDL and LDL+IDL fractions following normal meals: The Copenhagen General Population Study of 25,656 individuals
- PMID: 37820443
- PMCID: PMC7615473
- DOI: 10.1016/j.atherosclerosis.2023.117316
Triglyceride content increases while cholesterol content decreases in HDL and LDL+IDL fractions following normal meals: The Copenhagen General Population Study of 25,656 individuals
Abstract
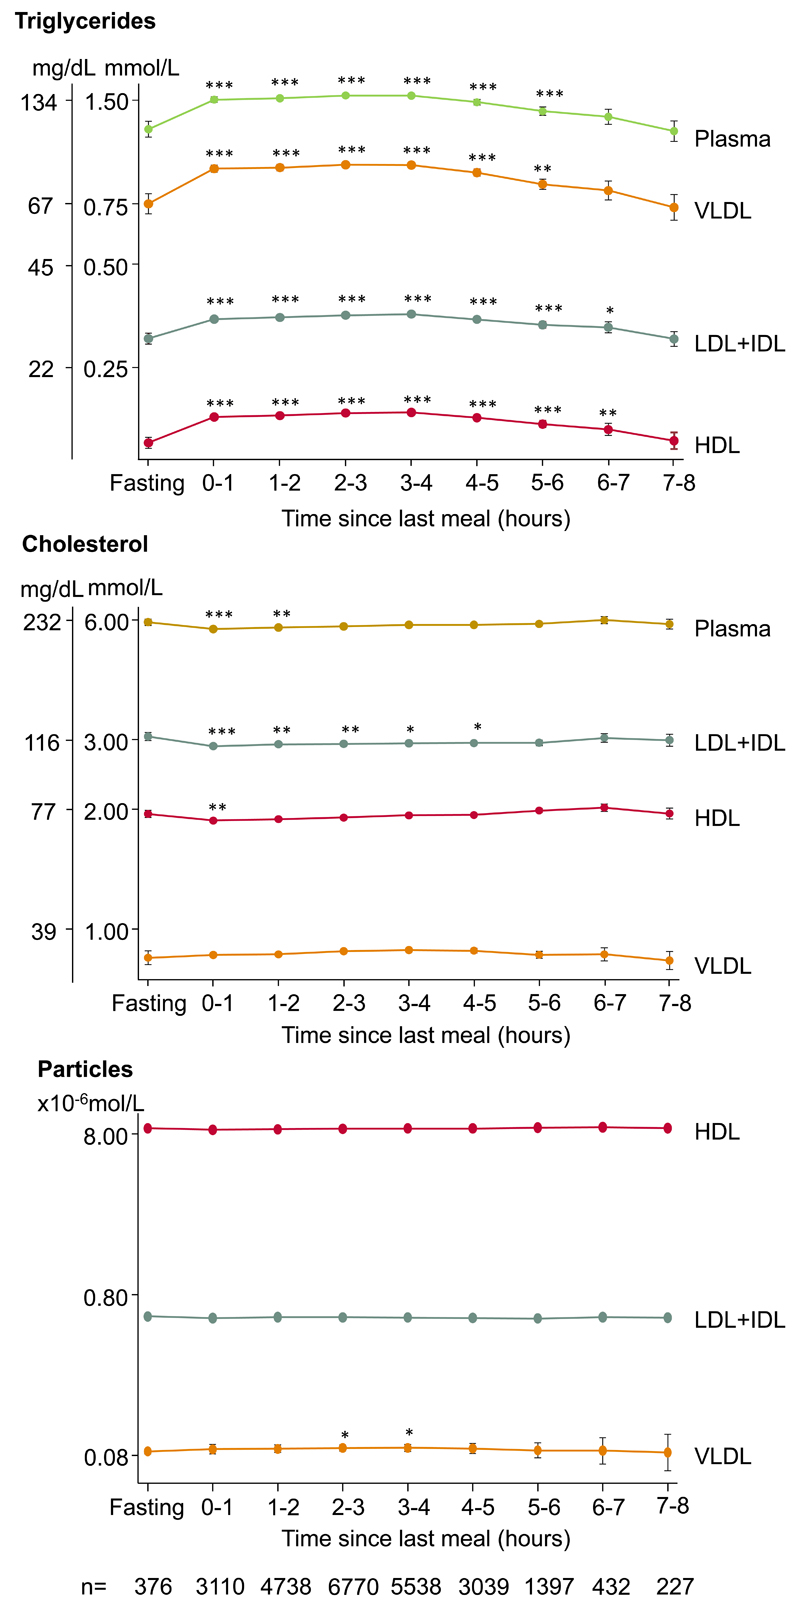
Background and aims: During fat tolerance tests, plasma triglycerides increase while high-density lipoprotein (HDL) cholesterol, low-density lipoprotein (LDL) cholesterol, and intermediate-density lipoprotein (IDL) cholesterol decrease. However, it is unknown whether triglyceride content increases and cholesterol content decreases in HDL and LDL + IDL fractions following normal meals in the general population. Therefore, we tested the hypothesis that triglyceride content increases while cholesterol content decreases in HDL and LDL + IDL fractions following normal meals.
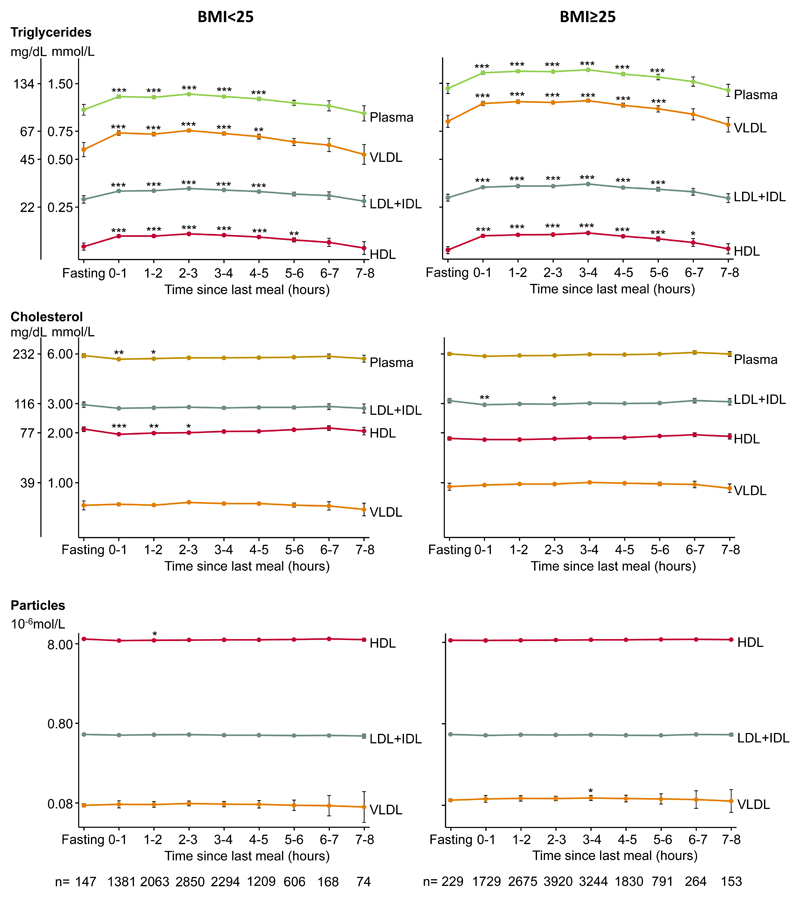
Methods: In this cross-sectional study, we included 25,656 individuals aged 20-100 years, all without lipid-lowering therapy at examination and selected for metabolomic profiling from the Copenhagen General Population Study. Triglyceride and cholesterol content of 14 lipoprotein fractions weas measured using nuclear magnetic resonance (NMR) spectroscopy. Time since last meal was recorded by the examiner immediately before blood sampling.
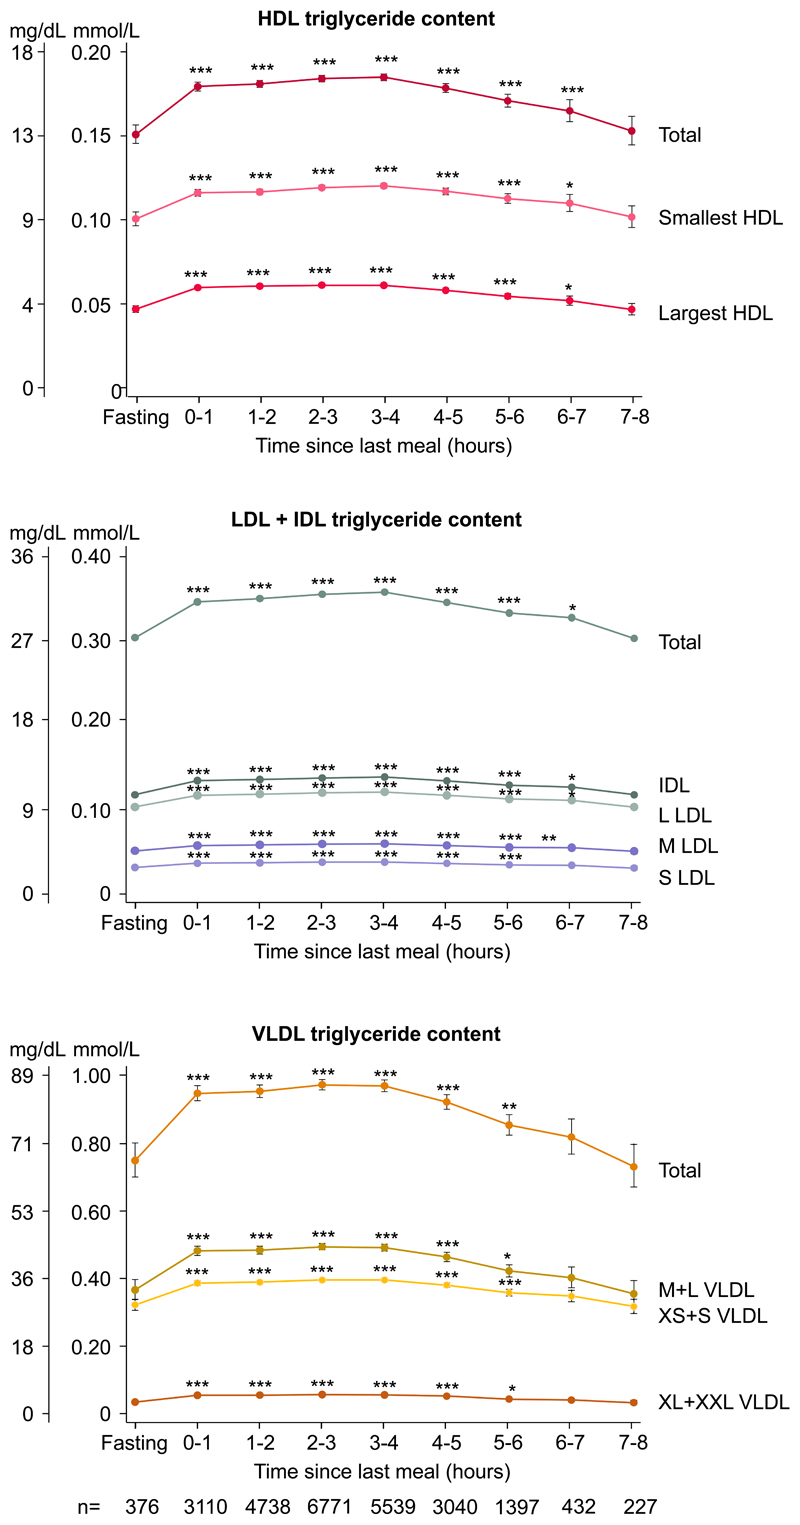
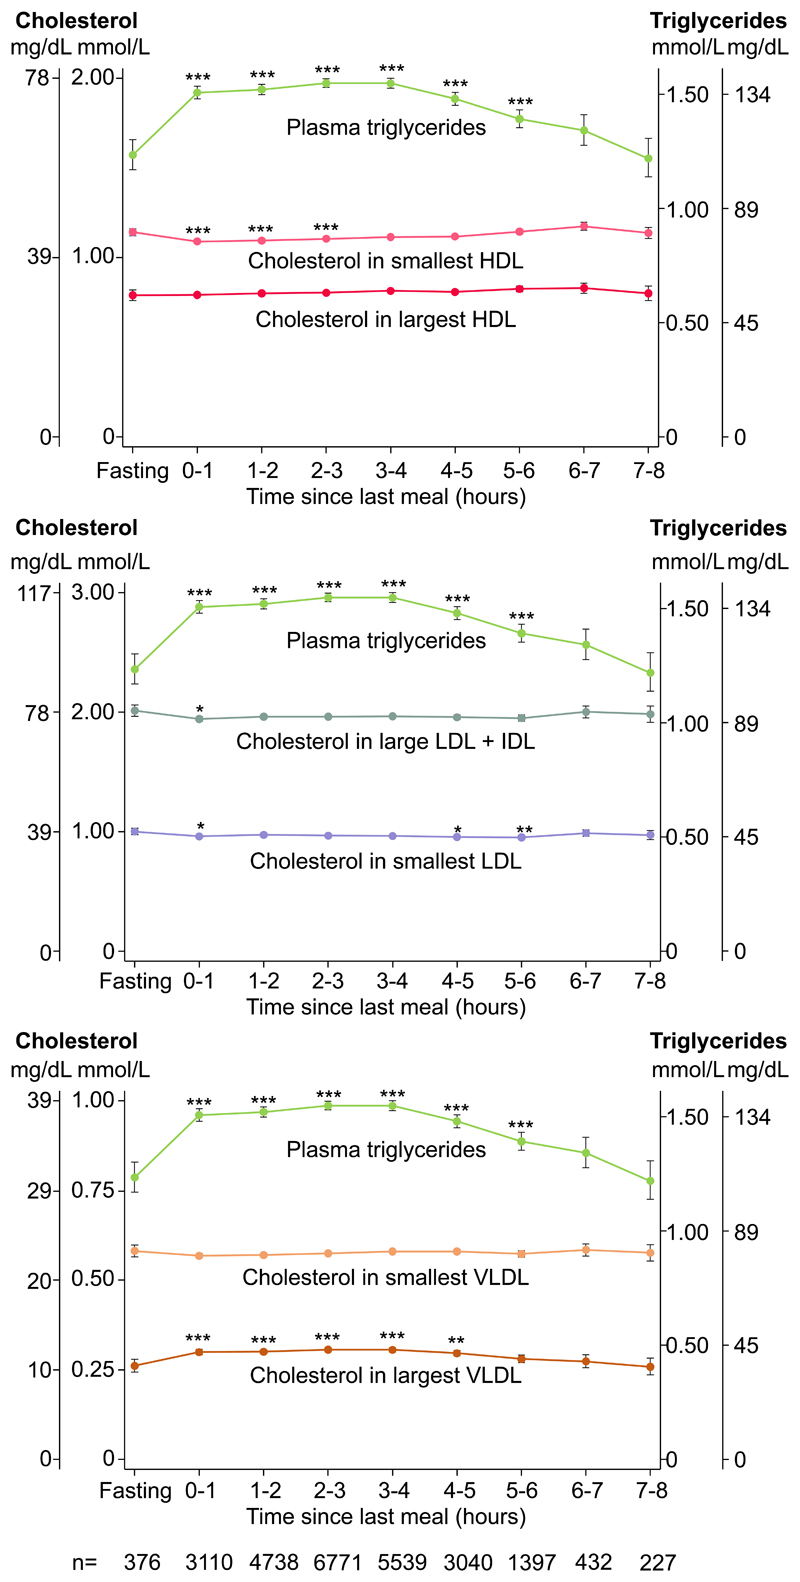
Results: Following normal meals in age and sex-adjusted analyses and when compared with fasting levels, plasma triglycerides were higher for up to 5-6 h, and triglyceride content was higher for up to 6-7 h in HDL fractions, for up to 6-7 h in LDL + IDL fractions, and for up to 5-6 h in very-low-density lipoprotein (VLDL) fractions. Further, plasma cholesterol was lower for up to 2-3 h, and cholesterol content was lower for up to 0-1 h in HDL fractions and for up to 4-5 h in LDL + IDL fractions, while cholesterol content was higher for up to 4-5 h in VLDL fractions.
Conclusions: Following normal meals, triglyceride content increases while cholesterol content decreases in HDL and LDL + IDL fractions.
Keywords: Apolipoproteins; Cardiovascular disease; General population; Lipids; Lipoprotein subfractions; Postprandial.
Copyright © 2023 The Authors. Published by Elsevier B.V. All rights reserved.
Conflict of interest statement
BGN report consultancies and talks sponsored by AstraZeneca, Sanofi, Regeneron, Akcea, Amgen, Kowa, Denka Seiken, Amarin, Novartis, Novo Nordisk, Esperion, Abbott, Ultragenix, and Silence Therapeutics. There are no financial or other conflicts of interest for MØJ, JMV, MB, or GDS.
Figures
Similar articles
-
Plasma lipoprotein subclass variation in middle-aged and older adults: Sex-stratified distributions and associations with health status and cardiometabolic risk factors.J Clin Lipidol. 2023 Sep-Oct;17(5):677-687. doi: 10.1016/j.jacl.2023.06.004. Epub 2023 Jul 1. J Clin Lipidol. 2023. PMID: 37442713
-
Role of hepatic lipase in intermediate-density lipoprotein and small, dense low-density lipoprotein formation in hemodialysis patients.Kidney Int Suppl. 1999 Jul;71:S227-8. doi: 10.1046/j.1523-1755.1999.07159.x. Kidney Int Suppl. 1999. PMID: 10412783
-
Lipoprotein subfraction changes in normal pregnancy: threshold effect of plasma triglyceride on appearance of small, dense low density lipoprotein.J Clin Endocrinol Metab. 1997 Aug;82(8):2483-91. doi: 10.1210/jcem.82.8.4126. J Clin Endocrinol Metab. 1997. PMID: 9253322
-
Atherogenic lipoproteins in end-stage renal disease.Am J Kidney Dis. 2001 Oct;38(4 Suppl 1):S30-3. doi: 10.1053/ajkd.2001.27393. Am J Kidney Dis. 2001. PMID: 11576918 Review.
-
Rationale for use of non-high-density lipoprotein cholesterol rather than low-density lipoprotein cholesterol as a tool for lipoprotein cholesterol screening and assessment of risk and therapy.Am J Cardiol. 1998 Feb 26;81(4A):26B-31B. doi: 10.1016/s0002-9149(98)00034-4. Am J Cardiol. 1998. PMID: 9526810 Review.
Cited by
-
Standardising lipid testing and reporting in the United Kingdom; a joint statement by HEART UK and The Association for Laboratory Medicine.Ann Clin Biochem. 2025 Jul;62(4):257-286. doi: 10.1177/00045632251315303. Epub 2025 Jan 31. Ann Clin Biochem. 2025. PMID: 39789723 Free PMC article. Review.
-
Acute Antiplatelet Effects of an Oleocanthal-Rich Olive Oil in Type II Diabetic Patients: A Postprandial Study.Int J Mol Sci. 2024 Jan 11;25(2):908. doi: 10.3390/ijms25020908. Int J Mol Sci. 2024. PMID: 38255980 Free PMC article. Clinical Trial.
-
Non-linear Mendelian randomization: detection of biases using negative controls with a focus on BMI, Vitamin D and LDL cholesterol.Eur J Epidemiol. 2024 May;39(5):451-465. doi: 10.1007/s10654-024-01113-9. Epub 2024 May 25. Eur J Epidemiol. 2024. PMID: 38789826 Free PMC article.
-
Curcumin-Based Fixed Dose Combination Products for Cholesterol Management: A Narrative Review.ACS Pharmacol Transl Sci. 2024 Jan 9;7(2):300-308. doi: 10.1021/acsptsci.3c00234. eCollection 2024 Feb 9. ACS Pharmacol Transl Sci. 2024. PMID: 38357288 Free PMC article. Review.
-
Longitudinal changes in remnant cholesterol and the risk of cardiovascular disease.Cardiovasc Diabetol. 2025 Jan 2;24(1):1. doi: 10.1186/s12933-024-02556-w. Cardiovasc Diabetol. 2025. PMID: 39748387 Free PMC article.
References
-
- Nordestgaard BG, Langsted A, Mora S, et al. Fasting is not routinely required for determination of a lipid profile: clinical and laboratory implications including flagging at desirable concentration cut-points-a joint consensus statement from the European Atherosclerosis Society and European Federation of Clinical Chemistry and Laboratory Medicine. Eur Heart J. 2016;37(25):1944–58. doi: 10.1093/eurheartj/ehw152. - DOI - PMC - PubMed
MeSH terms
Substances
Grants and funding
LinkOut - more resources
Full Text Sources
Medical
