. 2023 Dec 20;111(24):4024-4039.e7.
doi: 10.1016/j.neuron.2023.09.016. Epub 2023 Oct 10.

Adult-born granule cells facilitate remapping of spatial and non-spatial representations in the dentate gyrus

Affiliations

Adult-born granule cells facilitate remapping of spatial and non-spatial representations in the dentate gyrus

Sebnem N Tuncdemir et al. Neuron. .

Abstract

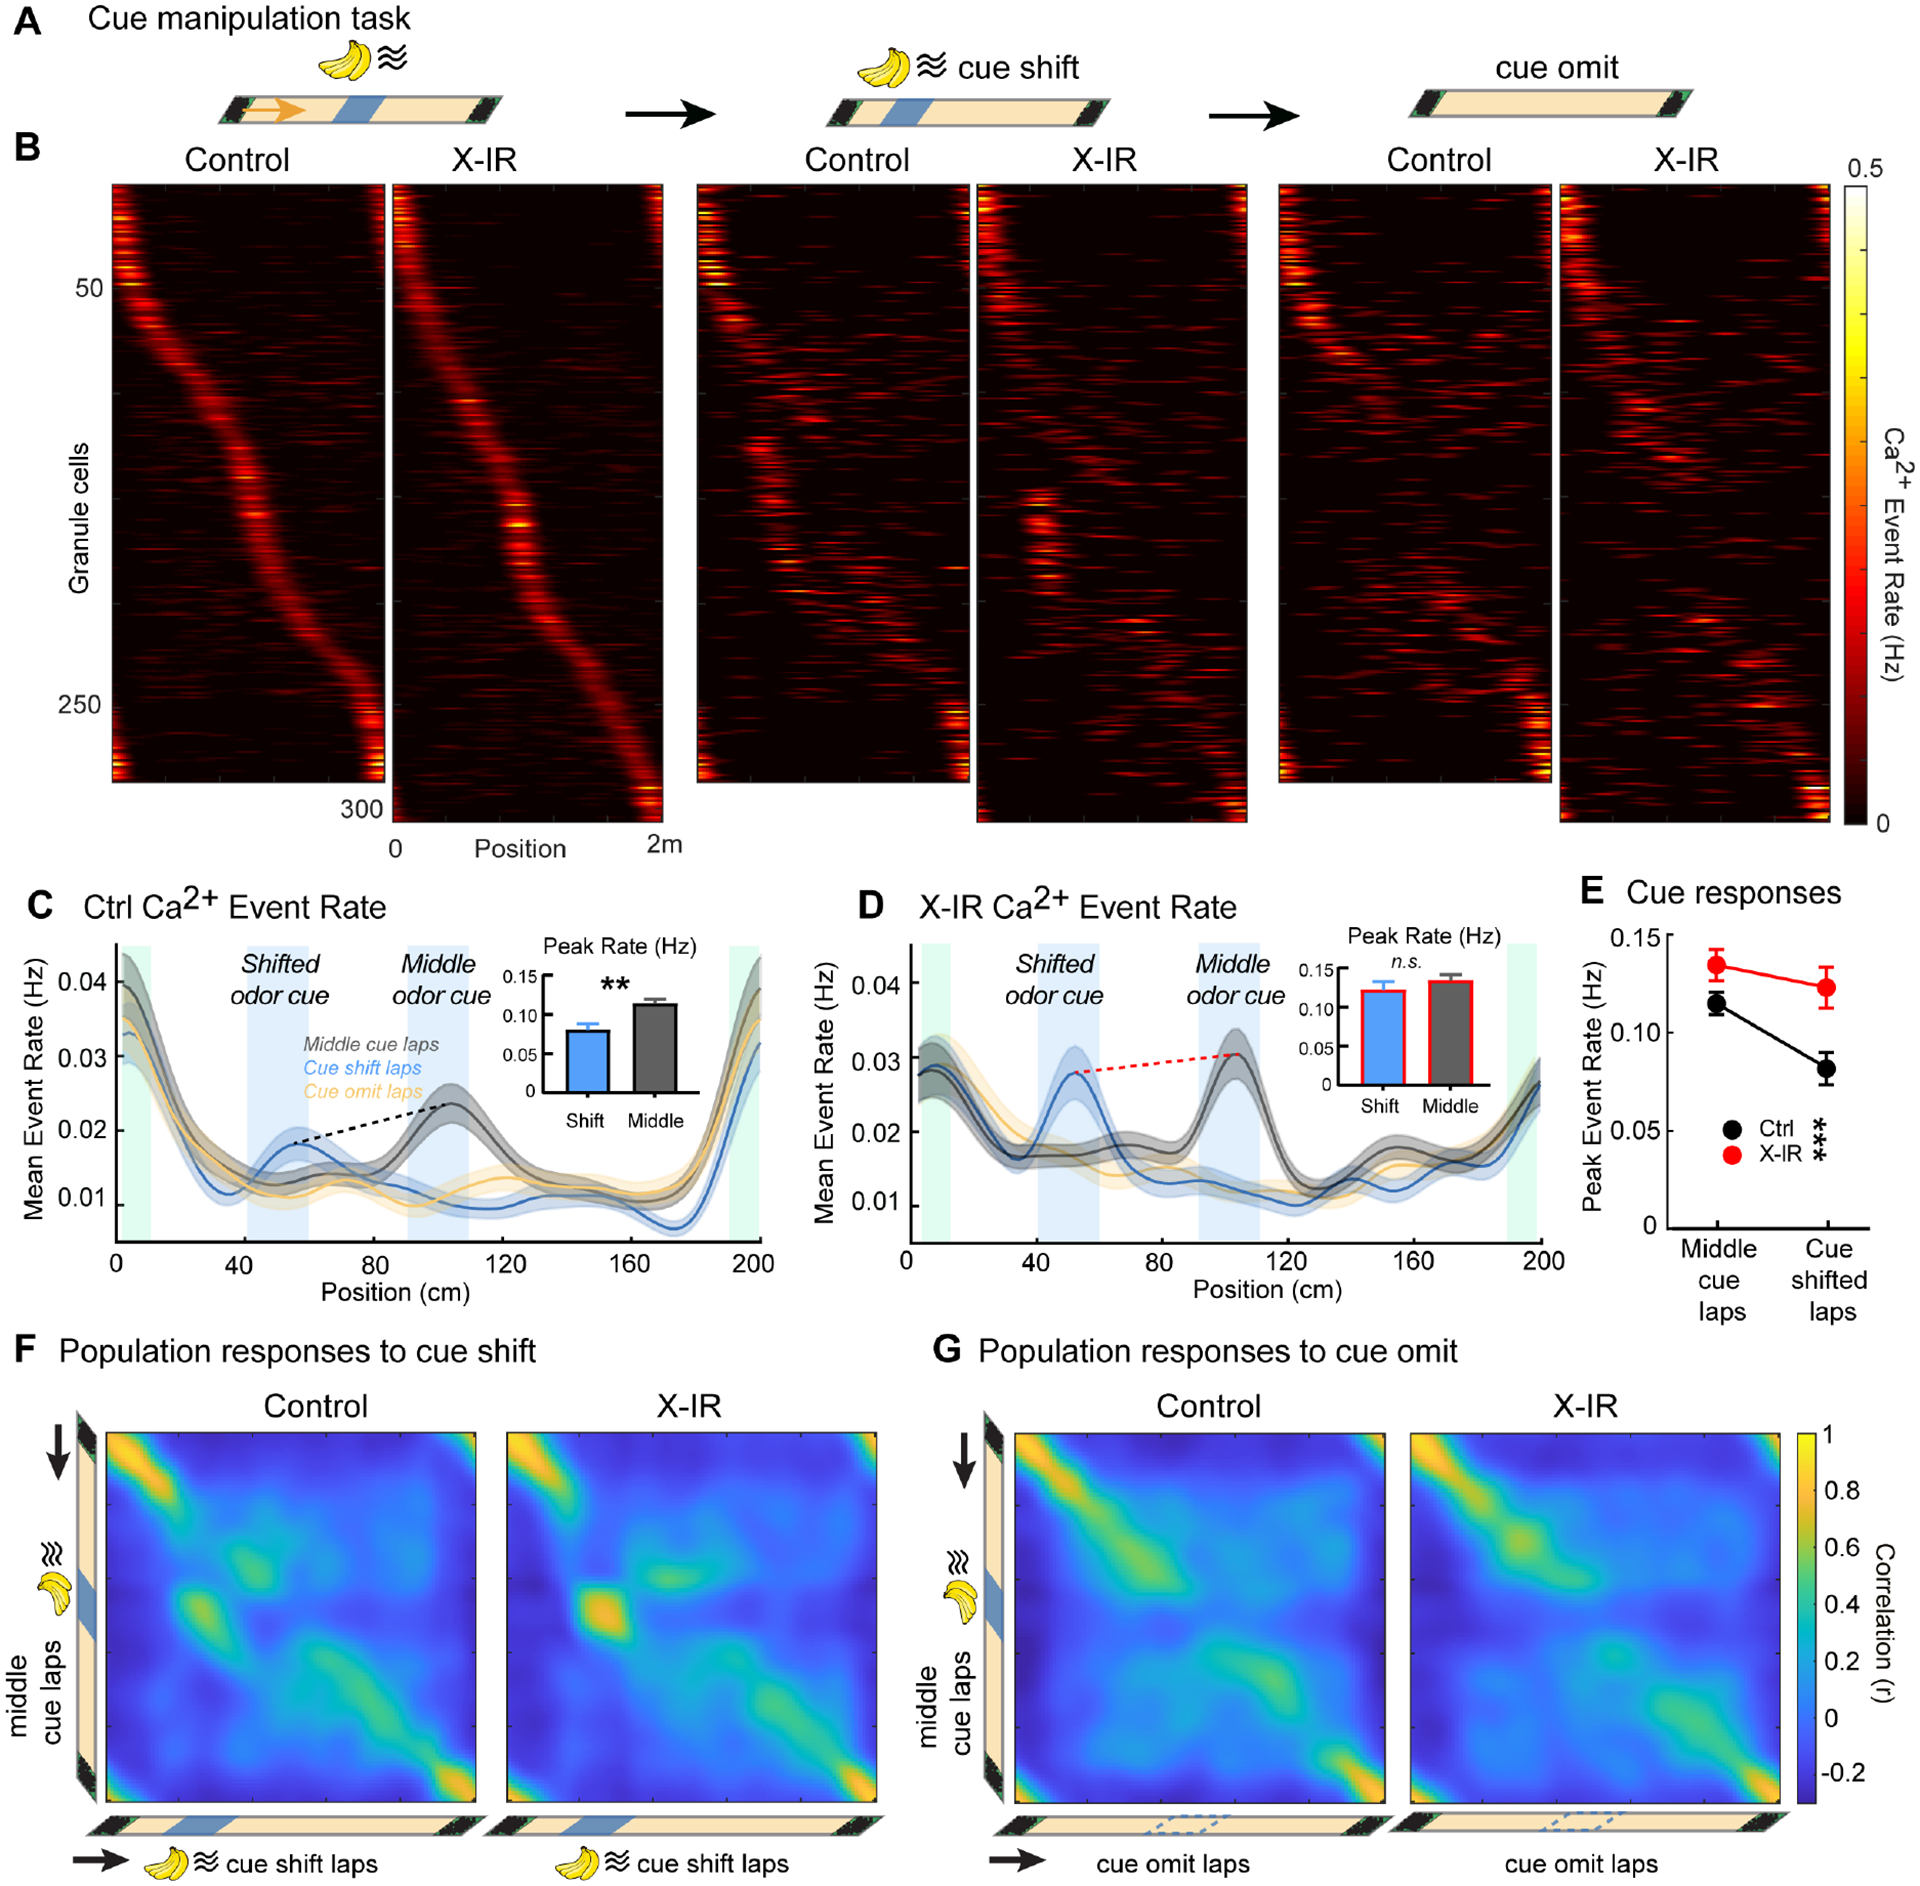
Adult-born granule cells (abGCs) have been implicated in memory discrimination through a neural computation known as pattern separation. Here, using in vivo Ca2+ imaging, we examined how chronic ablation or acute chemogenetic silencing of abGCs affects the activity of mature granule cells (mGCs). In both cases, we observed altered remapping of mGCs. Rather than broadly modulating the activity of all mGCs, abGCs promote the remapping of place cells' firing fields while increasing rate remapping of mGCs that represent sensory cues. In turn, these remapping deficits are associated with behavioral impairments in animals' ability to correctly identify new goal locations. Thus, abGCs facilitate pattern separation through the formation of non-overlapping representations for identical sensory cues encountered in different locations. In the absence of abGCs, the dentate gyrus shifts to a state that is dominated by cue information, a situation that is consistent with the overgeneralization often observed in anxiety or age-related disorders.

Keywords: adult neurogenesis; dentate gyrus; in vivo two-photon Ca(2+) imaging; pattern separation.


Conflict of interest statement

Declaration of interests The authors declare no competing interests.

Figures

Figure 1:
Figure 1:. Chronic ablation of neurogenesis impairs context discrimination in the dentate gyrus.
A) Experimental schematic (STAR Methods). B) Doublecortin expressing abGCs (red) in controls and X-IR mice. Blue is DAPI, scale bar = 100μm. C) Spatial firing rate maps of GCs in control mice in contexts A-A’-B, sorted based on maximum events rate in second exposure to context A (A’). Each row across all graphs represents a single cell matched across all contexts. NCtrl=380 cells, 9 mice. D) Spatial firing rate maps of GCs in X-IR mice, NX-IR= 285 cells, 8 mice. E) Top: Pearson’s correlations of rate maps in the same (A-A’) or different (A’-B) contexts Bottom: Bar plots: all neurons; circles: mouse. Interaction of Context vs Treatment F1,15 = 1.379, P=0.25; Same vs Diff. Context F1,15 = 68.98, ***P<0.0001; Ctrl vs X-IR F1,15 = 8.510, *P=0.0106; 2-way ANOVA mixed effects model. Planned comparison for same context: PCtrl – IR = 0.1955; different context: **PCtrl – IR =0.0092; Bonferroni’s test. F) i) Decoding of position in the same or different contexts from neural activity in A’. ii) Absolute median of the spatial decoder error. Control: W = 45, **PSame– Different= 0.0039; X-IR: W = 28, P Same Ctx – Different Ctx = 0.0604; Wilcoxon signed rank test. iii) Discrimination index, U=13, *PCtrl – IR = 0.0274, Mann-Whitney test. Control: 97.14 ± 13.86, X-IR: 93.57 ± 9.69 GCs. Error bars, ± sem. See also Figure S1.
Figure 2:
Figure 2:. Acute silencing of 4-week-old adult born granule cells impairs context discrimination in the dentate gyrus
A) Experimental schematic (STAR Methods). B) Genetically targeted abGCs (red) in the AAV injected hemisphere and contralateral hemisphere, for quantification see Figure S2B. Green is GCaMP, blue is DAPI, scale bar = 100μm. C) Spatial firing rate maps of GCs in DiF/F controls in contexts A-A’-B, sorted based on maximum events rate in context A’. Each row across all graphs represents a single cell matched across all contexts. NCre−=261 cells, 7 mice. D) Spatial firing patterns of GCs in AsclCreERDiF/F mice. NCre+= 275 cells, 6 mice. E) Top: Pearson’s correlations of rate maps between sequential exposures to the same (A-A’) or different (A’-B) contexts. Bar plots represent group data; circles represent per animal data. Interaction of Context vs Genotype F1,11 = 8.34, *P=0.0145; Context F1,11 = 113.6, ***P<0.0001; Genotype F1,11 = 2.945, P=0.11; 2-way ANOVA mixed effects model. Planned comparison for same context: Same context: PCrevs Cre+ > 0.99; Different context: *PCrevs Cre+ =0.023; Bonferroni’s test. F) i) Decoding position in the same (A) or different (B) contexts from neural activity in A’. ii) Absolute median spatial decoder error. DiF/F: W = 28, *PSame– Different = 0.0156; AsclCreER;DiF/F: W = 15, PSame– Different= 0.1563; Wilcoxon signed rank test. iii) Discrimination index, U=4, *PCre—Cre+ = 0.0140, Mann-Whitney test. DiF/F: 83.42 ± 5.89, AsclCreERDiF/F: 83 ± 8.68 GCs. Error bars, ± sem. See also Figure S2.
Figure 3:
Figure 3:. Adult born granule cells modulate stability of representations without changing global activity levels or spatial selectivity
A) Fraction of all active GCs and spatially tuned GCs in the imaging FOVs during context discrimination task. Active GCs: U=23, PCtrl—IR = 0.23, NCtrl= 166.22 ± 7.48, NX-IR: 144.54 ± 6.36, spatially tuned GCs: U=26, PCtrl—IR = 0.37, NCtrl= 40.92 ± 4.36, NX-IR: 30.04 ± 3.82, Mann-Whitney test. B) Spatial Ca2+ event rates during running bouts. Squares: mouse; circles: session averages of spatial firing rates. PCtrl—IR > 0.5, Mann-Whitney test. Inset: Distribution of event rates of all cells averaged across all sessions, PCtrl—IR =0.054, Two-sample Kolmogorov-Smirnov test. C) GCs averaged Ca2+ rates vs remapping index in control and X-IR mice within a sliding 25 percentile-wide window. Pearson’s RCtrl=0.1628, RIR=−0.1405, ***P= 0.000340, Fisher Z test. D) Fraction of active GCs and spatially tuned GCs in the FOVs during context A in baseline and CNO injected sessions. Active GCs: Interaction F1,11 = 0.49, P=0.48; CNO F1,11 = 0.38, P=0.54; Genotype F1,11 = 0.94, P=0.34; N-DiF/F: 141.76 ± 7.90, N-AsclCreER;DiF/F: 135.55 ± 6.35. Spatially tuned GCs: Interaction F1,11 = 1.06, P=0.31; CNO F1,11 = 3.43, P=0.078; Genotype F1,11 = 0.57, P=0.45; N-DiF/F: 45.52 ± 3.25, N-AsclCreER;DiF/F: 52 ± 7.87. 2-way ANOVA mixed effects model. E) Spatial Ca2+ event rates from during running bouts (squares: mouse; circles: session; darker shades: sessions with CNO injections). PCrev Cre+ > 0.05, Mann-Whitney test. Inset: distribution of event rates of all cells averaged across all sessions; dotted lines: baseline sessions PCrev Cre+ = 0.018; straight lines: CNO injected sessions PCrev Cre+ = 0.016. Two-sample Kolmogorov-Smirnov test. F) GCs’ CNO induced normalized rate differences vs. remapping index in DiF/F and AsclCreERDiF/F mice using a sliding 25 percentile-wide window averages of the differences. Pearson’s RCre−=0.0241, RCre+=−0.2744, ***P = 0.000928, Fisher Z test. Error bars and shaded area, ± sem. See also Figure S3.
Figure 4:
Figure 4:. Chronic ablation of neurogenesis reduces rate modulation of sensory cue responses
A) Experimental schematic (top). GC activity during the spatial cue task in control and X-IR mice (bottom). B) Lap-averaged spatial firing rates of spatially tuned neurons from controls and X-IR mice with the odor cue on normal middle location (left), cue-shifted (middle) and cue-omitted (right) laps. Each row represents activity of a single cell across lap types, sorted by activity on normal middle cue laps. NCtrl=285 cells, 8 mice; NIR= 327 cells, 6 mice. C) Average spatial firing rates by position for neurons in control mice shown in panel “B” on normal (gray), cue-shifted (blue) and cue-omitted laps (yellow). (Inset) Averaged peak firing rate (Hz) of cue cells on laps in which the cue is shifted to the 50cm location and during normal middle (100cm) cue laps. W = −6371, **PCtrl – IR = 0.002. D) Average spatial firing rates by position for neurons in X-IR mice shown in panel “B” on normal (gray), cue-shifted (blue) and cue-omitted laps (yellow). Inset as in C. W = −6044, PCtrl – IR = 0.0534, C-D, Wilcoxon signed rank test. E) Quantification of peak firing of the cells responding to shifting of the odor cue in X-IR mice compared to controls. Interaction F1,312 = 0.18, P=0.18; Lap type F1,312 = 7.307, P=0.0072; Treatment F1,312 = 13.6, ***P=0.0003; 2-way ANOVA. Planned comparisons: Middle cue laps: PCtrlIR = 0.1177; Cue shift laps: **PCtrl – IR =0.0026; Tukey’s post hoc test. Control: NOdorCueCells= 78, X-IR NOdorCueCells= 80, Error bars, ± sem. F) PV correlations of GCs at each treadmill position of cue-shifted (x-axis) and normal middle cue laps (y-axis) in control (left) and X-IR (right) mice. G) PV correlations of cue-omitted laps (x-axis) and normal middle cue laps (y-axis) in control (left) and X-IR (right) mice. See also Figure S4.
Figure 5:
Figure 5:. Chronic ablation of neurogenesis increases long-term stability of place cells and decreases rate modulation of cue cells
A) Top: Experimental schematic of imaging GC activity within a day and over one week during the spatial cue task in control and X-IR mice. Bottom: Spatial firing rates for spatially tuned neurons tracked during subsequent sessions on the same day or one week later, sorted by the peak activity on first session of Day1. NCtrl=144 cells, 5 mice; bottom, NIR= 106 cells, 4 mice. B) i) Position decoded on the same day (Day1’) or one week later (Day7) from neural activity in the first session of Day 1. NCtrl= 84.4 ± 10.5; NIR= 78.2 ± 7.2 GCs. ii) Absolute median spatial decoder error. W = −15, *PCtrl-Day – Ctrl-Week = 0.0313, W = −4, PIR-Day – IR-Week = 0.625, Wilcoxon signed rank test. iii) Stability index, U = 0, *PCtrl-IR = 0.0159, Mann-Whitney test. C) Mean spatial firing rate correlations within the same day and 1 week later for odor-cue cells and place cells in controls and X-IR mice. Interaction F3,344 = 2.73, *P = 0.043; Cell type F3,344 = 19.37, ***P<0.001; Treatment F1,344 = 8.82, **P = 0.0032; 2-way ANOVA. Day1–1’: PCtrl-Cue – IR-Cue = 0.99; PCtrl-Place – IR-Place > 0.99; Day1–7: PCtrl-Cue – IR-Cue = 0.86; **PCtrl-Place – IR-Place = 0.0016; ***PCtrl-Cue – Ctrl-Place = 0.0002; PIR-Cue – IR-Place = 0.41; Tukey’s post hoc test. NCtrl-Cue=39, NCtrl-Place=65, 5 mice, NIR-Cue=29, NIR-Place=47 cells, 4 mice. D) PV correlations in controls (top) and X-IR (bottom) mice, of cue-shifted laps (x-axis) and normal middle cue laps (y-axis) for GCs that are cross-registered between days 1–1’−7. E) Temporal rate modulation of cue cells. Interaction F2,186 = 0.65, P = 0.52; Day F2,186 = 3.95, *P=0.021; Treatment F1,186 = 14.06, **P = 0.0002; 2-way ANOVA. Planned comparisons: Ctrl: *PDay1 – Day7 = 0.032; IR: PDay1 – Day7 = 0.93, Tukey’s post hoc test. NCtrl-Cue=39, NIR-Cue=29 cells. Error bars, ± sem.
Figure 6.
Figure 6.. Behavioral impact of impaired mGC remapping in the absence of abGCs.
A) Experimental schematic of the goal-oriented learning task. B) Averaged lick rate by position histograms. NCtrl=9, NX-IR=6 mice (Scale bar=1 lick/sec). C) Lick rates within the anticipatory zone (yellow bands in panel A) in control and X-IR mice. Interaction of Session vs Treatment F2,26 = 5.044, *P = 0.014; Session F1.46,19.02 = 8.54, **P=0.0044; Treatment F1,13 0.03, P = 0.84. Reversal session, PCtrl – IR =0.238. D) Lick rates within the reward zone (blue bands in panel A). Interaction of Session vs Treatment F2,26 = 3.62, *P = 0.0411; Session F1.99,25.94 = 4.16, *P=0.0272; Treatment F1,13=1.26, P = 0.282; Reversal, PCtrl – IR =0.069. E) Total number of licks normalized to number of laps. Interaction of Session vs Treatment F2,26 = 0.123, P = 0.88; Session F1.63,21.31 = 0.68, P=0.48; Treatment F1,13=0.26, P = 0.61. C-E: 2-way ANOVA mixed effects model, Bonferroni’s multiple comparisons test. F) GC activity during the goal-oriented learning task in control and X-IR mice. G) Averaged spatial firing rates by position for GCs in control and X-IR mice shown in panel “F” on reward reversal session 3. Blue shaded area: new reward location. Blue line: *PCtrl-IR < 0.05. H) PV correlations of GCs between the 2nd and reversal session in control and X-IR mice shown in panel F. Blue shaded areas indicate the new (left) and the old (right) reward locations. Blue lines: PCtrl-XIR < 0.05. G,H : Mann-Whitney test for each 2cm bin between groups. Error bars, ± sem. I) For each mouse, GCs mean PV correlations within the anticipatory zone is plotted against the anticipatory lick rates in control and X-IR mice. Pearson’s RCtrl=−0.7970, PCtrl=0.0101, RX-IR=0.5428, PX-IR=0.2657, *PCtrl-IR = 0.0163, Fisher Z test. See also Figure S5.

References

    1. Ge S, Yang C-H, Hsu K-S, Ming G-L, and Song H (2007). A critical period for enhanced synaptic plasticity in newly generated neurons of the adult brain. Neuron 54, 559–566. 10.1016/j.neuron.2007.05.002. - DOI - PMC - PubMed
    1. Marín-Burgin A, Mongiat LA, Pardi MB, and Schinder AF (2012). Unique processing during a period of high excitation/inhibition balance in adult-born neurons. Science 335, 1238–1242. 10.1126/science.1214956. - DOI - PMC - PubMed
    1. Schmidt-Hieber C, Jonas P, and Bischofberger J (2004). Enhanced synaptic plasticity in newly generated granule cells of the adult hippocampus. Nature 429, 184–187. 10.1038/nature02553. - DOI - PubMed
    1. Snyder JS, Kee N, and Wojtowicz JM (2001). Effects of adult neurogenesis on synaptic plasticity in the rat dentate gyrus. J. Neurophysiol 85, 2423–2431. 10.1152/jn.2001.85.6.2423. - DOI - PubMed
    1. Sahay A, Scobie KN, Hill AS, O’Carroll CM, Kheirbek MA, Burghardt NS, Fenton AA, Dranovsky A, and Hen R (2011). Increasing adult hippocampal neurogenesis is sufficient to improve pattern separation. Nature 472, 466–470. 10.1038/nature09817. - DOI - PMC - PubMed

LinkOut - more resources