. 2023 Dec;10(34):e2304895.
doi: 10.1002/advs.202304895. Epub 2023 Oct 11.

m6A-Modified circTET2 Interacting with HNRNPC Regulates Fatty Acid Oxidation to Promote the Proliferation of Chronic Lymphocytic Leukemia

Affiliations

m6A-Modified circTET2 Interacting with HNRNPC Regulates Fatty Acid Oxidation to Promote the Proliferation of Chronic Lymphocytic Leukemia

Zijuan Wu et al. Adv Sci (Weinh). 2023 Dec.

Abstract

Chronic lymphocytic leukemia (CLL) is a hematological malignancy with high metabolic heterogeneity. N6-methyladenosine (m6A) modification plays an important role in metabolism through regulating circular RNAs (circRNAs). However, the underlying mechanism is not yet fully understood in CLL. Herein, an m6A scoring system and an m6A-related circRNA prognostic signature are established, and circTET2 as a potential prognostic biomarker for CLL is identified. The level of m6A modification is found to affect the transport of circTET2 out of the nucleus. By interacting with the RNA-binding protein (RBP) heterogeneous nuclear ribonucleoprotein C (HNRNPC), circTET2 regulates the stability of CPT1A and participates in the lipid metabolism and proliferation of CLL cells through mTORC1 signaling pathway. The mTOR inhibitor dactolisib and FAO inhibitor perhexiline exert a synergistic effect on CLL cells. In addition, the biogenesis of circTET2 can be affected by the splicing process and the RBPs RBMX and YTHDC1. CP028, a splicing inhibitor, modulates the expression of circTET2 and shows pronounced inhibitory effects. In summary, circTET2 plays an important role in the modulation of lipid metabolism and cell proliferation in CLL. This study demonstrates the clinical value of circTET2 as a prognostic indicator as well as provides novel insights in targeting treatment for CLL.

Keywords: HNRNPC; N6-methyladenosine (m6A); chronic lymphocytic leukemia; circTET2; circular RNA; fatty acid oxidation; proliferation.


Conflict of interest statement

The authors declare no conflict of interest.

Figures
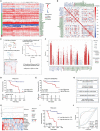
Figure 1
Figure 1
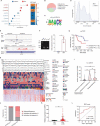
m6A modification in CLL and a risk model presented for m6A‐related circRNAs. A) The expression patterns of m6A regulators in CLL patients (n = 53). B) Correlations among the m6A genes. *p < 0.05, **p < 0.01, ***p < 0.001. C). Workflow of the m6Sig score construction. D) Kaplan‐Meier curves for patients with high and low m6Sig scores (n = 53). E. Survival analysis of m6Sig score in the collected independent CLL cohort (GSE22762, n = 107). F) m6A regulators and related circRNAs. G)Workflow for the construction of our risk model of m6A‐related circRNAs. H) Upper panel, distribution of samples in the high‐ and low‐risk score groups; middle panel, OS of each sample; lower panel, the expression pattern of eight prognostic signatures in the two groups. I) Kaplan–Meier curve of the OS of patients in the high‐ and low‐risk score groups. J) ROC curve analysis of the risk score model (n = 53).
Figure 2
Figure 2
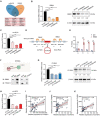
m6A‐modified circTET2 is up‐regulated in CLL and related to the prognosis of patients. A) Left, individual risk score of the eight circRNAs in the risk model. Right, m6A levels of the eight circRNAs as predicted by circBank. B) The distribution of m6A peaks. C) Predominant consensus motifs identified with m6A‐seq peaks. D) Density of m6A methylation peaks in circRNAs. E. m6A peak via meRIP‐seq on TET2 exon 3 as visualized by IGV. F) Methylated RNA in cells was immunoprecipitated with an m6A antibody, followed by qPCR analyses with primers against circTET2. Error bars represent the means±SD derived from three independent experiments. Statistical analyses were performed using a two‐tailed Student's t‐test, **p < 0.01. G) Kaplan–Meier curves for high and low circTET2 levels (n = 53). H) Clinical characteristics of the enrolled CLL patients (n = 53); the lower heatmap comprised genes that correlated with circTET2. I)The expression levels of circTET2 in CLL patients with different statuses. No indication for treatment (n = 40), Indication of treatment (n = 16), Relapsed/Refractory (n = 13). J) Proportion of patients with different statuses in high and low circTET2 expression groups. K) The expression levels of circTET2 in CLL patients (n = 25) and CD19+ B cells from healthy volunteers (n = 69). L) ROC curve analysis showed the diagnostic value of circTET2 in CLL.
Figure 3
Figure 3
Characterization of circTET2 in CLL. A) The genomic loci of TET2 and the “head‐to‐tail” splicing of circTET2 from exon 3 verified by Sanger sequencing following PCR. B. Northern blot using a junction‐specific DIG‐labeled probe shows the endogenous existence of circTET2 in MEC‐1 and JVM‐3 cells. The expression levels of the linear and circular form of TET2 with the treatment of RNase R as detected by qRT‐PCR (C) and agarose gel electrophoretic assays (D). E) The abundances of circTET2 and linear TET2 with actinomycin D treatment in MEC‐1 cells. F) Nucleocytoplasmic separation assays detected the distribution of circTET2 in MEC‐1 cells. G) FISH assay shows the location of circTET2 in MEC‐1 cells. Scale bar, Upper: 50 µm, Lower: 10 µm. H) Determination of m6A abundance in MEC‐1 cells upon FB23‐2 treatment for 72 h via dot blot assay. Methylene Blue (MB) represents the loading control of RNA samples. I) The change in circTET2 levels in MEC‐1 cells treated with FB23‐2. J) IF staining images of circTET2 in MEC‐1 cells treated with or without FB23‐2. Scale bar, 50 µm. K, L) Colocalization analysis of circTET2 and DAPI with Image (J) software. Error bars represent the means±SD derived from three independent experiments. ***p < 0.001.
Figure 4
Figure 4
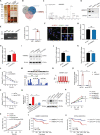
RBMX and YTHDC1 regulate the biogenesis of circTET2. A) Predicted RBPs bind to the flanking introns of circTET2 predicted by catRAPID (http://s.tartaglialab.com/page/catrapid_group) and RBPBD (http://rbpdb.ccbr.utoronto.ca/). B) Knockdown efficiency of RBMX detected by qRT‐PCR and western blot assays. C) The change in circTET2 levels. D,E) Binding sites for RBMX on the flanking introns predicted by catRAPID (http://s.tartaglialab.com/page/catrapid_group) (D) and validated by RIP‐qPCR (E). F) Co‐IP was adopted to detect the protein–protein interactions between RBMX and YTHDC1. G) Knockdown efficiency of YTHDC1 as determined with qRT‐PCR and western blot assays. H) The change in circTET2 levels. I) Correlations between RBMX and YTHDC1 expression in CLL patients as analyzed by Pearson analysis (n = 44). J) Correlations between circTET2 and RBMX expression (n = 44). K)Correlations between circTET2 and YTHDC1 expression (n = 44). Data represent the mean ± SD. ns, not significant, *p < 0.05, **p < 0.01, ***p < 0.001.
Figure 5
Figure 5
CircTET2 promotes cell proliferation and is involved in regulating the mTORC1‐signaling pathway and FAO. A–C)Gene set enrichment analysis (GSEA) shows the signaling pathways enriched in genes that are positively related to circTET2. NES, normalized enrichment score. D) Knockdown and overexpression efficiency of circTET2. E,F)CCK8 assay shows the proliferative viability of cells with different circTET2 levels. G) Protein levels determined in cells with reduced or increased circTET2 levels. H,I) Oxygen consumption rate (OCR) as detected by seahorse assays. J) ATP levels of cells with different expression levels of circTET2. K,L) CCK8 shows the viability of cells treated with perhexiline for different time periods and for circTET2 overexpressing and knockdown cells treated with perhexiline for 24 h. Data represent the mean ± SD from three independent experiments. *p < 0.05, **p < 0.01, ***p < 0.001.
Figure 6
Figure 6
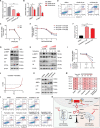
The circTET2 and HNRNPC complex interact and stabilize CPT1A mRNA. A) Silver stain shows the proteins pulled down by the circTET2 probe. B) The Venn diagram shows the potential RBPs that bind to circTET2. C) Peak map of HNRNPC acquired from the RNA pulldown mass spectrometry assay. D) Protein pulled down by circTET2 probe with HNRNPC antibody was detected by western blotting. E) RIP assay shows the interaction between HNRNPC and circTET2. F) FISH‐IF assay shows the co‐localization of circTET2 and HNRNPC (scale bar, 20 µm). G) The change in circTET2 levels after HNRNPC knockdown. H) HNRNPC mRNA levels after circTET2 overexpression. I) HNRNPC protein levels after HNRNPC knockdown. J,K) The change in CPT1A and CPT1B mRNA levels after HNRNPC knockdown. L) Degradation rates of CPTA1 mRNA in cells with HNRNPC knockdown. M) HNRNPC binding sites in the CPT1A 3′UTR region as predicted by RBPsuit. N) Motif of HNRNPC. O) RIP assay shows the interaction between HNRNPC and CPT1A. P)Degradation rates of CPTA1 mRNA in cells with circTET2 knockdown. Q) The relative expression of CPT1A after overexpression of CPT1A and knockdown of circTET2 as detected by qRT‐PCR and western blot assays. R) Growth curves of cells with circTET2 overexpression and/or HNRNPC knockdown. S) Proliferative ability of cells with CPT1A overexpression and circTET2 knockdown. T,U) Survival analysis of HNRNPC (T) and CPT1A (U) in collected independent CLL cohort (GSE22762, n = 107). Error bars represent the means±SD derived from three independent experiments. ns, not significant, ***p < 0.001.
Figure 7
Figure 7
Effects of CP028, dactolisib, and perhexiline on CLL cells. A) The change in circTET2 levels with CP028 treatment for 24 h. B) Relative expression of RBMX and YTHDC1 in MEC‐1 cells treated with CP028. C) CCK8 was used to detect the viabilities of cells treated with CP028. D) Apoptotic rate of cells treated with CP028 for 24 h. E) IC50 of dactolisib in MEC‐1 cells treated for different time periods. F)qRT‐PCR analysis shows the expression change in CPT1A after 24 h of treatment with dactolisib. G) The protein levels for CPT1A and the mTOR pathway in cells with dactolisib treatment. H) The expression of mTOR pathway proteins with circTET2 knockdown and perhexiline treatment. I,J) The inhibitory effects of dactolisib and perhexiline and the combination index were calculated by CompuSyn. K) Apoptotic rate of cells treated with CP028, dactolisib, and/or perhexiline for 24 h detected with flow cytometry. L) The protein levels of the mTOR pathway in cells treated with dactolisib and or perhexiline. M) Trypan blue staining was used to evaluate the apoptotic rate of primary cells from five CLL patients. N) Schematic representation of circTETE2 promoting cell proliferation by modulating FAO and mTOR signaling. Error bars represent the means±SD derived from three independent experiments. ns, not significant, *p < 0.05, **p < 0.01, ***p < 0.001.

References

    1. a) Han J., Li Q., Chen Y., Yang Y., Front. Mol. Biosci. 2021, 8, 763902; - PMC - PubMed
    2. b) Zhao H., Li Y., Mol Biomed 2021, 2, 5. - PMC - PubMed
    1. a) Hallek M., Al‐Sawaf O., Am J Hematol 2021, 96, 1679; - PubMed
    2. b) Nie Y., Yun X., Zhang Y., Wang X., Exp Hematol 2022, 11, 39. - PMC - PubMed
    1. Rozovski U., Grgurevic S., Bueso‐Ramos C., Harris D. M., Li P., Liu Z., Wu J. Y., Jain P., Wierda W., Burger J., O'Brien S., Jain N., Ferrajoli A., Keating M. J., Estrov Z., Mol Cancer Res 2015, 13, 944. - PMC - PubMed
    1. a) Ito H., Nakamae I., Kato J. Y., Yoneda‐Kato N., J. Clin. Invest. 2021, 131, 141529; - PMC - PubMed
    2. b) Subedi A., Liu Q., Ayyathan D. M., Sharon D., Cathelin S., Hosseini M., Xu C., Voisin V., Bader G. D., D'Alessandro A., Lechman E. R., Dick J. E., Minden M. D., Wang J. C. Y., Chan S. M., Cell Stem Cell 2021, 28, 1851; - PubMed
    3. c) Galicia‐Vázquez G., Aloyz R., Front Oncol 2018, 8, 411. - PMC - PubMed
    1. Kristensen L. S., Jakobsen T., Hager H., Kjems J., Nat Rev Clin Oncol 2022, 19, 188. - PubMed

Publication types

MeSH terms

LinkOut - more resources