. 2023 Oct 11;14(1):6381.
doi: 10.1038/s41467-023-41877-4.

A clock-dependent brake for rhythmic arousal in the dorsomedial hypothalamus

Affiliations

A clock-dependent brake for rhythmic arousal in the dorsomedial hypothalamus

Qiang Liu et al. Nat Commun. .

Abstract

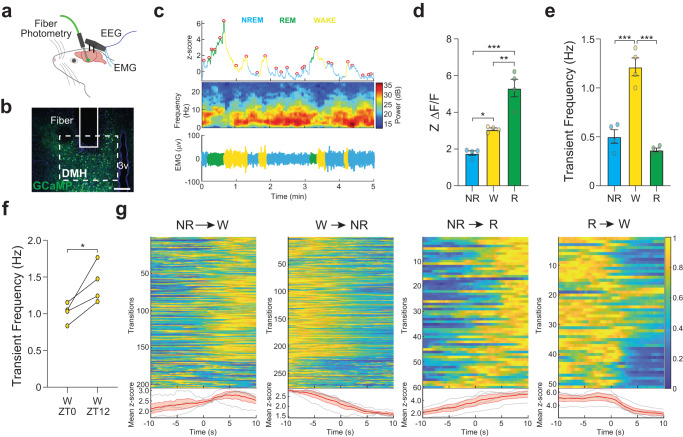
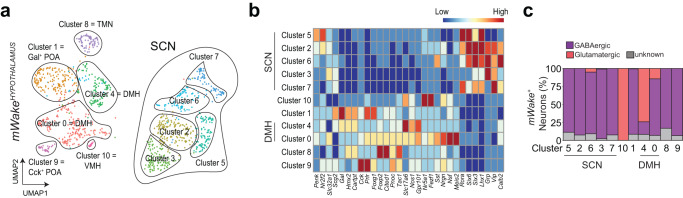
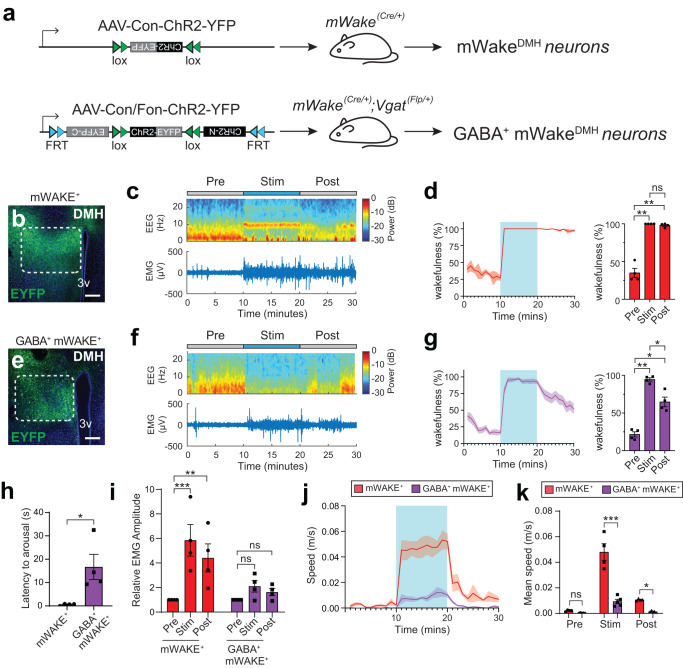
Circadian clocks generate rhythms of arousal, but the underlying molecular and cellular mechanisms remain unclear. In Drosophila, the clock output molecule WIDE AWAKE (WAKE) labels rhythmic neural networks and cyclically regulates sleep and arousal. Here, we show, in a male mouse model, that mWAKE/ANKFN1 labels a subpopulation of dorsomedial hypothalamus (DMH) neurons involved in rhythmic arousal and acts in the DMH to reduce arousal at night. In vivo Ca2+ imaging reveals elevated DMHmWAKE activity during wakefulness and rapid eye movement (REM) sleep, while patch-clamp recordings show that DMHmWAKE neurons fire more frequently at night. Chemogenetic manipulations demonstrate that DMHmWAKE neurons are necessary and sufficient for arousal. Single-cell profiling coupled with optogenetic activation experiments suggest that GABAergic DMHmWAKE neurons promote arousal. Surprisingly, our data suggest that mWAKE acts as a clock-dependent brake on arousal during the night, when mice are normally active. mWAKE levels peak at night under clock control, and loss of mWAKE leads to hyperarousal and greater DMHmWAKE neuronal excitability specifically at night. These results suggest that the clock does not solely promote arousal during an animal's active period, but instead uses opposing processes to produce appropriate levels of arousal in a time-dependent manner.


Conflict of interest statement

The authors declare no competing interests.

Figures

Fig. 1
Fig. 1. In vivo Ca2+ imaging of DMHmWAKE neurons reveals greater activity during wakefulness and REM sleep.
a Schematic showing the in vivo fiber photometry configuration, with simultaneous EEG/EMG recording. b Representative confocal image of the DMH following injection of AAV-Flex-GCaMP6s virus. The DMH and location of the fiber are indicated by dashed and solid lines, respectively. Scale bar denotes 200 μm. c Representative traces of a 5 min fiber photometry recording combined with EEG and EMG recordings. Top row shows the GCaMP6s signal, middle row indicates the EEG power spectrogram, and bottom trace shows the EMG signal across spontaneous sleep and wake stages. Colors correspond to distinct sleep-wake stages as shown. Circles indicate the transient peaks detected by the peak-finding algorithm (see Methods). d Z-score of ΔF/F signal across non-REM (NR), wakefulness (W), and REM (R) stages. In this plot, data from ZT0-3 and ZT12-15 were pooled (n = 4 animals); one-way ANOVA with post-hoc Tukey, ***P < 0.0001 (NR-R), **P = 0.001 (W-R), *P = 0.027 (NR-W). e Mean transient frequency across sleep-wake stages (n = 4 animals); one-way ANOVA with post-hoc Tukey, ***P < 0.0001 (NR-W), ***P < 0.0001 (W-R). f Mean transient frequency for wake state compared between ZT0-3 and ZT12-15 (n = 4 animals); paired t-test with Holm-Bonferroni correction, *P = 0.0379, two-tailed. g Top panels show heatmap representation of z-scored fluorescence for transitions for NREM→WAKE (n = 205), WAKE→NREM (n = 277), NREM→REM (n = 60), and REM→WAKE (n = 51). Bottom panels show averaged transition traces, shading indicates SEM. The data in this figure were derived from 4 animals, with 1–2 recording days per animal (both ZT0-3 and ZT12-15 for each day). Error bars, SEM.
Fig. 2
Fig. 2. Chemogenetic manipulation of DMHmWAKE neurons demonstrate a functional role in arousal.
a Schematic showing bilateral injections of AAV-DIO-hM3D-Gq into the DMH of mWake(Cre/+) mice. b Representative short-time Fourier transform spectrograms of 8 hrs of recorded EEG activity, starting after IP injection at ZT6 of vehicle alone (above) or 1 mg/kg CNO (below), from mWake(Cre/+) mice injected with AAV-DIO-hM3D-Gq bilaterally into the DMH. Power density is represented by the color-scheme and deconvoluted by frequency on the y-axis and over time on the x-axis. c Amount of wakefulness derived from EEG plotted as % time in 1 h bins for the mice in (a), following IP injection of vehicle (gray) or 1 mg/kg CNO (magenta) (n = 4) at ZT6; two-way ANOVA with post-hoc Holm-Sidak, ***P < 0.0001 (1 hrs), ***P < 0.0001 (2 h), ***P < 0.0001 (3 h), ***P < 0.0001 (4 h), ***P < 0.0001 (5 h). n = 3 replicates. d Total locomotor activity (total number of beams broken along X and Y-axis) of the mice in Fig. 2a in the 4 h following IP injection of vehicle vs CNO (1 mg/kg) at CT 8 (n = 6); paired t-test, **P = 0.0093, two-tailed. n = 3 replicates. e Schematic showing bilateral injections of AAV-DIO-hM4D-Gi into the DMH of mWake(Cre/+) mice. f Representative short-time Fourier transform spectrograms of 4 hrs of recorded EEG activity, starting after IP injection of vehicle alone (above) or 3 mg/kg CNO (below) at ZT10, from the mice shown in (e). g NREM amount for the mice shown in (e), plotted as % time in 1 h bins following IP injection of vehicle (gray) or 3 mg/kg CNO (magenta) (n = 6) at ZT10; two-way ANOVA with post-hoc Holm-Sidak, *P = 0.0467 (2 h), **P = 0.0026 (3 hrs), ***P < 0.0001 (4 h). n = 3 replicates. h Total locomotor activity for the mice shown in (e) in the 4 h following IP injection of vehicle (gray) vs CNO (3 mg/kg, magenta) (n = 6) at ZT10; paired t-test, *P = 0.0280, two-tailed. Error bars, SEM. n = 3 replicates.
Fig. 3
Fig. 3. Single-cell profiling of mWake hypothalamic neurons.
a UMAP (Uniform Manifold Approximation and Projection) plot showing distribution of mWake+ neurons across hypothalamic nuclei, as determined by single-cell expression profiling. 11 clusters are defined, for SCN, DMH, POA (pre-optic area), TMN (tuberomammillary nucleus), and VMH (ventromedial hypothalamus) regions. “Gal+” and “Cck+” refer to Galanin+ and Cholecystokinin+. b Heatmap showing key marker genes that were used to identify spatial location of each mWake+ neuronal cluster. c Bar graph showing proportions of GABAergic and glutamatergic mWake+ neurons for each scRNA-Seq neuronal cluster. n = 2 replicates.
Fig. 4
Fig. 4. Optogenetic manipulation suggests an arousal-promoting role for GABAergic DMHmWAKE neurons.
a Schematic illustrating Cre-dependent expression of ChR2 in DMHmWAKE neurons (above) and INTRSECT strategy for intersectional expression in GABAergic DMHmWAKE neurons (below). b and e Representative image of native YFP fluorescence expression in the DMH (dashed outline) following injection of the viruses depicted in (a). Scale bar denotes 200 μm. 3 v, 3rd ventricle. c and f Representative short-time Fourier transform spectrograms of EEG activity (above) and plots of EMG amplitude (below) across 10 min before (“Pre”), 10 min during (“Stim”), and 10 min after (“Post”) 10 Hz optogenetic stimulation of DMHmWAKE (c) or GABAergic DMHmWAKE neurons (f) using the mice described in (a). Power density is represented by the color-scheme and deconvoluted by frequency on the y-axis, over time on the x-axis. d and g (left) Wakefulness plotted as % time in 1 min bins for mWake(Cre/+) (d) and mWake(Cre/+); Vgat(Flp/+) mice (g) shown in (a). Optogenetic stimulation indicated by light blue box. (right) % wakefulness for the 10 min before, during, and after optogenetic stimulation of DMHmWAKE neurons (red, n = 4 animals), one-way ANOVA with post-hoc Tukey, **P = 0.0034 (Pre-Stim), **P = 0.0061 (Pre-Post), P = 0.3793 (Stim-Post) (d) or GABAergic DMHmWAKE neurons (magenta, n = 4 animals), one-way ANOVA with post-hoc Tukey, **P = 0.0011 (Pre-Stim), *P = 0.0216 (Pre-Post), *P = 0.0381 (Stim-Post) (g) neurons. h Latency to arousal from NREM sleep following optogenetic stimulation of DMHmWAKE neurons (red, n = 4 animals) or GABAergic DMHmWAKE neurons (magenta, n = 4 animals); unpaired t-test, *P = 0.0244, two-tailed. i Relative EMG amplitude for the 10 min before, during, and after optogenetic stimulation for DMHmWAKE neurons (red, n = 4 animals), two-way ANOVA with post-hoc Tukey, ***P < 0.0001 (Pre-Stim), **P = 0.0018 (Pre-Post) or GABAergic DMHmWAKE neurons (magenta, n = 4 animals), two-way ANOVA with post-hoc Tukey, P = 0.3393 (Pre-Stim), P = 0.6902 (Pre-Post). j Average speed (m/s) plotted per 1 min bins for activation of DMHmWAKE neurons (n = 4 animals) or GABAergic DMHmWAKE neurons (n = 5 animals). Optogenetic stimulation indicated by the light blue box. k Mean speed (m/s) for the 10 min before, during, or after optogenetic stimulation of DMHmWAKE neurons (red, n = 4 animals) or GABAergic DMHmWAKE neurons (magenta, n = 5 animals) in (j); two-way ANOVA with post-hoc Sidak’s, P = 0.9313 (Pre), ***P < 0.0001 (Stim), *P = 0.0447 (Post). Shading denotes SEM. Error bars, SEM.
Fig. 5
Fig. 5. mWAKE cycles under clock control and acts to suppress arousal at night.
a, b Representative immunoblot (a) and relative levels of mWAKE-V5 (b) from Western blot analyses using anti-V5 antibodies for mWake(V5/V5) hypothalamic tissue at ZT2, ZT8, ZT14, and ZT20 (n = 4 for all time points); one-way ANOVA with post-hoc Dunnett, *P = 0.043 (ZT2-ZT14). Actin was used as a loading control. c and d Representative immunoblot (c) and relative levels of mWAKE-V5 (d) from Western blot analyses using anti-V5 antibodies at ZT2 or ZT14 for mWake(V5/V5) (“wt”) (n = 4 for both time points) or mWake(V5/V5); Bmal1(-/-) (n = 4 for both time points) hypothalamic tissue; two-way ANOVA with post-hoc Sidak, *P = 0.023 (mWake(V5/V5), ZT2-ZT14). e Schematic showing genomic structure of the mWake locus and CRISPR/Cas9-mediated insertion of 8 bp containing an in-frame stop codon in exon 4 in the mWake(-) mutation. f Relative mRNA level for mWake, determined by qPCR, in mWake(-/-) vs WT littermate control hypothalami (normalized to 1.0) (n = 3 replicates); unpaired t-test, ***P < 0.0001, two-tailed. g Profile of locomotor activity (defined by beam-breaks) over 24 h for mWake(+/+) (gray) and mWake(-/-) (red) mice under DD conditions. Shading denotes SEM. h Total locomotor activity from CT0-12 and CT12-24 from mWake(+/+) (n = 19, gray), mWake(+/-) (n = 22, white), mWake(-/-) (n = 19, red), and mWake(Nmf9/-) (n = 9, cyan) mice under DD conditions; Kruskal-Wallis test with post-hoc Dunn’s, ***P = 0.0001 (CT0-12: mWake(+/+)-mWake(-/-)), ***P = 0.0007 (CT12-24: mWake(+/+)-mWake(-/-)), ***P = 0.0007 (CT12-24: mWake(+/+)-mWake(Nmf9/-)). Simplified boxplots show 25th percentile, median, and 75th percentile. n = 4 replicates. i and j Startle response (Vavg) measured in the first 100 ms following a 100, 110, or 120 dB tone for mWake(+/+) (gray, n = 10) vs mWake(-/-) mice (red, n = 10) at CT0-2 (i) or CT12-14 (j); two-way ANOVA with repeated measures and post-hoc Holm-Sidak, P = 0.5417 (CT0: 100 dB), **P = 0.003 (CT12: 100 dB), *P = 0.0391 (CT12: 110 dB), P = 0.1106 (CT12: 120 dB). The average of 5 responses is shown. Error bars, SEM. n = 4 replicates.
Fig. 6
Fig. 6. mWAKE is required in the DMH to modulate arousal and inhibits the excitability and firing of DMH neurons at night.
a Schematic of the genomic structure of the mWake locus and insertion of loxP sites flanking exon 5 in the mWake(flox) allele. b Schematic showing bilateral injections of AAV viral vector containing Cre-recombinase and GFP (AAV-Cre), or GFP alone (AAV-Sham) into the DMH of mWake(flox/-) mice. c Representative image of GFP fluorescence expression in the DMH following AAV-Cre injection described in (a). Scale bar, 200 μm. d Total locomotor activity during CT0-4 vs CT12-16 under DD conditions for mWake(flox/-) mice before (“pre”, gray) and after (“post”, green) DMH injection of AAV-Sham (n = 7) or AAV-Cre (n = 9); paired t-test with Holm-Bonferroni correction, P = 0.3995 (CT0-4: AAV-Cre), *P = 0.0448 (CT12-16: AAV-Cre), two-tailed. n = 4 replicates. e Native tdTomato fluorescence in the DMH of a mWake(Cre/+) mouse (dashed lines denote DMH region). Scale bar represents 200 μm. 3 v, 3rd ventricle. f Representative membrane potential traces from whole-cell patch clamp recordings of DMHmWAKE neurons in mWake(Cre/+) (gray, top) and mWake(Cre/Cre) (red, bottom) slices at ZT0-2 and ZT12-14. g Spontaneous mean firing rate for DMHmWAKE neurons at ZT0-2 and ZT12-14 from mWake(Cre/+) (n = 18 and n = 19, gray) vs mWake(Cre/Cre) (n = 15 and n = 11, red) mice; unpaired t-test with Holm-Bonferroni correction, P = 0.4283 (ZT0), *P = 0.0268 (ZT12), two-tailed. h f-I curves for DMHmWAKE neurons from mWake(Cre/+) (gray) vs mWake(Cre/Cre) (red) mice at ZT0-2 (n = 11 and 11, top) or ZT12-14 (n = 8 and 8, bottom); two-way ANOVA with repeated measures, **P = 0.0024 (ZT12-14) For panels (g) and (h), n represents individual cells from ≥4 animals for each condition. Error bars, SEM. i Model. mWAKE levels are higher at night, leading to reduced intrinsic excitability of DMHmWAKE neurons at night. However, putative increased extrinsic inputs onto these cells induced increased spontaneous firing of DMHmWAKE neurons at night. Loss of mWAKE leads to greater intrinsic excitability selectively at night, which further enhances spontaneous firing at night. j Model. While the clock promotes arousal at night in mice, it generates both arousal-promoting and arousal-inhibiting signals during this time. Loss of core clock activity (e.g., Bmal mutant) leads to loss of rhythms of arousal. In contrast, loss of mWAKE selectively removes the clock-dependent arousal-inhibiting signal at night, leading to marked hyperarousal at night.

References

    1. Herzog ED. Neurons and networks in daily rhythms. Nat. Rev. Neurosci. 2007;8:790–802. - PubMed
    1. Ukai H, Ueda HR. Systems biology of mammalian circadian clocks. Annu Rev. Physiol. 2010;72:579–603. - PubMed
    1. Mohawk JA, Green CB, Takahashi JS. Central and peripheral circadian clocks in mammals. Annu Rev. Neurosci. 2012;35:445–462. - PMC - PubMed
    1. Collins B, Brown SA. Beyond the molecular clock. Curr. Opin. Physiol. 2018;5:109–116.
    1. Sanchez, R. E. A., Kalume, F. & de la Iglesia, H. O. Sleep timing and the circadian clock in mammals: past, present and the road ahead. Semin Cell. Dev. Biol.10.1016/j.semcdb.2021.05.034 (2021). - PMC - PubMed

Publication types