. 2023 Oct 11;14(1):5789.
doi: 10.1038/s41467-023-41328-0.

Single-cell multi-omics analysis identifies two distinct phenotypes of newly-onset microscopic polyangiitis

Affiliations

Single-cell multi-omics analysis identifies two distinct phenotypes of newly-onset microscopic polyangiitis

Masayuki Nishide et al. Nat Commun. .

Abstract

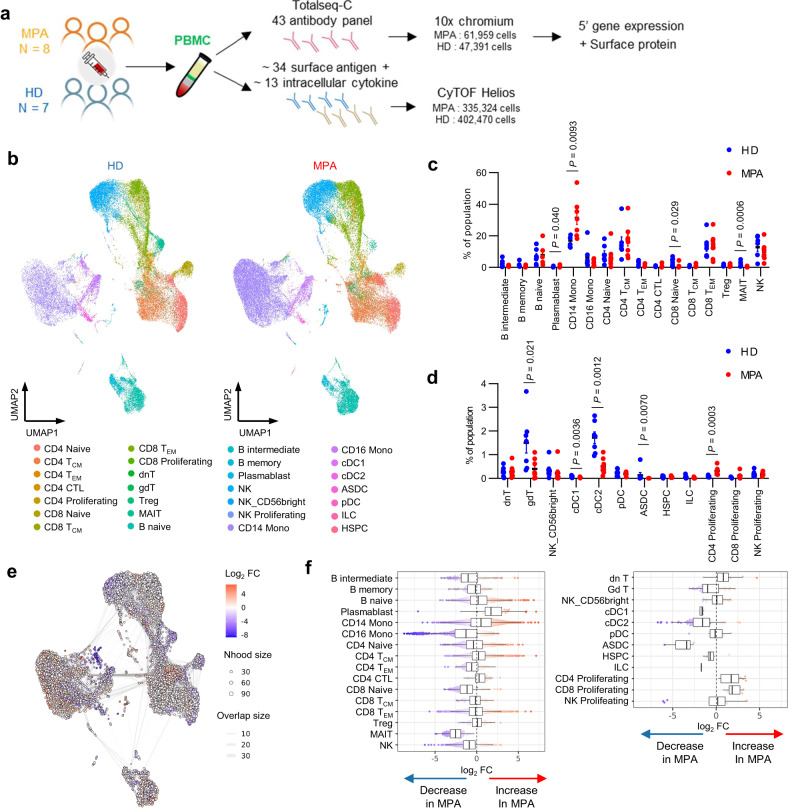
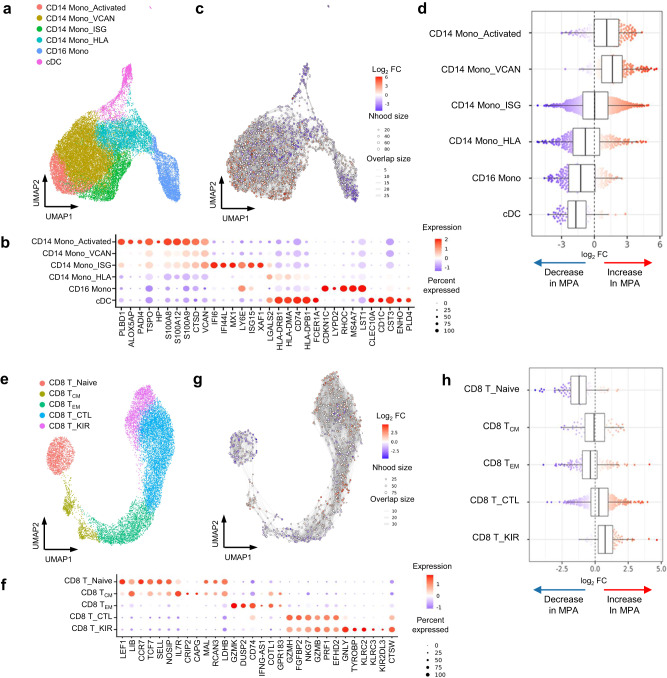
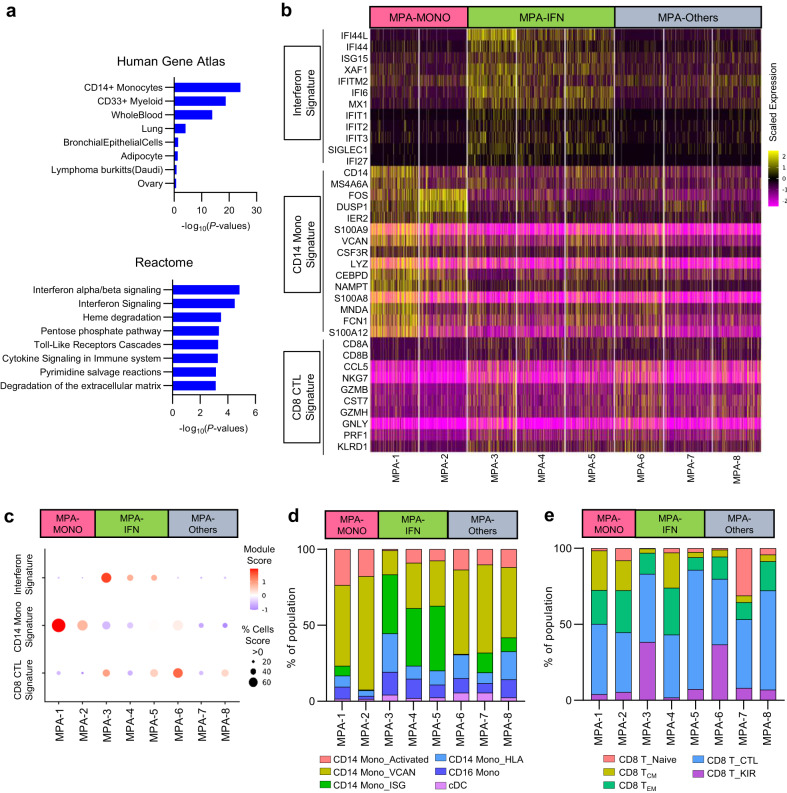
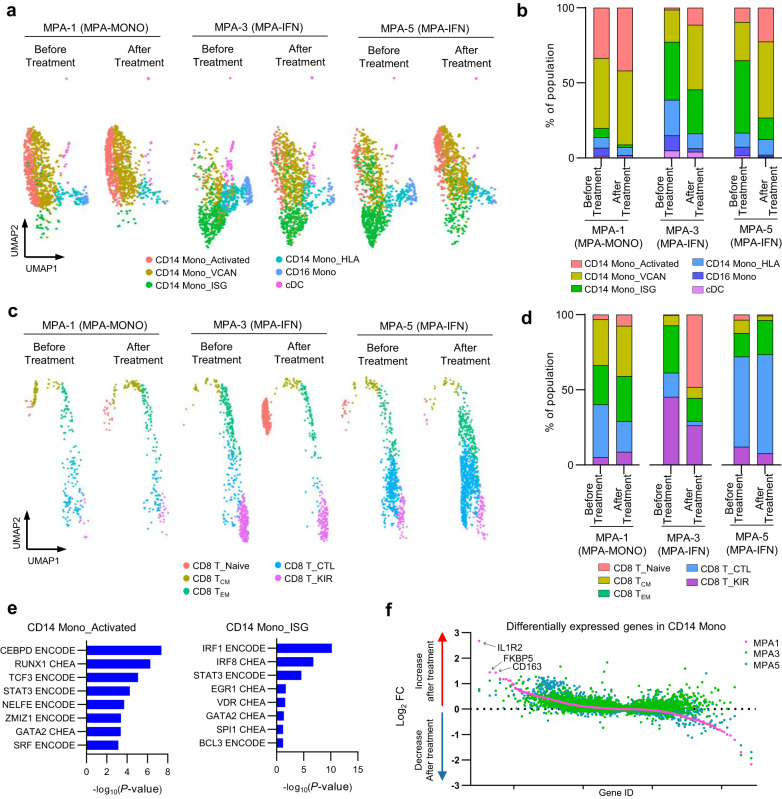
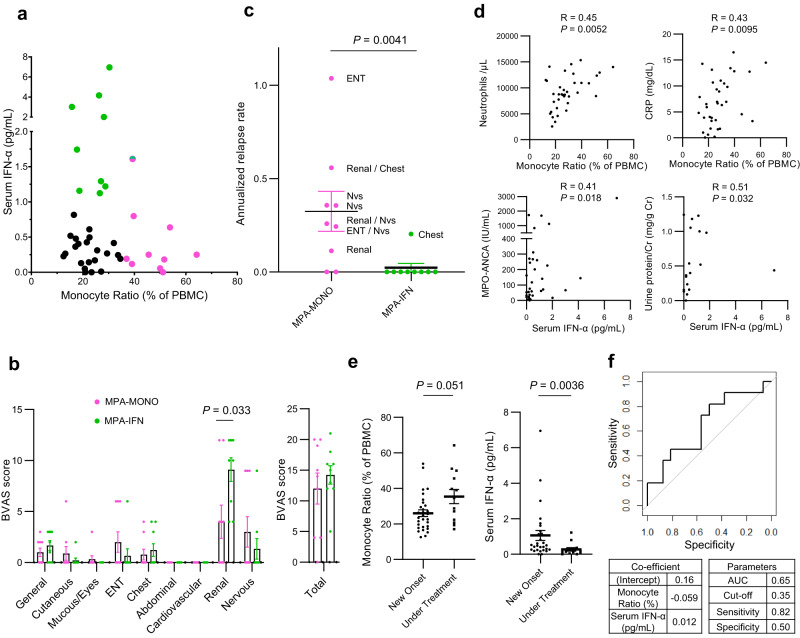
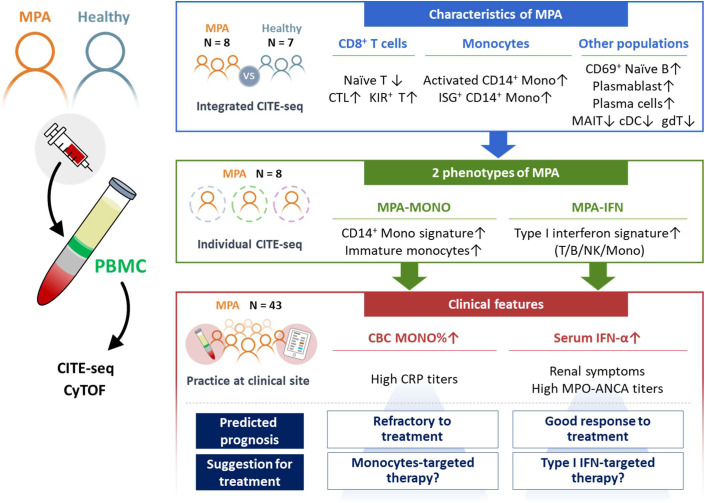
The immunological basis of the clinical heterogeneity in autoimmune vasculitis remains poorly understood. In this study, we conduct single-cell transcriptome analyses on peripheral blood mononuclear cells (PBMCs) from newly-onset patients with microscopic polyangiitis (MPA). Increased proportions of activated CD14+ monocytes and CD14+ monocytes expressing interferon signature genes (ISGs) are distinctive features of MPA. Patient-specific analysis further classifies MPA into two groups. The MPA-MONO group is characterized by a high proportion of activated CD14+ monocytes, which persist before and after immunosuppressive therapy. These patients are clinically defined by increased monocyte ratio in the total PBMC count and have a high relapse rate. The MPA-IFN group is characterized by a high proportion of ISG+ CD14+ monocytes. These patients are clinically defined by high serum interferon-alpha concentrations and show good response to immunosuppressive therapy. Our findings identify the immunological phenotypes of MPA and provide clinical insights for personalized treatment and accurate prognostic prediction.


Conflict of interest statement

A.K. has received grant support from Chugai Pharmaceutical Co, Ltd. K.N., H.M., S.I., H.K., R.O. and K.H. are employed by Chugai Pharmaceutical Co, Ltd. and K.N., H.M., S.I., H.K., R.O. and K.H. also hold stocks in the company. The remaining authors declare no competing interests.

Figures

Fig. 1
Fig. 1. CITE-seq analysis of PBMCs from healthy donors and patients with newly diagnosed, treatment-naïve MPA.
a Overview of the experimental workflow. MPA microscopic polyangiitis, HD healthy donors, PBMC peripheral blood mononuclear cells. b UMAP plots showing CITE-seq data of 47,391 PBMCs derived from healthy donors (n = 7, left) and 61,959 PBMCs derived from patients with MPA (n = 8, right). 28 cellular clusters were annotated with reference mapping. TCM central memory T cells, TEM effector memory T cells, CTL cytotoxic T lymphocytes, dnT double negative T cells, gdT gamma-delta T cells, Treg regulatory T cells, MAIT mucosal associated invariant T cells, NK natural killer cells, Mono monocytes, cDC classical dendritic cells, ASDC AXL+ dendric cells, pDC plasmacytoid dendritic cells, ILC innate lymphoid cells, HSPC hematopoietic stem and progenitor cells. Percentage of each cellular subpopulation relative to total number of PBMCs derived from healthy donors (n = 7, blue dots) and patients with MPA (n = 8, red dots) for the clusters with an average ratio of 1% or greater (c) and less than 1% (d). Values are means with SEMs and nominal P-values are calculated using a two-sided Mann-Whitney U test. e Neighborhood graph of monocytes using Milo differential abundance testing. Nodes represent neighborhoods from the PBMC population. Colors indicate the log2-fold difference between patients with MPA and healthy donors. Neighborhoods that increased in patients with MPA are shown in red. Neighborhoods decreased in patients with MPA are shown in blue. f Beeswarm and box plots showing the distribution of log2-fold differences in neighborhoods in different cell type clusters. Colors are represented similarly to e. Box plots show median and interquartile range (IQR); the lower and upper hinges correspond to the first and third quartiles. The upper whisker extends from the hinge to the largest value no further than 1.5*IQR from the hinge. The lower whisker extends from the hinge to the smallest value at most 1.5*IQR from the hinge. Source data are provided as a Source Data file.
Fig. 2
Fig. 2. Differential abundance analysis for the immunological characterization of MPA.
a UMAP plots showing the monocyte subpopulations in a total of 15 study participants including healthy donors (n = 7) and patients with MPA (n = 8). Six cellular clusters were identified; activated CD14+ monocytes (CD14 Mono_Activated), CD14+ monocytes characterized by VCAN gene expression (CD14 Mono_VCAN), CD14+ monocytes characterized by interferon signature gene expression (CD14 Mono_ISG), CD14+ monocytes characterized by HLA gene expression (CD14 Mono_HLA), CD16+ monocytes (CD16 Mono), and classical dendritic cells (cDC). b Balloon plot showing highly expressed genes in each monocyte subpopulation shown in a. Balloon color indicates the averaged scaled expression of the indicated genes. Balloon size indicates the percentage of cells expressing the indicated genes. c Neighborhood graph of monocytes using Milo differential abundance testing. Nodes represent neighborhoods from the monocyte population. Colors indicate the log2-fold difference between patients with MPA and healthy donors. Neighborhoods that increased in patients with MPA are shown in red. Neighborhoods decreased in patients with MPA are shown in blue. d Beeswarm and box plots showing the distribution of log2-fold differences in neighborhoods in different cell type clusters. Colors are represented similarly to c. Box plots are created in a similar fashion as in Fig. 1f. e UMAP plots showing the CD8+ T cell subpopulations in 15 samples. Five cellular clusters were identified; naïve CD8+ T cells (CD8 T_Naïve), central memory CD8+ T cells (CD8 T_CM), effector memory CD8+ T cells (CD8 T_EM), cytotoxically active CD8+ T cells (CD8 T_CTL), and CD8+ T cells characterized by KIR gene expression (CD8 T_KIR). f Balloon plot showing highly expressed genes in each population shown in e. g Neighborhood graph of CD8+ T cells based on Milo differential abundance testing. The analysis was performed similarly to c. h Beeswarm and box plots of CD8+ T cells based on Milo differential abundance testing. The analysis was performed similarly to d. Box plots are created in a similar fashion as in Fig. 1f.
Fig. 3
Fig. 3. Identification of transcriptome-based phenotypes of MPA.
a Gene set enrichment analysis of differentially expressed genes from patients with MPA using Gene Atlas from BioGPS (upper) and Reactome 2015 (bottom). P-values for each pathway were calculated by Benjamini–Hochberg method. b Heatmap showing the scaled expression of interferon signature genes, CD14+ monocyte signature genes, and CD8+ cytotoxic T lymphocyte (CTL) signature genes in PBMCs at the single-cell level. Each column indicates a patient with MPA (n = 8). c Balloon plots showing the averaged expression level of the signature genes shown in b. Each module score was calculated based on the scaled average expression level in PBMCs and the percentage of cells was calculated as the proportion of cells with a module score > 0. d Bar plots showing the proportion of each monocyte subpopulation relative to total the number of monocytes. Each subpopulation was annotated in a similar fashion as in Fig. 2a. e Bar plots showing the proportion of each CD8+ T cell subpopulation relative to the total number of CD8+ T cells. Each subpopulation was annotated in a similar fashion as in Fig. 2e. Source data are provided as a Source Data file.
Fig. 4
Fig. 4. Changes of transcriptome-based cell populations before and after treatment.
a UMAP plots showing the CITE-seq data of monocyte subpopulations before and after treatment in patients MPA-1, MPA-3, and MPA-5. Each monocyte subpopulation was annotated in a similar fashion as in Fig. 2a. b Bar plots showing the proportion of each monocyte subpopulation relative to the total number of monocytes before and after treatment. c UMAP plots showing the CITE-seq data of CD8+ T cell subpopulations before and after treatment in patients MPA-1, MPA-3, and MPA-5. Each CD8+ T cell subpopulation was annotated in a similar fashion as in Fig. 2e. d Bar plot showing the proportion of each CD8+ T cell subpopulation relative to the total number of CD8+ T cells. e Gene set enrichment analysis of differentially expressed genes in CD14 Mono_Activated (left) and CD14 Mono_ISG (right) using ENCODE and ChEA Consensus TFs from ChIP-X. P-values for each pathway were calculated by Benjamini–Hochberg method. f Scatter plot showing gene expression changes in post-treatment donors compared to pre-treatment donors. Genes are ordered by the fold change values in patient MPA-1. Pink, green, and blue colored dots represent individual genes in patients MPA-1, MPA-3, and MPA-5, respectively. Source data are provided as a Source Data file.
Fig. 5
Fig. 5. Translating omics-based classification of MPA to the bedside.
a Serum IFN-α concentrations and the percentage of monocytes among PBMCs in the complete blood count of samples from patients with MPA (n = 43). The 10 samples with the highest percentage of monocytes were classified as MPA-MONO (pink colored dots). The 10 samples with the highest IFN-α concentrations were classified as MPA-IFN (green colored dots). b Characteristic symptoms of patients in the MPA-MONO (n = 9) and MPA-IFN (n = 9) groups. Scores for each component are based on the Birmingham Vasculitis Activity Score (BVAS) 2008 version 3. Mucous; Mucous membranes, ENT; Eyes, nose, and throat. c Annualized relapse rate of patients in the MPA-MONO (n = 9) and MPA-IFN (n = 9) groups. Symptoms at relapse are displayed for each case based on the components of the BVAS. “Nvs” refers to the nervous system. d Correlation between the percentage of monocytes and representative clinical parameters, and between serum IFN-α concentrations and representative clinical parameters. Correlations and P-values were quantified using Kendall’s correlation coefficient (R). CRP C-reactive protein, MPO myeloperoxidase, ANCA anti-neutrophil cytoplasmic antibody. e Differences in serum IFN-α concentrations and monocyte ratio in patients with newly-onset cases (n = 30) and cases under treatment (n = 13). f Receiver Operating Characteristic (ROC) curve for predicting relapse of MPA from serum IFN-α concentration and percentage of monocytes in PBMCs. Values are means with SEMs and P-values are calculated using a two-sided Mann–Whitney U test for b, c, and e. Source data are provided as a Source Data file.
Fig. 6
Fig. 6. Graphical scheme of this study.
Newly-onset, untreated patients with MPA (n = 8) and healthy donors (n = 7) were recruited for this study. MPA is characterized by increased proportions of cytotoxic CD8+ T cells, KIR+ CD8+ T cells, activated CD14+ monocytes, CD14+ monocytes with ISG expression, CD69+ naïve B cells, plasmablasts, and plasma cells. MPA was further subclassified into two groups based on the high expression of CD14+ monocytes signature genes (MPA-MONO) or high expression of ISGs (MPA-IFN). The percentage of monocytes and serum IFN-α levels were the clinical markers that clearly distinguished MPA-MONO and MPA-IFN groups, respectively. The findings of this study suggest clinical recommendations for estimating prognosis for each patient based on the immunological phenotypes of MPA. MPA microscopic polyangiitis, PBMC peripheral blood mononuclear cells, CITE-seq cellular indexing of transcriptomes and epitopes by sequencing, CyTOF cytometry by time-of-flight, CTL cytotoxic T lymphocytes, KIR killer immunoglobulin-like receptor, ISG interferon signature genes, MAIT mucosal associated invariant T cells, cDC classical dendritic cells, gdT gamma-delta T cells, CBC complete blood count.

References

    1. Falk RJ, Jennette JC. ANCA small-vessel vasculitis. J. Am. Soc. Nephrol. 1997;8:314–322. doi: 10.1681/ASN.V82314. - DOI - PubMed
    1. Jennette JC, Falk RJ. Small-vessel vasculitis. N. Engl. J. Med. 1997;337:1512–1523. doi: 10.1056/NEJM199711203372106. - DOI - PubMed
    1. Hellmich B, et al. EULAR recommendations for the management of ANCA-associated vasculitis: 2022 update. Ann. Rheum. Dis. 2023;16:ard-2022–223764. - PubMed
    1. de Groot K, et al. Pulse versus daily oral cyclophosphamide for induction of remission in antineutrophil cytoplasmic antibody-associated vasculitis: a randomized trial. Ann. Intern. Med. 2009;150:670–680. doi: 10.7326/0003-4819-150-10-200905190-00004. - DOI - PubMed
    1. Jones RB, et al. Rituximab versus cyclophosphamide in ANCA-associated renal vasculitis. N. Engl. J. Med. 2010;363:211–220. doi: 10.1056/NEJMoa0909169. - DOI - PubMed

Publication types

Substances