. 2023 Oct 11;14(1):6375.
doi: 10.1038/s41467-023-42081-0.

Multidimensional responses of grassland stability to eutrophication

Affiliations

Multidimensional responses of grassland stability to eutrophication

Qingqing Chen et al. Nat Commun. .

Abstract

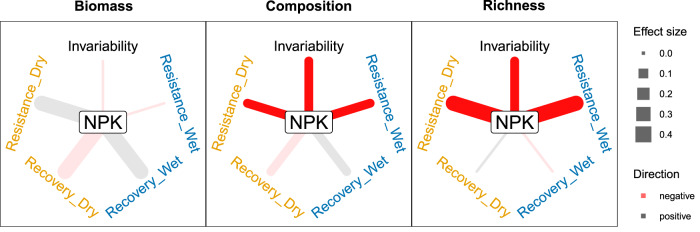
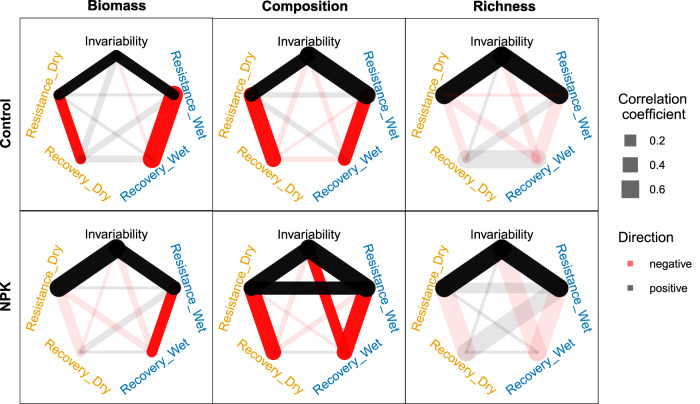
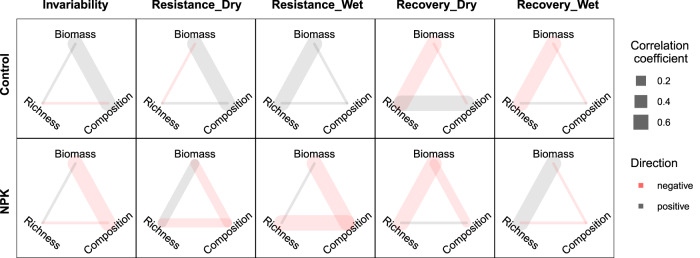
Eutrophication usually impacts grassland biodiversity, community composition, and biomass production, but its impact on the stability of these community aspects is unclear. One challenge is that stability has many facets that can be tightly correlated (low dimensionality) or highly disparate (high dimensionality). Using standardized experiments in 55 grassland sites from a globally distributed experiment (NutNet), we quantify the effects of nutrient addition on five facets of stability (temporal invariability, resistance during dry and wet growing seasons, recovery after dry and wet growing seasons), measured on three community aspects (aboveground biomass, community composition, and species richness). Nutrient addition reduces the temporal invariability and resistance of species richness and community composition during dry and wet growing seasons, but does not affect those of biomass. Different stability measures are largely uncorrelated under both ambient and eutrophic conditions, indicating consistently high dimensionality. Harnessing the dimensionality of ecological stability provides insights for predicting grassland responses to global environmental change.


Conflict of interest statement

The authors declare no competing interests.

Figures

Fig. 1
Fig. 1. Graphical illustration of five stability facets in three community aspects investigated in this study.
Methods used for quantifying stability facets are shown. We investigate the effects of nutrient addition (NPK) on (a) each of the five stability facets within each community aspect, (b) pairwise correlations among stability facets within each community aspect, and (c) pairwise correlations of stability among community aspects for a given stability facet. Resistance_Dry: resistance during dry growing seasons; Resistence_Wet: resistance during wet growing seasons; Recovery_Dry: recovery after dry growing seasons; Recovery_Wet: recovery after wet growing seasons.
Fig. 2
Fig. 2. Effects of nutrient addition (NPK) on each of the five stability facets in each of the three community aspects.
Resistance_Dry: resistance during dry growing seasons; Resistence_Wet: resistance during wet growing seasons; Recovery_Dry: recovery after dry growing seasons; Recovery_Wet: recovery after wet growing seasons. Saturated line colors represent significant treatment effects at p ≤ 0.05 and faded line colors represent non-significant treatment effects. The significance of treatment effects was assessed using t test. See Supplementary Table 3 for test statistics, effect sizes, standard errors of the effect size, degrees of freedom, and p values for the two-tailed test.
Fig. 3
Fig. 3. Pairwise correlations among the five stability facets in each of the three community aspects under ambient (control) and nutrient addition (NPK) conditions.
Resistance_Dry: resistance during dry growing seasons; Resistence_Wet: resistance during wet growing seasons; Recovery_Dry: recovery after dry growing seasons; Recovery_Wet: recovery after wet growing seasons. Saturated line colors represent significant correlations, corresponding to 95% confidence intervals of the correlation coefficients that do not overlap with 0. Faded line colors represent non-significant correlations. See Supplementary Table 5 for test statistics and 95% confidence intervals for each correlation coefficient.
Fig. 4
Fig. 4. Pairwise correlations among stability of the three community aspects for a given stability facet under ambient (control) and nutrient addition (NPK) conditions.
Resistance_Dry: resistance during dry growing seasons; Resistence_Wet: resistance during wet growing seasons; Recovery_Dry: recovery after dry growing seasons; Recovery_Wet: recovery after wet growing seasons. Saturated line colors represent significant correlations, corresponding to 95% confidence intervals of the correlation coefficients that do not overlap with 0. Faded line colors represent non-significant correlations. See Supplementary Table 6 for test statistics and 95% confidence intervals for each correlation coefficient.

References

    1. Aichi targets. https://www.cbd.int/aichi-targets/target/8.
    1. IPCC (2019). Summary for policymakers. In P. R. Shukla, et al (Eds.), Climate change and land: An IPCC special report on climate change, deserti- fication, land degradation, sustainable land management, food secu- rity, and greenhouse gas fluxes in terrestrial ecosystems(p. 5). World Meterological Organization. 7–22 http://www.gtp89.dial.pipex.com/AR4.htm.
    1. IPBES (2019): Summary for policymakers of the global assessment report on biodiversity and ecosystem services of the Intergovernmental Science-Policy Platform on Biodiversity and Ecosystem Services. (eds Díaz, S. et al.) (56 IPBES secretariat, Bonn, Germany).
    1. MacArthur R. Fluctuations of animal populations and a measure of community stability. Ecology. 1955;36:533. doi: 10.2307/1929601. - DOI
    1. Pimm SL. The complexity and stability of ecosystems. Nature. 1984;307:321–326. doi: 10.1038/307321a0. - DOI

Publication types