. 2023 Oct 11;14(10):671.
doi: 10.1038/s41419-023-06201-4.

PTPN23 ubiquitination by WDR4 suppresses EGFR and c-MET degradation to define a lung cancer therapeutic target

Affiliations

PTPN23 ubiquitination by WDR4 suppresses EGFR and c-MET degradation to define a lung cancer therapeutic target

Shaifali Singh et al. Cell Death Dis. .

Erratum in

Abstract

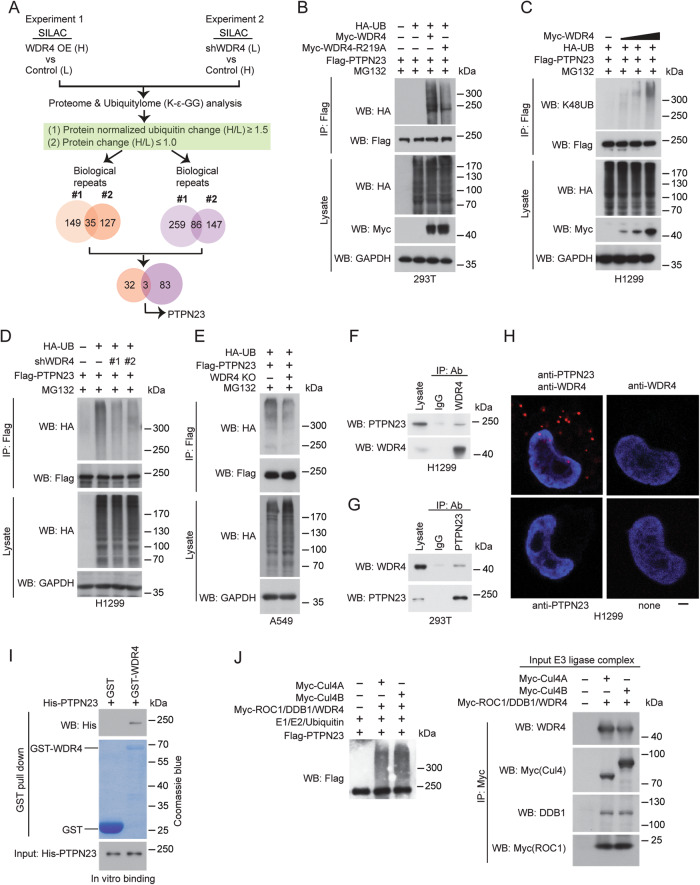
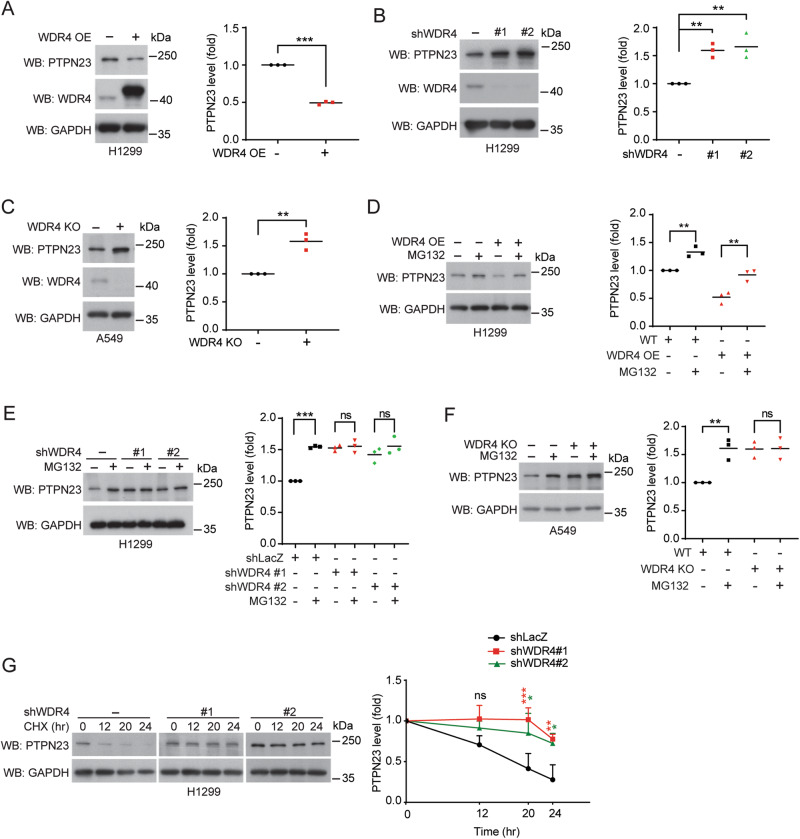
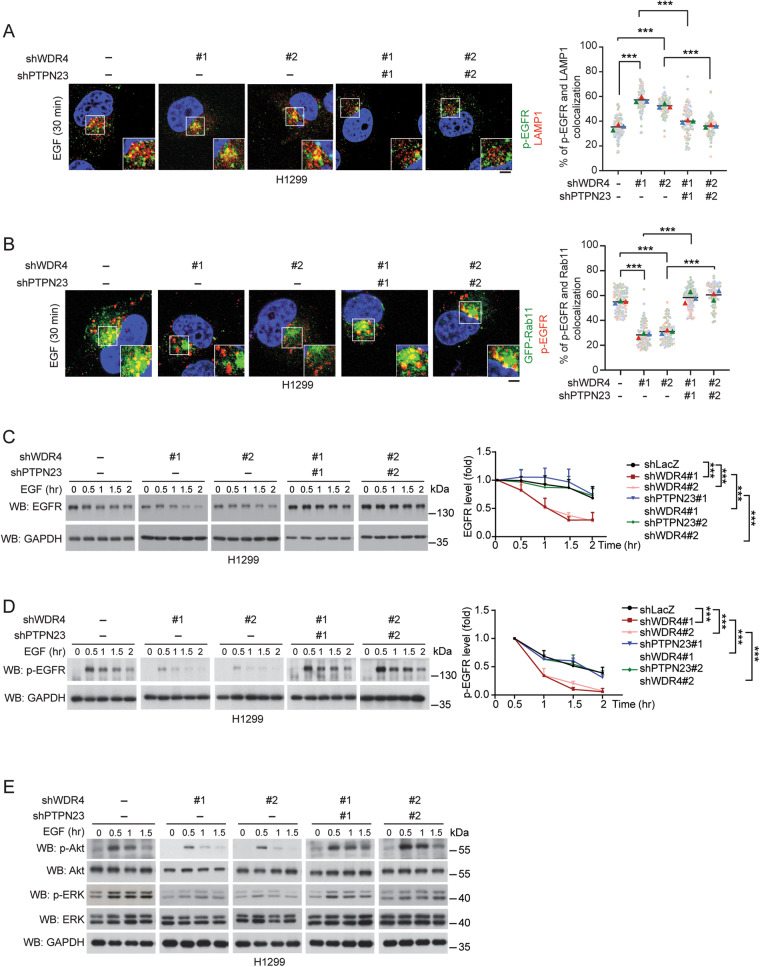
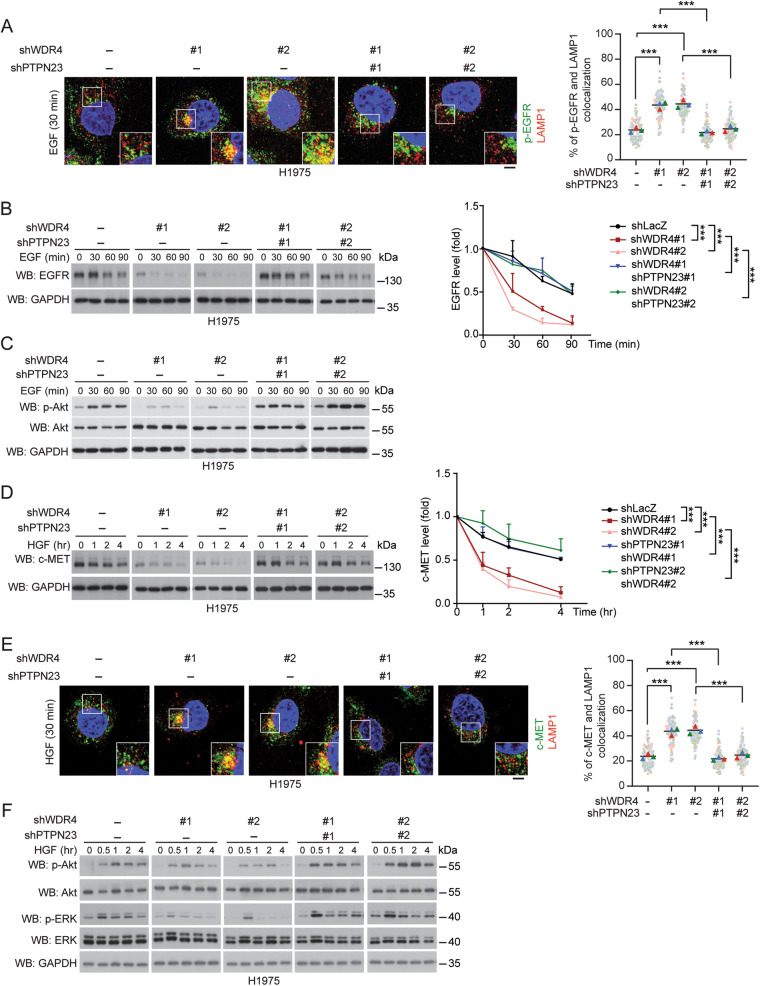
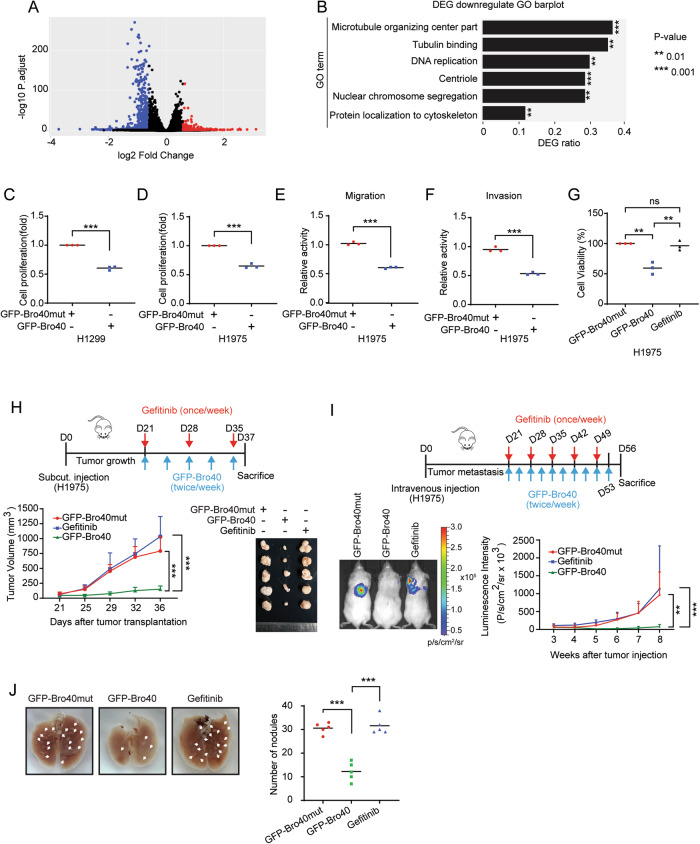
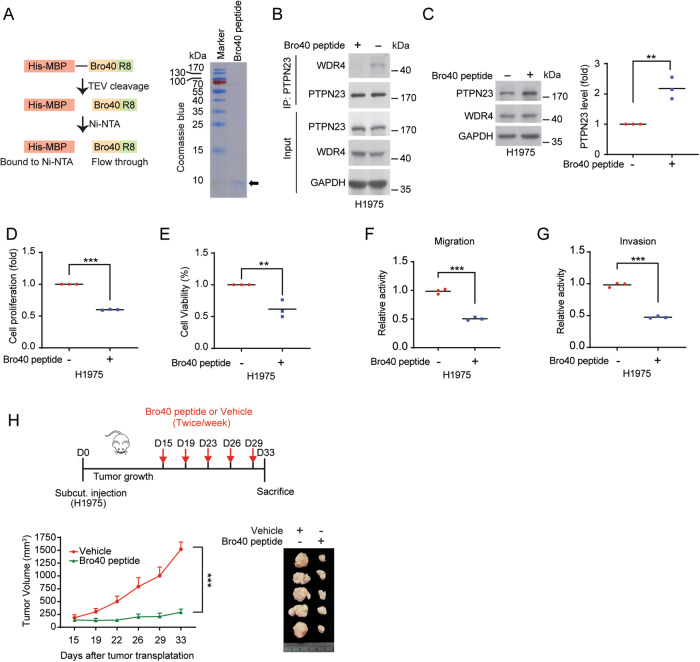
Aberrant overexpression or activation of EGFR drives the development of non-small cell lung cancer (NSCLC) and acquired resistance to EGFR tyrosine kinase inhibitors (TKIs) by secondary EGFR mutations or c-MET amplification/activation remains as a major hurdle for NSCLC treatment. We previously identified WDR4 as a substrate adaptor of Cullin 4 ubiquitin ligase and an association of WDR4 high expression with poor prognosis of lung cancer. Here, using an unbiased ubiquitylome analysis, we uncover PTPN23, a component of the ESCRT complex, as a substrate of WDR4-based ubiquitin ligase. WDR4-mediated PTPN23 ubiquitination leads to its proteasomal degradation, thereby suppressing lysosome trafficking and degradation of wild type EGFR, EGFR mutant, and c-MET. Through this mechanism, WDR4 sustains EGFR and c-MET signaling to promote NSCLC proliferation, migration, invasion, stemness, and metastasis. Clinically, PTPN23 is downregulated in lung cancer and its low expression correlates with WDR4 high expression and poor prognosis. Targeting WDR4-mediated PTPN23 ubiquitination by a peptide that competes with PTPN23 for binding WDR4 promotes EGFR and c-MET degradation to block the growth and progression of EGFR TKI-resistant NSCLC. These findings identify a central role of WDR4/PTPN23 axis in EGFR and c-MET trafficking and a potential therapeutic target for treating EGFR TKI-resistant NSCLC.


Conflict of interest statement

The authors declare no competing interests.

Figures

Fig. 1
Fig. 1. Identification of PTPN23 as a substrate of WDR4-based E3 ligase.
A Schematic presentation of the design of quantitative proteome and ubiquitylome analyses on control and WDR4 overexpressing (OE) A549 cells or control and WDR4 knockdown A549 cells. The criteria for hit selection and the number of hits recovered are shown. B, C Immunoprecipitation analysis for PTPN23 ubiquitination in HEK293T (B) and H1299 (C) cells transfected with the indicated constructs. D, E Immunoprecipitation analysis of PTPN23 ubiquitination in H1299 cells stably expressing control or WDR4 shRNAs (D) or A549 control or WDR4 KO cells (E) and transiently transfected with the indicated constructs. The efficient knockdown and knockout of WDR4 in these cells are shown in Figs. 2B and C, respectively. F, G Immunoprecipitation analysis of the interaction between endogenous PTPN23 and endogenous WDR4 in indicated cells. H Representative PLA images for the interaction between endogenous WDR4 and endogenous PTPN23 in H1299 cells. Antibodies used are indicated. Bar, 10 μm. I GST pull down analysis for the in vitro interaction between GST-WDR4 and His-PTPN23. J In vitro ubiquitination assay for PTPN23. His-PTPN23 purified from baculovirus was incubated with E1, E2, ubiquitin and/or WDR4-based Cul4A or Cul4B complex purified from transfected HEK293T cells. The integrity of input E3 ligase complex is shown on the right.
Fig. 2
Fig. 2. WDR4 promotes PTPN23 proteasomal degradation.
AC Western blot analysis of PTPN23 levels in H1299 cells overexpressing WDR4 (A), H1299 cells stably expressing WDR4 shRNAs (B), or WDR4 KO A549 cells (C). The blots are representatives of three independent experiments and quantitative data are shown on the right. DF Western blot analysis of PTPN23 levels in indicated cells treated with or without 10 μM MG132 for 16 h. The blots are representatives of three independent experiments and quantitative data are shown on the right. G Western blot analysis of PTPN23 levels in H1299 cells stably expressing control or WDR4 shRNAs and treated with 20 μg/ml cycloheximide for indicated time periods. Quantitative data are shown on the right. Data in (AC) are represented as individual points and mean and data in (G) is mean ± SD, n = 3. P-values are determined by two-sided Student’s t-test (A, C), one way ANOVA with Tukey’s post hoc test (B, D, E, F), or two-way ANOVA with Tukey’s post hoc test (G), *P < 0.05, **P < 0.01, ***P < 0.001. ns: not significant.
Fig. 3
Fig. 3. WDR4/PTPN23 axis inhibits EGFR lysosomal degradation to sustain EGFR signaling.
A, B Immunofluorescence staining for the colocalization of p-EGFR with LAMP1 (A) or with GFP-Rab11 (B) in H1299 cells stably expressing various shRNAs and stimulated with EGF (100 ng/ml) for 30 min. GFP-Rab11 was introduced by transient transfection. The knockdown efficiencies of various shRNAs are shown in Supplementary Fig. S2A. Representative confocal images are shown on the left and quantitative data are on the right. Bar, 20 μm. Data are represented as mean, n = 3 (30 cells per group per experiment were counted). P-values are determined by two-way ANOVA with Tukey’s post hoc test, ***P < 0.001. C, D Western blot analysis of EGFR and p-EGFR in H1299 cells stably expressing various shRNAs and stimulated with EGF (100 ng/ml) for indicated time periods. The blots are representatives of three independent experiments and quantitative data are shown on the right. Data are mean ± SD, n = 3. P-values are determined by two-way ANOVA with Tukey’s post hoc test, ***P < 0.001. E Western blot analysis of indicated proteins in H1299 cells stably expressing various shRNAs and stimulated with EGF (100 ng/ml) for indicated time periods.
Fig. 4
Fig. 4. WDR4/PTPN23 axis inhibits EGFR mutant and c-MET lysosomal degradation to sustain their signaling.
A, E Immunofluorescence staining for the colocalization of p-EGFR (A) or c-MET (E) with LAMP1 in H1975 cells stably expressing various shRNAs and treated with 100 ng/ml EGF or HGF for 30 min, respectively. The knockdown efficiencies of various shRNAs are shown in Supplementary Fig. S3A. Representative confocal images are shown on the left and quantitative data are on the right. Bar, 20 μm. Data are represented as mean, n = 3 (30 cells per group per experiment were counted.). P-values are determined by two-way ANOVA with Tukey’s post hoc test, ***P < 0.001. B, D Western blot analysis of EGFR or c-MET levels in cells as in (A) and treated with 100 ng/ml EGF or HGF for indicated time periods. The blots are representatives of three independent experiments and quantitative data are shown on the right. Data are mean ± SD, n = 3. P-values are determined by two-way ANOVA with Tukey’s post hoc test, ***P < 0.001. C, F Western blot analysis of indicated proteins in cells as in (A) and treated with 100 ng/ml EGF or HGF for indicated time periods.
Fig. 5
Fig. 5. WDR4/PTPN23 axis promotes multiple cancer hallmarks and correlates with adverse prognosis in human lung cancer.
A, B Cell proliferation assay of H1299 or H1975 cells stably expressing indicated shRNAs and stimulated with or without 100 ng/ml EGF (A) or HGF (B) for 24 hr, respectively. Data are represented as individual points and mean, n = 3. P-values are determined by one-way ANOVA with Sidak’s multi-comparison test, **P < 0.01, ***P < 0.001. C, D Migration and invasion assays of H1299 or H1975 cells stably expressing indicated shRNAs. Data are represented as individual points and mean, n = 3. P-values are determined by one-way ANOVA with Sidak’s multi-comparison test, ***P < 0.001. E Experimental metastasis assay for H1299 cells stably expressing indicated shRNAs. Representative bioluminescence images at week 8 and the kinetics of metastasis at indicated time points are shown on the left and right, respectively. Data are mean ± SD, n = 5. P-values are determined by two-way ANOVA with Tukey’s post-hoc test, ***P < 0.001. F Representative lung images at week 8 for the experiment shown in (E). Nodules are indicated by arrows and the number of metastatic nodules at the surface of lungs are shown on the right. Data are represented as individual points and mean, n = 5. P-values are determined by one-way ANOVA with Sidak’s multi-comparison test, ***P < 0.001. G Representative IHC images for WDR4 and PTPN23 expression in lung tumor tissues and their adjacent normal tissues (left). Bar, 20 µm. The summary of the WDR4 and PTPN23 expression profiles for 119 lung tumor tissues (T) and 62 adjacent normal tissues (N) are shown on the right. P-values are determined by Fisher’s exact test, ***P < 0.001. H Representative IHC images for 2 lung tumor tissues showing an inverse correlation for WDR4 and PTPN23 expression (left). Bar, 20 µm. The correlation of WDR4 expression with PTPN23 expression in 119 lung tumor specimens is shown on the right. P-values are determined by Fisher’s exact test, ***P < 0.001. I, J Kaplan-Meier analysis of lung cancer patients’ survival with the corresponding expression profiles. P-values are determined by log-rank test.
Fig. 6
Fig. 6. PTPN23 Bro40 disrupts WDR4/PTPN23 axis to downregulate EGFR and c-MET.
A GST pull down analysis for mapping the PTPN23 domain involved in WDR4 interaction. Top: PTPN23 domain architecture. Bottom: The various Flag-PTPN23 segments purified from baculovirus were incubated with GST-WDR4 purified from bacteria. B, C Immunoprecipitation analysis of WDR4 interaction with PTPN23 Bro1 or its truncated mutants expressed in H1299 cells. D GST pull down analysis for the interaction between GST-WDR4 and Bro1 or Bro_Δ6 purified from bacteria. E Immunoprecipitation analysis for the interaction between endogenous PTPN23 and endogenous WDR4 in H1299 cells transiently transfected with GFP-Bro40 or GFP-Bro40mut and treated with 5 μM MG132 for 16 h. F Immunoprecipitation analysis of PTPN23 ubiquitination in 293T cells transiently transfected with indicated constructs. G Western blot analysis of PTPN23 levels in H1299 cells transiently transfected with the indicated constructs. Data are represented as individual points and mean, n = 3. P-values are determined by one-way ANOVA with Sidak’s multiple comparison test, ***P < 0.001. H, IL Western blot analysis of EGFR or c-MET levels in H1299 or H1975 cells transiently transfected with GFP-Bro40 or GFP-Bro40mut and stimulated with 100 ng/ml EGF for 2 h or 100 ng/ml HGF for 4 h. The blots are representatives of three independent experiments and quantitative data are shown. Data are represented as individual points and mean, n = 3. P-values are determined by one-way ANOVA with Sidak’s multiple comparison test, *P < 0.05, **P < 0.01. ns: not significant. J, K Western blot analysis of indicated proteins in H1299 or H1975 cells transiently transfected with GFP-Bro40 or GFP-Bro40mut and stimulated with 100 ng/ml EGF or HGF for 4 h.
Fig. 7
Fig. 7. PTPN23 Bro40 suppresses lung cancer progression and overcomes EGFR TKI resistance.
A Volcano plot for the comparison of RNA-seq data derived from H1299 cells expressing GFP-Bro40 and GFP-Bro40mut. DEGs are marked by blue and red dots. B GO analysis of genes that are downregulated by GFP-Bro40 in comparison with GFP-Bro40mut. CF Cell proliferation, migration, and invasion analyses of H1299 or H1975 cells transiently transfected with GFP-Bro40 or GFP-Bro40mut. Data are represented as individual points and mean, n = 3. P-values are determined by two-sided Student’s t-test, ***P < 0.001. G MTT assay for H1975 cells transiently transfected with GFP-Bro40 or GFP-Bro40mut or treated with 1 µM gefitinib for 48 h. Data are represented as individual points and mean, n = 3. P-values are determined by one-way ANOVA with Tukey’s post hoc test, **P < 0.01. ns: not significant. H Mice that are subcutaneously transplanted with H1975 cells were treated with GFP-Bro40 or GFP-Bro40mut liposome nanoparticle or with gefitinib starting at day 21 after tumor cell implantation (Top panel). Tumor volumes were measured on the indicated days and plotted (bottom left panel). Data are mean ± SD, n = 5. P-values are determined by two-way ANOVA with Tukey’s post-hoc test, ***P < 0.001. Tumors were surgically removed on day 37 and their sizes are shown on the right. I Mice that were intravenously injected with H1975 cells were treated with GFP-Bro40 or GFP-Bro40mut liposome nanoparticle or with gefitinib as illustrated on the top panel. Representative images of bioluminescence analysis at day 56 after tumor cell injection are shown on the bottom left panel and the kinetics of metastasis are shown on the bottom right panel. Data are mean ± SD, n = 5. P-values are determined by two-way ANOVA with Tukey’s post-hoc test, **P < 0.01, ***P < 0.001. J Representative lung images on day 56 of the experiment shown in I. Nodules are indicated by arrows and the number of metastatic nodules at the surface of lungs are shown on the right. Data are represented as individual points and mean, n = 5. P-values are determined by one-way ANOVA with Sidak’s multi-comparison test, ***P < 0.001.
Fig. 8
Fig. 8. Cell penetrating Bro40 peptide blocks WDR4/PTPN23 interaction and overcomes EGFR TKI resistance.
A Schematic representation of the generation of cell penetrating Bro40 peptide (left) and Coomassie blue staining of the Bro40 peptide (right). The position of Bro40 peptide is marked by an arrow. B Immunoprecipitation analysis for the interaction between endogenous PTPN23 and endogenous WDR4 in H1975 cells incubated with Bro40 peptide or vehicle and treated with 5 μM MG132 for 16 h. C Western blot analysis of PTPN23 levels in H1975 cells incubated with the Bro40 peptide. Data are represented as individual points and mean, n = 3. P-values are determined by two-sided Student’s t-test, **P < 0.01. DG Cell proliferation, viability, migration, and invasion analyses of H1975 cells incubated with Bro40 peptide. Data are represented as individual points and mean, n = 3. P-values are determined by two-sided Student’s t-test, **P < 0.01, ***P < 0.001. H Mice that are subcutaneously transplanted with H1975 cells were treated with Bro40 peptide or vehicle at day 15 after tumor cell implantation (top). Tumor volumes were measured on the indicated days and plotted (bottom left). Data are mean ± SD, n = 5. P-values are determined by two-way ANOVA with Tukey’s post-hoc test, ***P < 0.001. Tumors were surgically removed on day 33 and their sizes are shown on the bottom right.

Similar articles

Cited by

References

    1. Gridelli C, Rossi A, Carbone DP, Guarize J, Karachaliou N, Mok T, et al. Non-small-cell lung cancer. Nat Rev Dis Primers. 2015;1:15009. doi: 10.1038/nrdp.2015.9. - DOI - PubMed
    1. Siegel RL, Miller KD, Fuchs HE, Jemal A. Cancer Statistics, 2021. CA Cancer J Clin. 2021;71:7–33. doi: 10.3322/caac.21654. - DOI - PubMed
    1. Gower A, Wang Y, Giaccone G. Oncogenic drivers, targeted therapies, and acquired resistance in non-small-cell lung cancer. J Mol Med (Berl) 2014;92:697–707. doi: 10.1007/s00109-014-1165-y. - DOI - PMC - PubMed
    1. Maemondo M, Inoue A, Kobayashi K, Sugawara S, Oizumi S, Isobe H, et al. Gefitinib or chemotherapy for non-small-cell lung cancer with mutated EGFR. N Engl J Med. 2010;362:2380–8. doi: 10.1056/NEJMoa0909530. - DOI - PubMed
    1. Mitsudomi T, Morita S, Yatabe Y, Negoro S, Okamoto I, Tsurutani J, et al. Gefitinib versus cisplatin plus docetaxel in patients with non-small-cell lung cancer harbouring mutations of the epidermal growth factor receptor (WJTOG3405): an open label, randomised phase 3 trial. Lancet Oncol. 2010;11:121–8. doi: 10.1016/S1470-2045(09)70364-X. - DOI - PubMed

Publication types

MeSH terms