

New approaches to selecting a scan-sampling method for chicken behavioral observations and their practical implications
- PMID: 37821498
- PMCID: PMC10567684
- DOI: 10.1038/s41598-023-44126-2
New approaches to selecting a scan-sampling method for chicken behavioral observations and their practical implications
Abstract
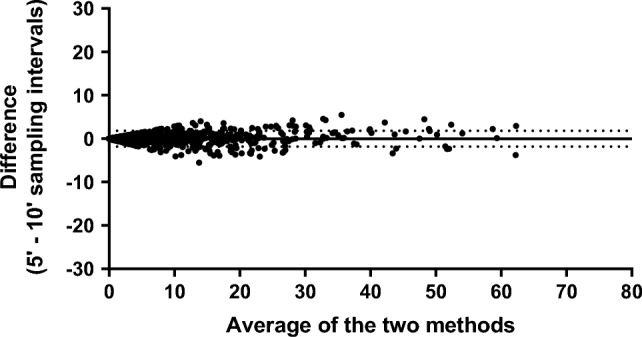
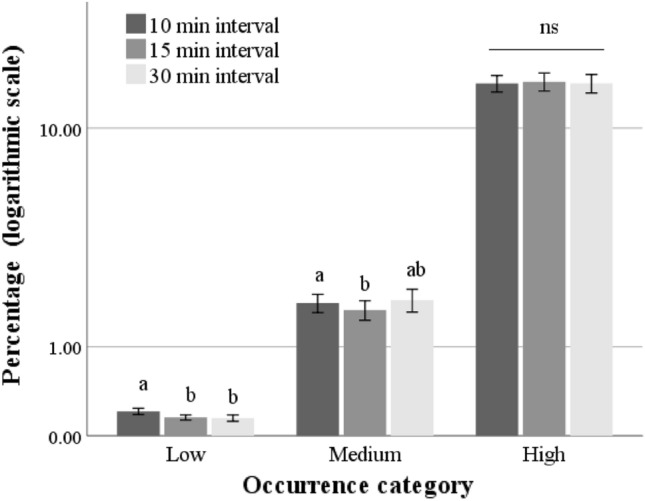
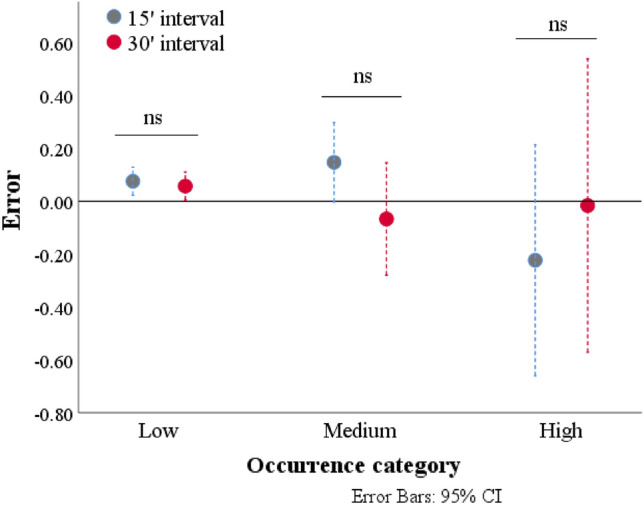
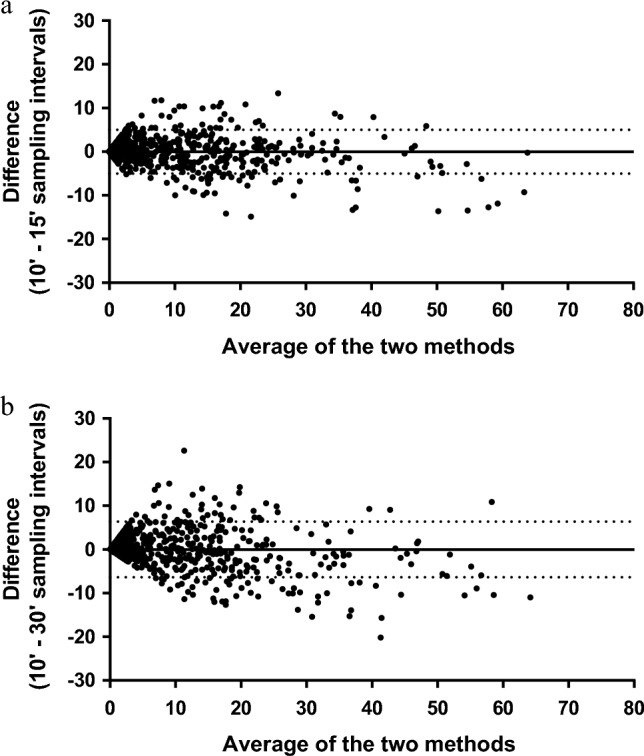
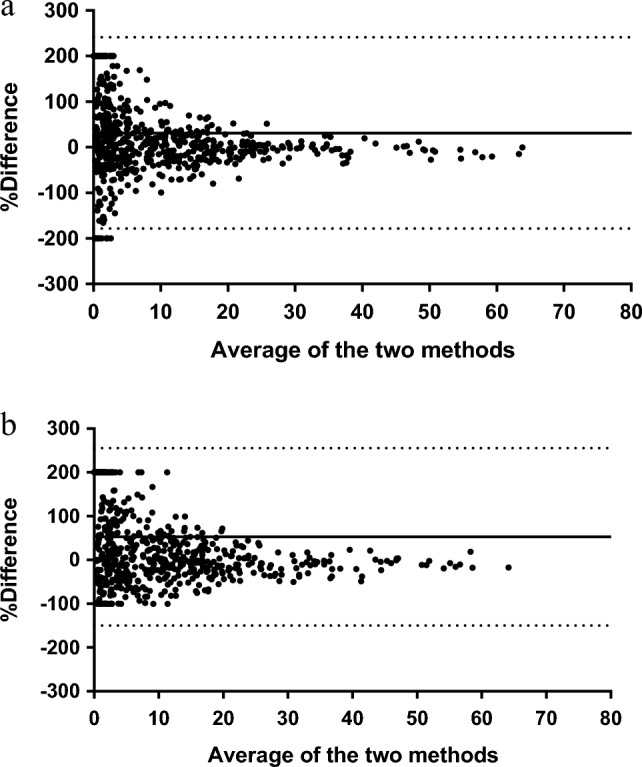
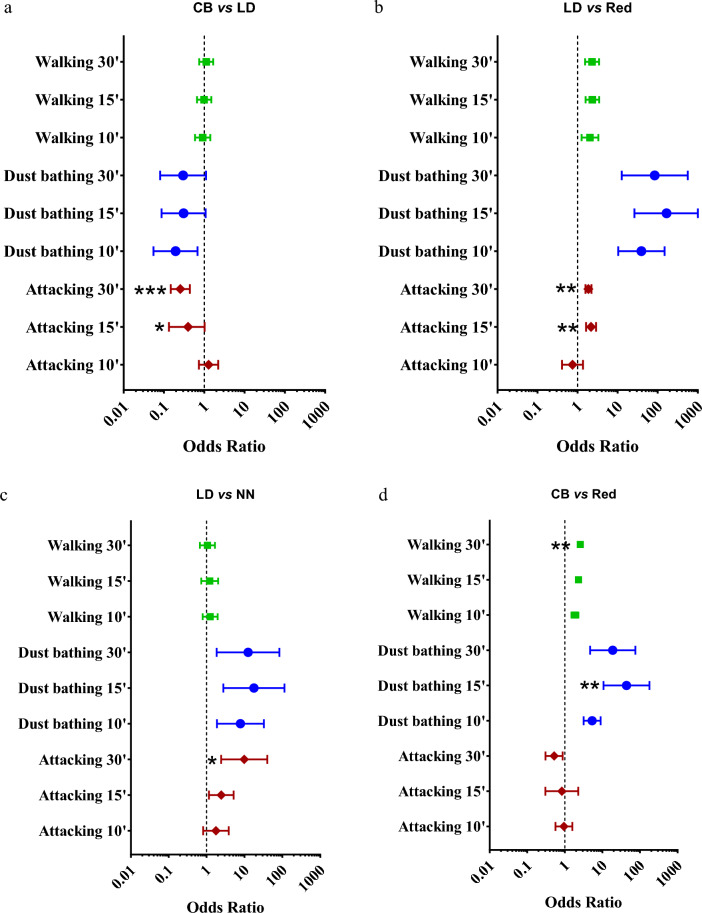
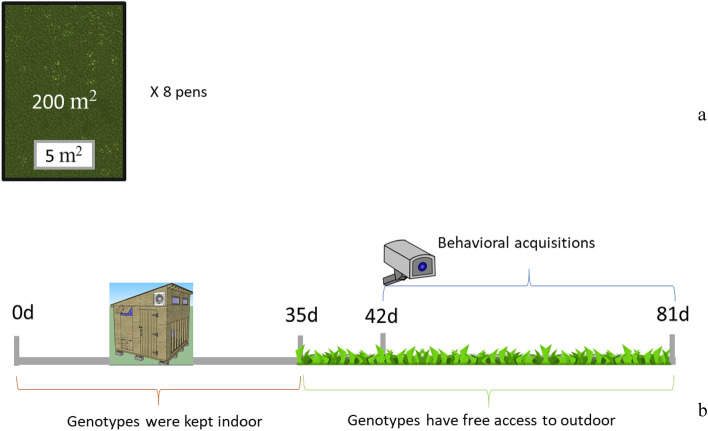
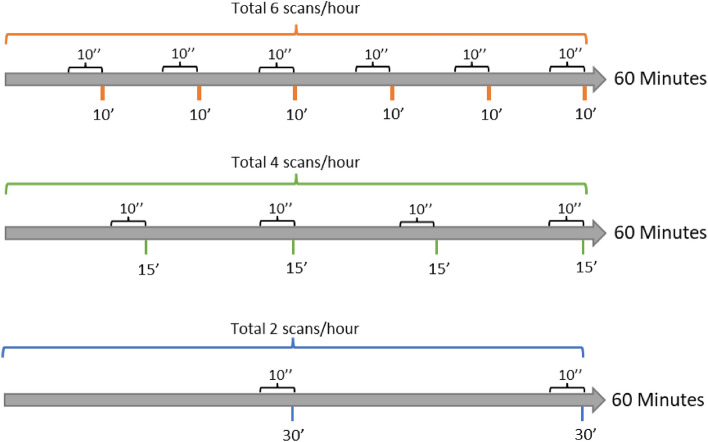
The use of the scan-sampling method, especially when a large amount of data is collected, has become widespread in behavioral studies. However, there are no specific guidelines regarding the choice of the sampling interval in different conditions. Thus, establishing a standard approach for video analysis represents an important step forward within the scientific community. In the present work, we hypothesized that the length of the sampling interval could influence the results of chicken behavioral study, for which we evaluated the reliability, accuracy, and validity of three different sampling intervals (10, 15 and 30 min). The Bland-Altman test was proposed as an innovative approach to compare sampling intervals and support researcher choices. Moreover, these sampling intervals were applied to compare the behavior of 4 chicken genotypes kept under free-range conditions. The Bland-Altman plots suggested that sampling intervals greater than 10 min lead to biases in the estimation of rare behaviors, such as "Attacking". In contrast, the 30-min sampling interval was able to detect differences among genotypes in high-occurrence behaviors, such as those associated with locomotory activity. Thus, from a practical viewpoint, when a broad characterization of chicken genotypes is required, the 30-min scan-sampling interval might be suggested as a good compromise between resources and results.
© 2023. Springer Nature Limited.
Conflict of interest statement
The authors declare no competing interests.
Figures
Similar articles
-
Validation of alternative behavioral observation methods in young broiler chickens.Poult Sci. 2019 Dec 1;98(12):6225-6231. doi: 10.3382/ps/pez475. Poult Sci. 2019. PMID: 31420656 Free PMC article.
-
Behavioral sampling techniques for feedlot cattle.J Anim Sci. 2001 May;79(5):1189-93. doi: 10.2527/2001.7951189x. J Anim Sci. 2001. PMID: 11374538
-
When continuous observations just won't do: developing accurate and efficient sampling strategies for the laying hen.Behav Processes. 2014 Mar;103:58-66. doi: 10.1016/j.beproc.2013.11.002. Epub 2013 Nov 22. Behav Processes. 2014. PMID: 24269639
-
Mass Spectrometry-Based Evaluation of the Bland-Altman Approach: Review, Discussion, and Proposal.Molecules. 2023 Jun 21;28(13):4905. doi: 10.3390/molecules28134905. Molecules. 2023. PMID: 37446566 Free PMC article. Review.
-
Sampling methods in behavior research.Poult Sci. 1992 Apr;71(4):643-9. doi: 10.3382/ps.0710643. Poult Sci. 1992. PMID: 1594516 Review.
Cited by
-
Laying hens prefer softer over harder mineral-based pecking stones and peck them more at the end of the light period.Poult Sci. 2025 Jan;104(1):104575. doi: 10.1016/j.psj.2024.104575. Epub 2024 Nov 22. Poult Sci. 2025. PMID: 39631273 Free PMC article.
-
Sequential Behavior of Broiler Chickens in Enriched Environments under Varying Thermal Conditions Using the Generalized Sequential Pattern Algorithm: A Proof of Concept.Animals (Basel). 2024 Jul 8;14(13):2010. doi: 10.3390/ani14132010. Animals (Basel). 2024. PMID: 38998121 Free PMC article.
References
-
- EC, European Commission. 2022. Farm to Fork strategy. https://ec.europa.eu/food/horizontal-topics/farm-forkstrategy_en. Accessed 24 Jan 2023.
Publication types
MeSH terms
LinkOut - more resources
Full Text Sources
