. 2023 Oct 11;13(1):17179.
doi: 10.1038/s41598-023-44384-0.

Mapping canopy traits over Québec using airborne and spaceborne imaging spectroscopy

Affiliations

Mapping canopy traits over Québec using airborne and spaceborne imaging spectroscopy

Thomas Miraglio et al. Sci Rep. .

Abstract

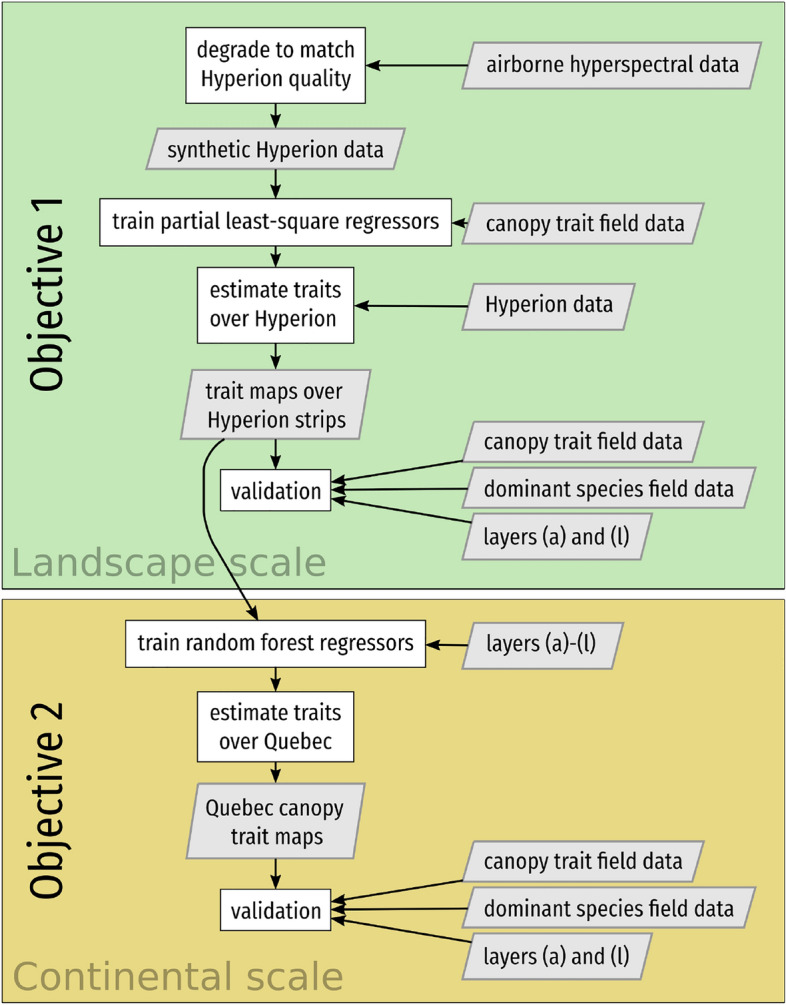
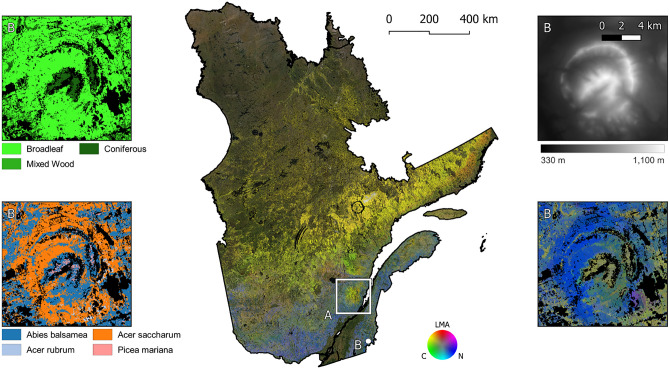
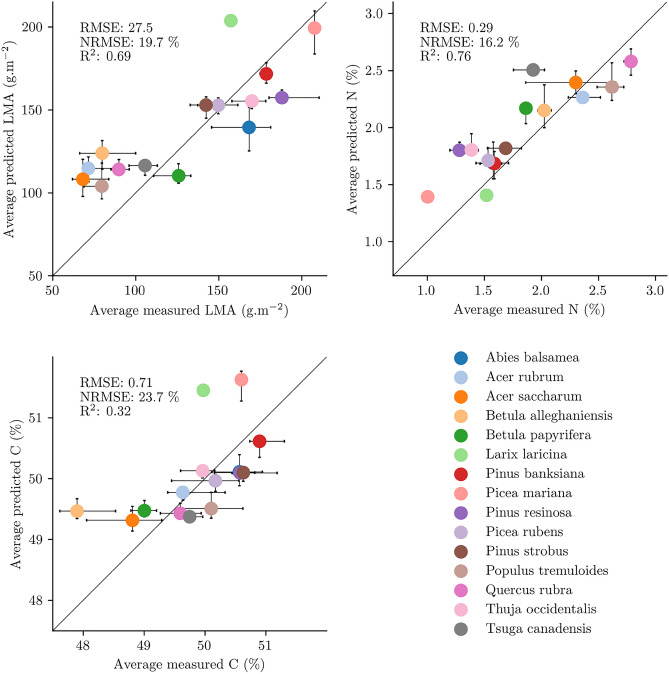
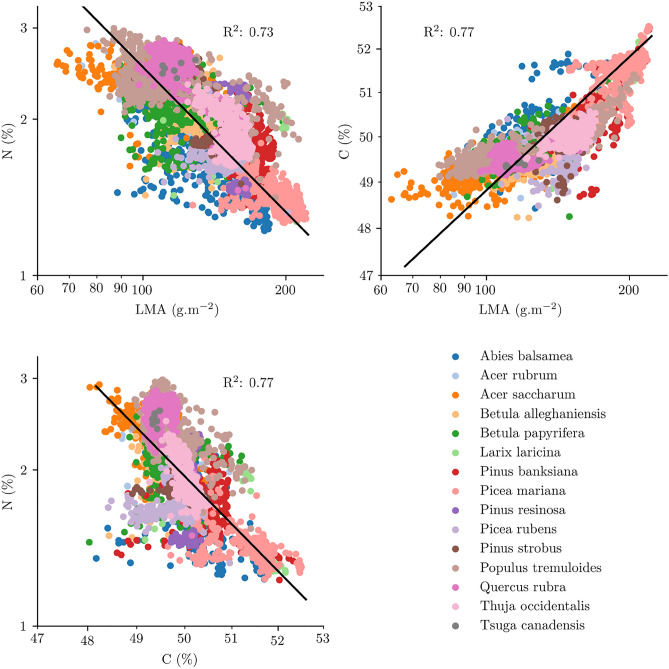
The advent of new spaceborne imaging spectrometers offers new opportunities for ecologists to map vegetation traits at global scales. However, to date most imaging spectroscopy studies exploiting satellite spectrometers have been constrained to the landscape scale. In this paper we present a new method to map vegetation traits at the landscape scale and upscale trait maps to the continental level, using historical spaceborne imaging spectroscopy (Hyperion) to derive estimates of leaf mass per area, nitrogen, and carbon concentrations of forests in Québec, Canada. We compare estimates for each species with reference field values and obtain good agreement both at the landscape and continental scales, with patterns consistent with the leaf economic spectrum. By exploiting the Hyperion satellite archive to map these traits and successfully upscale the estimates to the continental scale, we demonstrate the great potential of recent and upcoming spaceborne spectrometers to benefit plant biodiversity monitoring and conservation efforts.


Conflict of interest statement

The authors declare no competing interests.

Figures

Figure 1
Figure 1
Methodology followed in the present study to obtain Québec-wide canopy trait maps. Layers (a) to (l) are presented in Supplementary Table 1.
Figure 2
Figure 2
Landcover types of Quebec and the 25 Hyperion strips used in the present study overlaid in white. Each strip covers about 7.7 × 42 km. As the latitude increases, forests give way to taiga and tundra.
Figure 3
Figure 3
Comparison between the median trait value predicted by the models and the average value measured in the field for tree communities classified by their dominant species in the Hyperion images. The bars, when present, represent the 25th and 75th percentiles for the measured and predicted values.
Figure 4
Figure 4
Red–Green–Blue (RGB) colour composites of leaf mass per area (LMA, red), leaf carbon concentration (C, green) and leaf nitrogen concentration (N, blue) of Québec forests with a canopy cover above 30%. Zone A corresponds to the location of the Laurentide Wildlife Reserve, while zone B indicates Mont Mégantic. In the captions, from top left, clockwise: forest stand type, elevation, RGB composite of canopy traits, and dominant species over Mont Mégantic. In black, areas where canopy traits were not estimated due to low canopy cover or unavailable data.
Figure 5
Figure 5
Comparison between the median trait value predicted by the models and the average value measured in the field for tree communities classified by their dominant species in Québec. The bars, when present, represent the 25th and 75th percentiles for the measured and predicted values.
Figure 6
Figure 6
Correlations between the leaf mass per area, leaf nitrogen concentration, and leaf carbon concentration values estimated over Québec.

References

    1. Asner GP, Martin RE, Knapp DE, Tupayachi R, Anderson CB, Sinca F, Vaughn NR, Llactayo W. Airborne laser-guided imaging spectroscopy to map forest trait diversity and guide conservation. Science. 2017;355(6323):385–389. doi: 10.1126/science.aaj1987. - DOI - PubMed
    1. Laliberte E, Legendre P. A distance-based framework for measuring functional diversity from multiple traits. Ecology. 2010;91(1):299–305. doi: 10.1890/08-2244.1. - DOI - PubMed
    1. Schneider FD, Morsdorf F, Schmid B, Petchey OL, Hueni A, Schimel DS, Schaepman ME. Mapping functional diversity from remotely sensed morphological and physiological forest traits. Nat. Commun. 2017 doi: 10.1038/s41467-017-01530-3. - DOI - PMC - PubMed
    1. Ma S, He F, Tian D, Zou D, Yan Z, Yang Y, Zhou T, Huang K, Shen H, Fang J. Variations and determinants of carbon content in plants: A global synthesis. Biogeosciences. 2018;15(3):693–702. doi: 10.5194/bg-15-693-2018. - DOI
    1. Zhao H, Xu L, Wang Q, Tian J, Tang X, Tang Z, Xie Z, He N, Yu G. Spatial patterns and environmental factors influencing leaf carbon content in the forests and shrublands of China. J. Geograph. Sci. 2018;28(6):791–801. doi: 10.1007/s11442-018-1505-x. - DOI

Publication types