. 2023 Oct;622(7983):594-602.
doi: 10.1038/s41586-023-06583-7. Epub 2023 Oct 11.

Unraveling the functional dark matter through global metagenomics

Collaborators, Affiliations

Unraveling the functional dark matter through global metagenomics

Georgios A Pavlopoulos et al. Nature. 2023 Oct.

Abstract

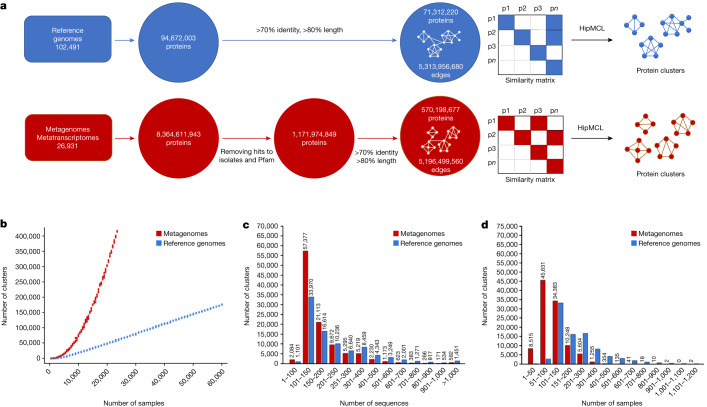
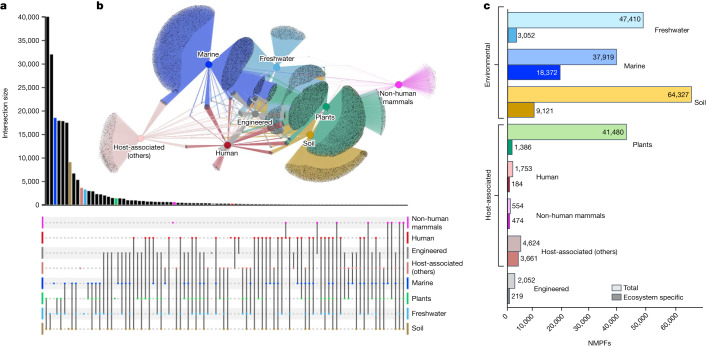
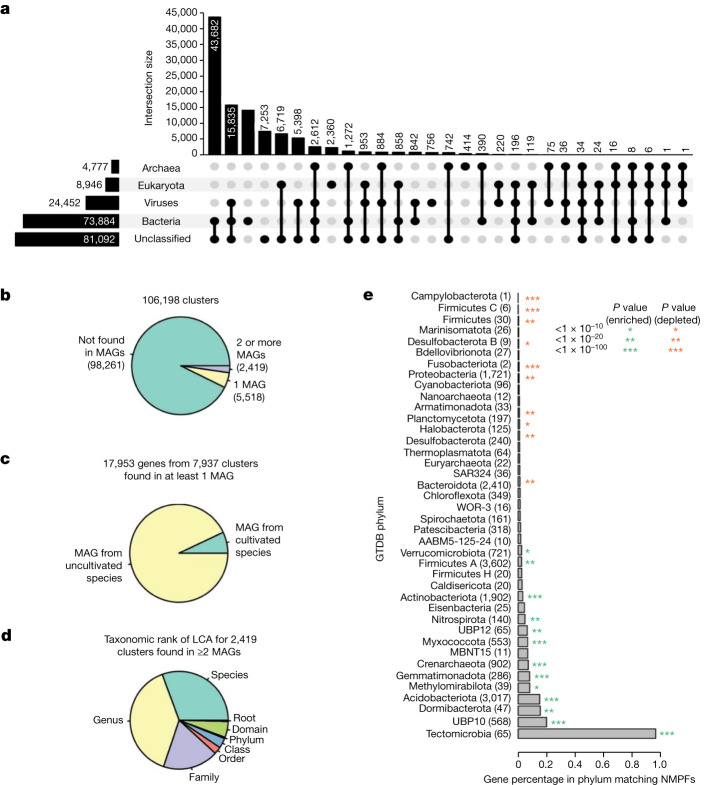
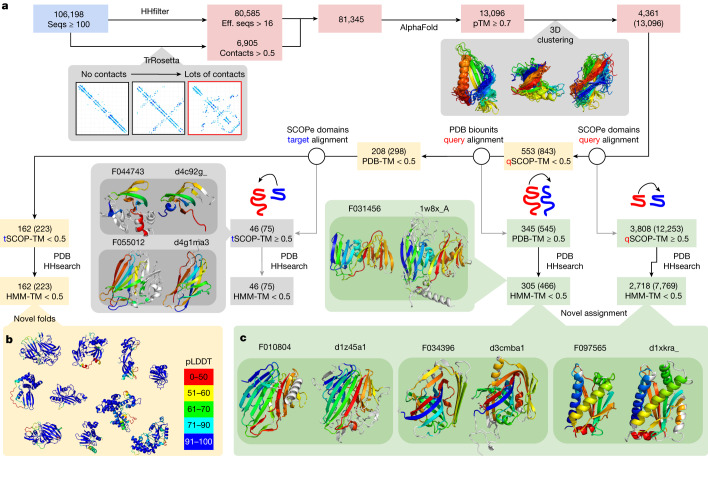
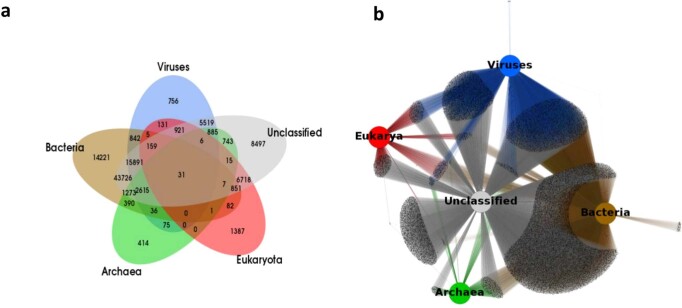
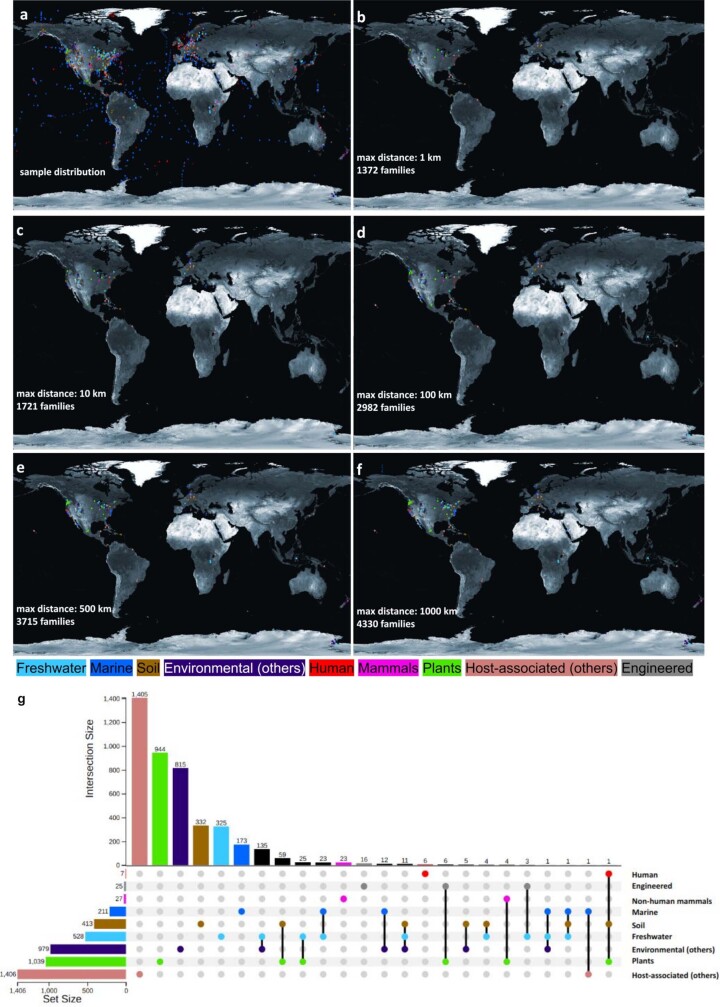
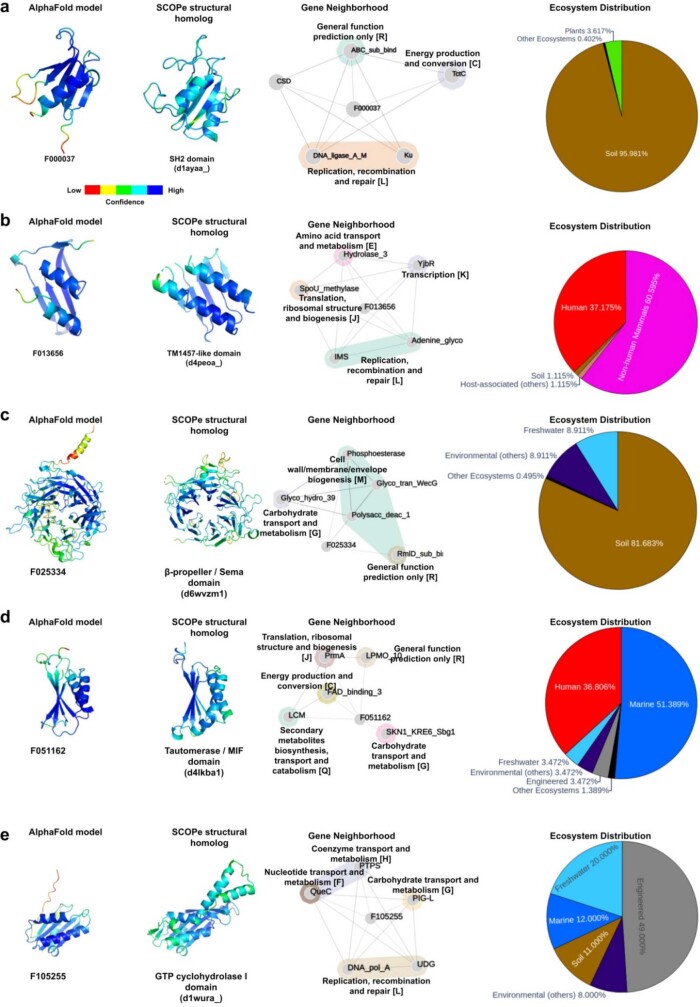
Metagenomes encode an enormous diversity of proteins, reflecting a multiplicity of functions and activities1,2. Exploration of this vast sequence space has been limited to a comparative analysis against reference microbial genomes and protein families derived from those genomes. Here, to examine the scale of yet untapped functional diversity beyond what is currently possible through the lens of reference genomes, we develop a computational approach to generate reference-free protein families from the sequence space in metagenomes. We analyse 26,931 metagenomes and identify 1.17 billion protein sequences longer than 35 amino acids with no similarity to any sequences from 102,491 reference genomes or the Pfam database3. Using massively parallel graph-based clustering, we group these proteins into 106,198 novel sequence clusters with more than 100 members, doubling the number of protein families obtained from the reference genomes clustered using the same approach. We annotate these families on the basis of their taxonomic, habitat, geographical and gene neighbourhood distributions and, where sufficient sequence diversity is available, predict protein three-dimensional models, revealing novel structures. Overall, our results uncover an enormously diverse functional space, highlighting the importance of further exploring the microbial functional dark matter.


Conflict of interest statement

The authors declare no competing interests.

Figures

Fig. 1
Fig. 1. Sequence clustering overview.
a, Clustering proteins from the reference genome (blue) and ED (red) datasets. b, Rarefaction curves of protein clusters for reference genome (blue) and ED (red) datasets. c,d, Bar chart visualization and comparison of cluster components per cluster for the number of sequences (c) and the number of genome or ED samples (d).
Fig. 2
Fig. 2. Ecosystem analysis of NMPFs.
a, UpSet plot representation of protein clusters overlapping across the eight ecosystem types. The various intersections among different categories are represented by the chart at the bottom, with each category shown as a dot and intersecting categories connected by straight lines. The sizes of the intersection sets are represented by the vertical bar chart. Intersection sets of 15 NMPFs or higher are shown. b, Network representation of the protein clusters and their ecosystems. Eight ecosystem types were applied according to the GOLD ecosystem classification, represented by central, coloured nodes (hubs), whereas the grey peripheral nodes represent the protein clusters. The edges represent the protein cluster–ecosystem associations. c, The distribution of total versus ecosystem-type-specific NMPFs across the eight different ecosystem types.
Fig. 3
Fig. 3. Taxonomic composition and occurrence of NMPFs in bacterial and archaeal MAGs.
a, UpSet plot showing the domain-level taxonomic distribution of novel protein clusters. The total size of each taxonomic category is represented through the horizontal bar chart on the left. The intersections among categories are represented by the chart at the bottom, with sizes of the intersections represented by the vertical bar chart at the top. b,c, We determined whether NMPFs were found on scaffolds from the GEM catalogue (b) and whether they were found on scaffolds from one or more cultivated species (c). d, The taxonomic rank of the lowest common ancestor (LCA) for 2,419 clusters found in at least 2 MAGs. e, The percentage of genes matching a cluster from MAGs assigned to different phyla. The asterisks indicate significant P values from a hypergeometric test. Green, clusters enriched in the phylum; red, clusters depleted from the phylum. The number of genes matching clusters is indicated in parenthesis next to the phylum name.
Fig. 4
Fig. 4. Structural characterization of the NMPFs.
a, Protein clusters with at least 16 effective sequences (eff. seqs) or many contacts were submitted to AlphaFold. The results were filtered to include structures with high predicted confidence (pTM ≥ 0.70), which were then clustered on the basis of pairwise TM-score calculation. All of the subsequent steps of the workflow display the number of unique clusters followed by the total number of NMPFs in parentheses. As filtering was performed at the NMPF level, only the numbers in parentheses will sum, as it is possible for members of the same cluster to fall on different sides of each TM-score filtering step. Each predicted structure was aligned against SCOPe domains. Models with no hits to SCOPe were further aligned and filtered if there were any hits to full PDB assemblies or one of the SCOPe domains aligned to at least 50% of the predicted structure. The domains (from SCOPe matches) or multi-domain (from PDB matches) were further screened using HHsearch against the PDB. The PDB of the top hit was compared to the prediction. b, Models with no significant hits to either SCOPe or PDB were considered to be potential novel folds. pLDDT, per-residue confidence score. c, Models with hits to either SCOPe domains or PDB biological assemblies with no significant HHsearch hits (HMM-TM-score < 0.5) were considered to be novel assignments.
Extended Data Fig. 1
Extended Data Fig. 1. Distribution of NMPF clusters across the eight ecosystem types.
(a) Circos Plot. The distribution of the ecosystems is presented in a chord-like circular diagram. The rim of the diagram represents the total size of the ecosystem types (i.e. number of NMPFs in each ecosystem), with the numbers outside the rim indicating the size scale. The intersections of categories are represented by arcs drawn between them. The size of the arc is proportional to the importance of the flow. (b) 8×8 matrix. Each cell in the matrix presents the common NMPFs in a binary combination of two ecosystems (e.g. 17,442 NMPFs are common among Marine and Freshwater ecosystems). The diagonal of the matrix displays the ecosystem-specific NMPFs. Each ecosystem column is coloured using the same colour code as Fig. 2, with the brightness of each cell being proportional to the NMPF number (brighter colour = less NMPFs).
Extended Data Fig. 2
Extended Data Fig. 2. Distribution of NMPF clusters across the sub-categories of the Freshwater (top) and Marine (bottom) aquatic ecosystems.
Data are shown as circos plots (a,d), colour-coded matrices (b,e) and UpSet plots (c,f).
Extended Data Fig. 3
Extended Data Fig. 3. Distribution of NMPF clusters across the sub-categories of the Soil (top) and Plant (bottom) ecosystems.
Data are shown as circos plots (a,d), colour-coded matrices (b,e) and UpSet plots (c,f).
Extended Data Fig. 4
Extended Data Fig. 4. Distribution of NMPF clusters across the sub-categories of the Non-human mammal (top) and Other Host-associated (bottom) ecosystems.
Data are shown as circos plots (a,d), colour-coded matrices (b,e) and UpSet plots (c,f).
Extended Data Fig. 5
Extended Data Fig. 5. Distribution of NMPF clusters across the sub-categories of the Human tissue (top) and Engineered (bottom) ecosystems.
Data are shown as circos plots (a,d), colour-coded matrices (b,e) and UpSet plots (c,f).
Extended Data Fig. 6
Extended Data Fig. 6. Distribution of NMPF clusters across different taxa (bacteria, archaea, eukarya, viruses, and unclassified).
(a) Venn Diagram, displaying the intersections among the different taxonomy categories. (b) Network representation of the protein clusters and their taxonomic assignments. The taxa are represented by central, coloured nodes (hubs) whereas the grey peripheral nodes represent the protein clusters.
Extended Data Fig. 7
Extended Data Fig. 7. Geographical distribution of the ED samples and NMPFs.
(a) Locations for all ED samples in the study with available geo-location metadata (Longitude and Latitude). (b-f) Distribution of geographically-isolated NMPF clusters, based on a cut-off distance of 1, 10, 100, 500, and 1000 Km. In all cases, dots are coloured based on the ecosystem type (blue: marine, cyan: freshwater, brown: soil, purple: other environmental, green: plants, red: human, magenta: non-human mammals, salmon pink: other host-associated, grey: engineered). (g) UpSet plot showing the distribution of the geographically-isolated NMPF clusters, based on a cut-off distance of 1000 Km (as shown in panel f). Map panels were created using data from the Natural Earth dataset (www.naturalearthdata.com).
Extended Data Fig. 8
Extended Data Fig. 8. Functional annotation of NMPFs with remote structural homologues.
Five example NMPFs (a-e) are shown. Annotation is performed using using structural information (left), gene co-occurrence analysis (middle), and ecosystem distribution (right). Each of the NMPFs has a high-quality 3D model with at least one remote structural homologue to SCOPe. The NMPFs’ 3D models, produced with AlphaFold, and the structures of the SCOPe domains are rendered in the same orientation and coloured based on their per-residue structure confidence (pLDDT for AlphaFold models and inverse B-factor for experimental structures). The gene neighbourhood of each NMPF is presented in the form of an association network; with nodes representing gene products (the NMPFs and their adjacent genes that encode Pfam domains) and edges representing co-occurrence in the same sequencing scaffold. Pfam domains are further grouped using their associated COG functional categories as annotation. Finally, the NMPFs’ associated ecosystems are presented in pie charts. Ecosystems with a <1% presence in the NMPFs are summed into the category “Other ecosystems”.
Extended Data Fig. 9
Extended Data Fig. 9. Putative functional annotation of NMPFs with potential novel structural folds.
Three example NMPFs (a-c) are shown. The produced AlphaFold 3D model (left), gene co-occurrence analysis (middle) and ecosystem distribution (right) are given. 3D models are coloured based on their per-residue structure confidence (pLDDT). The gene neighbourhood of each NMPF is presented in the form of an association network; with nodes representing gene products (the NMPFs and their adjacent genes that encode Pfam domains) and edges representing co-occurrence in the same sequencing scaffold. Pfam domains are further grouped using their associated COG functional categories as annotation. Finally, the NMPFs’ associated ecosystems are presented in pie charts. Ecosystems with a <1% presence in the NMPFs are summed into the category “Other ecosystems”.

References

    1. New FN, Brito IL. What is metagenomics teaching us, and what is missed? Annu. Rev. Microbiol. 2020;74:117–135. doi: 10.1146/annurev-micro-012520-072314. - DOI - PubMed
    1. Rinke C, et al. Insights into the phylogeny and coding potential of microbial dark matter. Nature. 2013;499:431–437. doi: 10.1038/nature12352. - DOI - PubMed
    1. Mistry J, et al. Pfam: the protein families database in 2021. Nucleic Acids Res. 2021;49:D412–D419. doi: 10.1093/nar/gkaa913. - DOI - PMC - PubMed
    1. Meyer F, et al. MG-RAST version 4—lessons learned from a decade of low-budget ultra-high-throughput metagenome analysis. Brief. Bioinform. 2019;20:1151–1159. doi: 10.1093/bib/bbx105. - DOI - PMC - PubMed
    1. Ayling M, Clark MD, Leggett RM. New approaches for metagenome assembly with short reads. Brief. Bioinform. 2020;21:584–594. doi: 10.1093/bib/bbz020. - DOI - PMC - PubMed

Publication types