. 2023 Oct;622(7984):842-849.
doi: 10.1038/s41586-023-06615-2. Epub 2023 Oct 11.

Ultra-fast deep-learned CNS tumour classification during surgery

Affiliations

Ultra-fast deep-learned CNS tumour classification during surgery

C Vermeulen et al. Nature. 2023 Oct.

Abstract

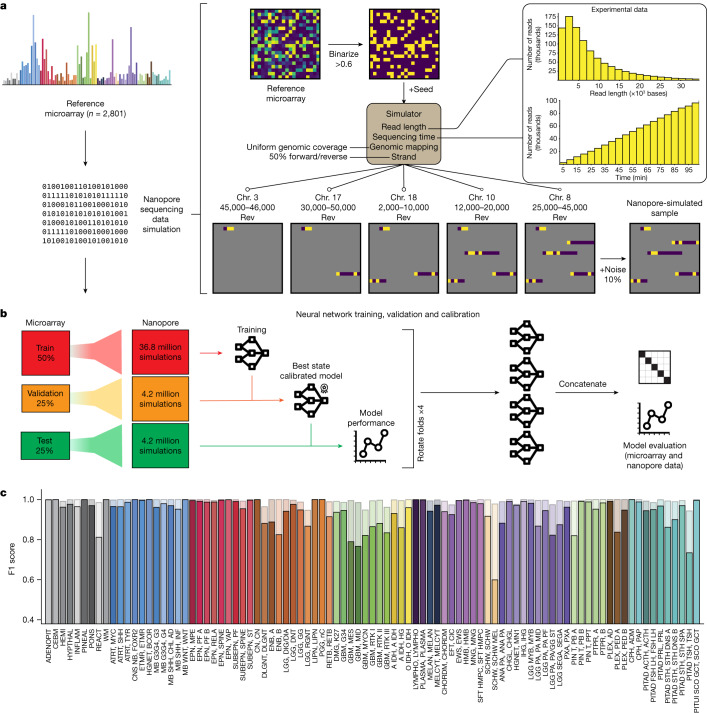
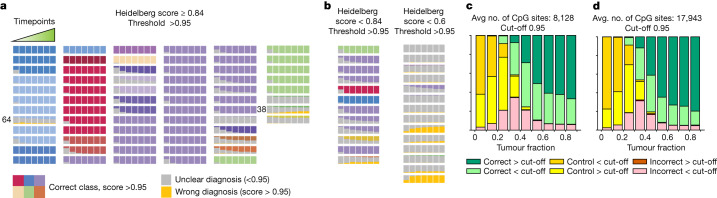
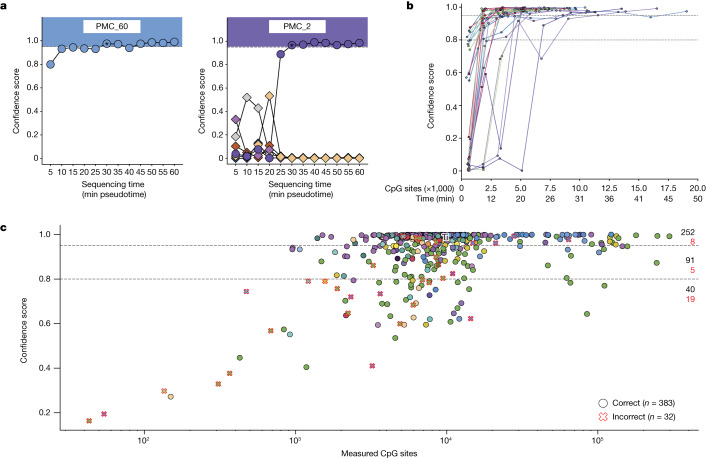
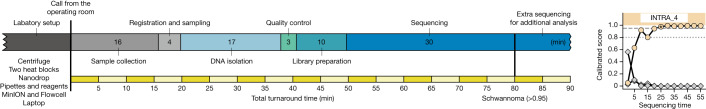
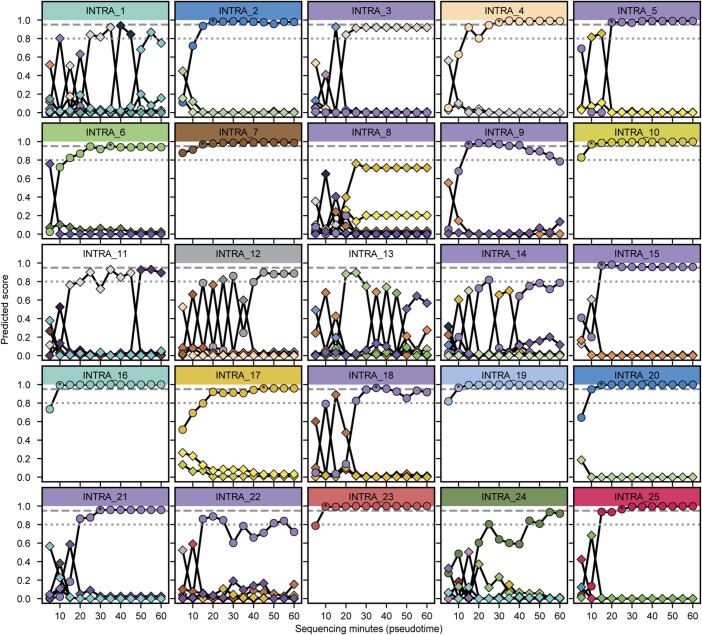
Central nervous system tumours represent one of the most lethal cancer types, particularly among children1. Primary treatment includes neurosurgical resection of the tumour, in which a delicate balance must be struck between maximizing the extent of resection and minimizing risk of neurological damage and comorbidity2,3. However, surgeons have limited knowledge of the precise tumour type prior to surgery. Current standard practice relies on preoperative imaging and intraoperative histological analysis, but these are not always conclusive and occasionally wrong. Using rapid nanopore sequencing, a sparse methylation profile can be obtained during surgery4. Here we developed Sturgeon, a patient-agnostic transfer-learned neural network, to enable molecular subclassification of central nervous system tumours based on such sparse profiles. Sturgeon delivered an accurate diagnosis within 40 minutes after starting sequencing in 45 out of 50 retrospectively sequenced samples (abstaining from diagnosis of the other 5 samples). Furthermore, we demonstrated its applicability in real time during 25 surgeries, achieving a diagnostic turnaround time of less than 90 min. Of these, 18 (72%) diagnoses were correct and 7 did not reach the required confidence threshold. We conclude that machine-learned diagnosis based on low-cost intraoperative sequencing can assist neurosurgical decision-making, potentially preventing neurological comorbidity and avoiding additional surgeries.


Conflict of interest statement

J.d.R., M.P.-G. and CV are inventors on a patent covering the development of Sturgeon. J.d.R. is co-founder and director of Cyclomics, a genomics company. L.K., M.E.G.K., P.W., N.V., P.d.W.H., E.J.K., L.D., J.v.d.L., K.v.B., E.W.H. and B.B.J.T. declare no competing interests.

Figures

Fig. 1
Fig. 1. Schematic representation of the simulation, cross-validation approach and results on simulated data.
a, Nanopore sequencing runs were simulated from the Capper et al. reference dataset comprising 2,801 labelled methylation profiles from CNS tumour and control samples. Sequencing data were simulated on the basis of existing nanopore sequencing runs (read length distribution and throughput); as these simulations produce very sparse samples, millions of unique samples can be simulated. Chr. chromosome. b, Fourfold cross-validation was performed by rotating the folds to obtain four models that were used in the final prediction of external microarray data and nanopore sequencing data. c, Performance of Sturgeon on the four test folds of the Capper et al. dataset (added up for the four submodels). F1 scores for each reference label at 40 min of simulated sequencing (approximately 97% missing values compared with microarray data). Solid bars indicate the F1 score for the highest-scoring class and transparent bars show the F1 score for the top three highest-scoring classes. Complete class names, adapted from Capper et al., can be found in Supplementary Table 2.
Fig. 2
Fig. 2. Classification performance over time on nanopore runs simulated from paediatric CNS tumour methylation arrays.
ad, For each of 94 methylation profiles, 500 experiments were simulated per timepoint, corresponding to approximately 12.5 min of additional sequencing per consecutive timepoint (Methods). a, Each series of bars corresponds to one of the 68 cases for which a clear Heidelberg classifier result was obtained (Heidelberg score >0.84). Bars indicate at each timepoint the proportion of outcomes when a 0.95 confidence score is used. The correct fraction is coloured by class; colours correspond to those in Fig. 1c. Unclear (no class reached a confidence score ≥0.95 or a control class reached a confidence score ≥0.95) classifications are shown in grey, wrong classes with a confidence score ≥0.95 are yellow. b, As a, but for the 26 samples for which the Heidelberg classifier was inconclusive (Heidelberg score <0.84; unclear cases). c, Stacked bar graph to show the effect of different tumour fractions on classifier performance on short sequencing simulations (8,128 CpG sites covered on average, equivalent to roughly 20 min of sequencing). Nanopore sequencing experiments were simulated from the reference samples from the Capper et al. dataset. The reported sample purity was used as a baseline and control tissue reads were added to simulate lower sample purities. The fraction of correct and incorrect classifications over or under the confidence threshold (≥0.95) are shown, as well as the number of simulations where the classifier predicted the sample as control tissue. Avg., average. d, same as c, with a higher sequencing depth (17,943 CpG sites covered on average, equivalent to approximately 40 min of sequencing).
Fig. 3
Fig. 3. Sturgeon applied to nanopore-sequenced samples.
a, Two representative examples of Sturgeon classification on nanopore-sequenced samples. The x axis indicates the sequencing time (5-min pseudotime intervals) and the y axis indicates the confidence score. Circles indicate the confidence score of the correct class; diamonds indicate the confidence score of incorrect classes (classes with averaged scores lower than 0.1 are omitted). Asterisks indicate the first timepoint at which the confidence score of the correct class was higher than 0.95. b, Sturgeon classification scores for 27 paediatric CNS tumour samples at increasing sequencing time (5-min pseudotime intervals). Only the confidence score of the correct class is plotted; see Extended Data Fig. 5 for complete results for each sample. c, Sturgeon classification results on the publicly available data from Kuschel et al. (415 sequencing runs). Samples for which the highest-scoring class is correct are indicated as circles and samples for which the highest-scoring class is incorrect are shown as crosses. Points are filled on the basis of the correct class according to the colour scheme shown in Fig. 1c.
Fig. 4
Fig. 4. Intraoperative sequencing turnaround time.
Timeline for surgery and intraoperative sample analysis for INTRA_4 (Supplementary Videohttps://zenodo.org/record/8261128), with the turnaround time and required time per processing step indicated (in minutes). Circles indicate the confidence score of the correct class; diamonds indicate the confidence score of incorrect classes (classes with averaged confidence scores lower than 0.1 are omitted). The asterisk indicates the first timepoint at which the score of the correct class was higher than 0.95.
Fig. 5
Fig. 5. Adaptive sampling can reduce turnaround time.
a, Five samples were run with adaptive sampling on half of the available channels. Box plots indicate the number of 450K array CpG probe sites during sequencing, normalized to the amount of available sequencing channels; minimum and maximum bounds represent the 25th and 75th percentiles, respectively; and the center bound represents the median; whiskers extend to 1.5 times the interquartile range. Dots indicate the underlying data. b, Robustness analysis results of sample PMC 68 on adaptive (left) and non-adaptive (right) channels (results for all samples are presented in Supplementary Fig. 24). Reads were accumulated in resampled orders (n = 100) at a rate based on the average MinION sequencing speed. Sturgeon was then applied to all permutations. Colours indicate the type of prediction made by Sturgeon: plain colour (correct class and score ≥0.95), darkened colour (correct class and score <0.95) and grey (incorrect class and score <0.95).
Extended Data Fig. 1
Extended Data Fig. 1. Neural network architecture and optimization scheme.
This schematic representation shows the architecture of Sturgeon neural networks. Each network consists of one input layer and three fully connected layers. The input layer represents the 428,643 CpG sites as individual nodes. The two hidden layers consist of 256 and 128 nodes and in the final layer each tumor class is represented as an output node. Validation folds are used for temperature scaling and a final softmax scaling is applied to scale the sum of all output nodes to 1.
Extended Data Fig. 2
Extended Data Fig. 2. Sturgeon performance at 40 min of simulated sequencing.
a, Confusion matrix showing the highest scoring class for each reference label at 40 min of simulated sequencing (∼97% missing values from microarray data) b, Confusion matrix and F1 scores at 40 min of simulated sequencing when scores are aggregated on the family level. c, F1 scores at different sequencing depths (represented by the average number of covered 450 K array methylation sites) when classifying by subclass, by the correct subclass being in the top 3 of highest scoring classes and at the family level. Box plot minimum and maximum bounds represent the 25th and 75th percentiles, respectively, and the center bound represents the median. Whiskers extend to 1.5 times the interquartile range d, True positive rate for each subclass at 40 min of sequencing at the 0.95 confidence threshold. Asterisks indicate subclasses that do not reach the 0.95 true positive rate.
Extended Data Fig. 3
Extended Data Fig. 3. Classification performance over time on nanopore runs simulated from pediatric CNS tumor methylation arrays.
For each of 96 methylation profiles, a series of nanopore sequencing experiments were simulated. At each timepoint 500 experiments were simulated corresponding to approximately 5 min of sequencing per timepoint. Each bar indicates a consecutive timepoint and simulated sequencing data is accumulated over time. A stacked bar graph is plotted based on the number of correct, unclear or wrong classifications. Correct classifications are those with a confidence score >0.95 (left) and >0.8 (right) and with a class corresponding to the true diagnosis (bars are colored according to the class label). Unclear classifications are those with confidence-scores <0.95 or <0.8 colored in gray). Wrong classifications are misdiagnoses where a confidence-score >0.95 or >0.8 is obtained for the incorrect class (colored in yellow). a Clear diagnosis group (Heidelberg classifier score >0.84). b Difficult diagnosis group (Heidelberg classifier score <0.84). c Distribution of the number of CpG sites covered at each simulated timepoint.
Extended Data Fig. 4
Extended Data Fig. 4. Sample purity simulation results.
a, Histogram showing the reported sample purity in the Capper et al. training dataset. b, Due to the inherent sample purity, the number of samples where high purity can be simulated is limited. This histogram shows the number of used simulations at each purity level. c and d barplots showing the simulation results at a 0.95 (c) or 0.8 (d) cutoff at different sequencing depths (represented by the average number of 450 K CpG sites covered.). Bars are colored by correct and confident (score above cutoff) outcomes, correct but low confidence outcomes (highest scoring class is correct, but the score is below the confidence threshold), high and low confidence control outcomes (the highest scoring class is one of the control classes), and wrong outcomes where an incorrect class scores highest below or above the confidence threshold.
Extended Data Fig. 5
Extended Data Fig. 5. Retrospective nanopore sequencing results.
Sturgeon confidence scores for 27 pediatric CNS tumor samples (duplicates indicated by appended “_1” to the sample name at increasing sequencing time (5 min pseudo time intervals). Top bar indicates the sample name. Circles indicate the predicted score of the correct class; diamonds indicate the predicted score of incorrect classes (classes with overtime averaged scores lower than 0.1 are omitted). Asterisks indicate the first time point where the score of the correct class was higher than 0.95. Horizontal line indicates the 0.95 threshold.
Extended Data Fig. 6
Extended Data Fig. 6. Robustness analysis results.
For each sample sequence reads were randomly sampled to reflect a nanopore run at a specific duration. 100 simulations were generated for each timepoint. Colored bars indicate correct outcomes above the confidence threshold (0.95), dashed colored bars indicate correct outcomes below the threshold, gray dashed bars indicate unclear outcomes and black bars indicate wrong outcomes above the treshold.
Extended Data Fig. 7
Extended Data Fig. 7. Copy Number Variations.
As a proof of principle we sequenced a retrospective Oligodendroglioma sample with a known 1p/19q codeletion. This sample was difficult to specify as an Astrocytoma or Oligodendroglioma based on methylation profile and histology (Supplementary Fig. 13). In such cases the 1p/19q codeletion offers strong supporting evidence for the Oligodendroglioma diagnosis. a, We sequenced this sample to 1.2 million reads, dots represent the normalized coverage (Methods) for 2 Mb bins, red lines indicate the DNAcopy segmentation result which clearly shows the 1p/19q codeletion. Bins that fall within segments with a log2 value < −0.5 are colored blue and bins that fall in segments > 0.5 are colored green. b and c, We then subsampled to 50,000 and 20.000 random reads and repeated the analysis; in both sequence depths the 1p deletion is clearly visible, and the 19q deletion is visible but less clearly defined. d and e, the segmentation results from 10 random downsamplings at a sequence depth of 20.000 and 50.000 sequence reads respectively. Red lines indicate the segmentation of the full dataset and blue dashed lines show the result of individual subsamplings.
Extended Data Fig. 8
Extended Data Fig. 8. Intraoperative sequencing results.
Sturgeon confidence scores over time for the 25 intraoperative sequencing experiments. Class corresponding to the integrated histomolecular diagnosis are shown in circles (with the exception of INTRA_24, where the highest scoring Heidelberg V11b4 class is indicated as a circle) and other classes are shown as diamonds. Headers are colored following the same style as described in the circles, with the exception of INTRA_11 (Germinoma, class not in the classifier) and INTRA_13 (exotic case) which are colored white.

Comment in

References

    1. Cohen AR. Brain tumors in children. N. Engl. J. Med. 2022;386:1922–1931. doi: 10.1056/NEJMra2116344. - DOI - PubMed
    1. Duffau H, Mandonnet E. The ‘onco-functional balance’ in surgery for diffuse low-grade glioma: integrating the extent of resection with quality of life. Acta Neurochir. 2013;155:951–957. doi: 10.1007/s00701-013-1653-9. - DOI - PubMed
    1. Yong RL, Lonser RR. Surgery for glioblastoma multiforme: striking a balance. World Neurosurg. 2011;76:528–530. doi: 10.1016/j.wneu.2011.06.053. - DOI - PMC - PubMed
    1. Djirackor L, et al. Intraoperative DNA methylation classification of brain tumors impacts neurosurgical strategy. Neurooncol. Adv. 2021;3:vdab149. - PMC - PubMed
    1. Karremann M, et al. Diffuse high-grade gliomas with H3 K27M mutations carry a dismal prognosis independent of tumor location. Neuro Oncol. 2018;20:123–131. doi: 10.1093/neuonc/nox149. - DOI - PMC - PubMed

Publication types

MeSH terms