. 2023 Oct;622(7984):818-825.
doi: 10.1038/s41586-023-06617-0. Epub 2023 Oct 11.

Learning from prepandemic data to forecast viral escape

Affiliations

Learning from prepandemic data to forecast viral escape

Nicole N Thadani et al. Nature. 2023 Oct.

Abstract

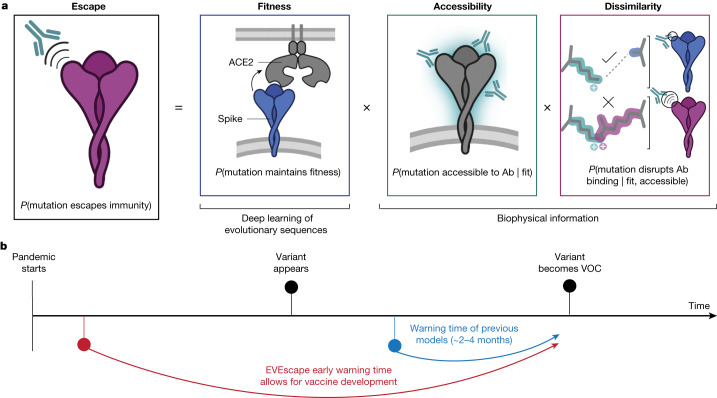
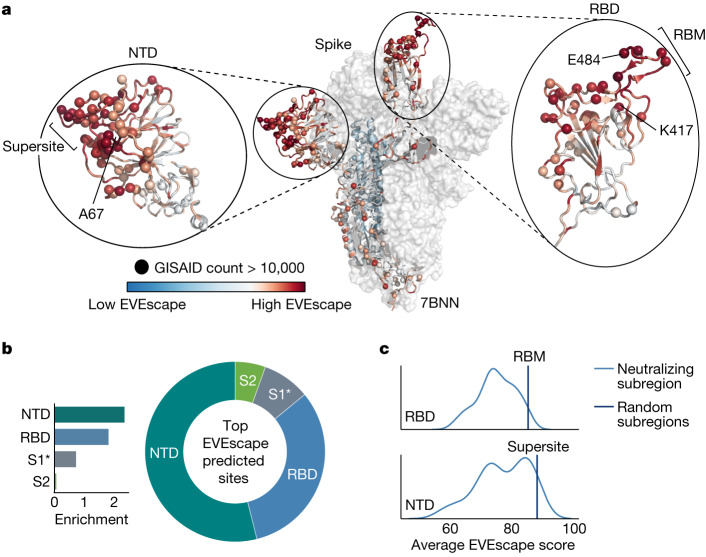
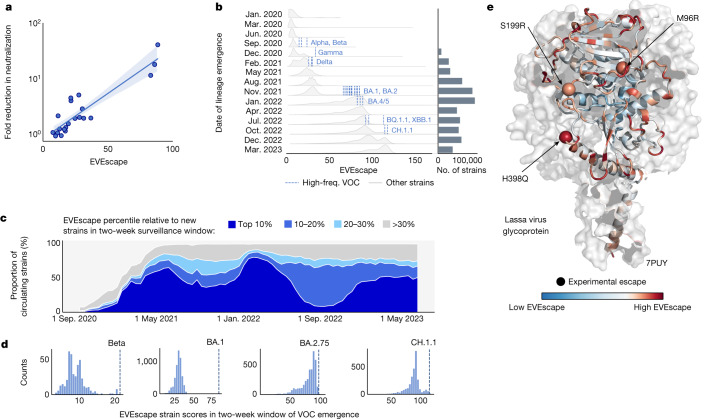
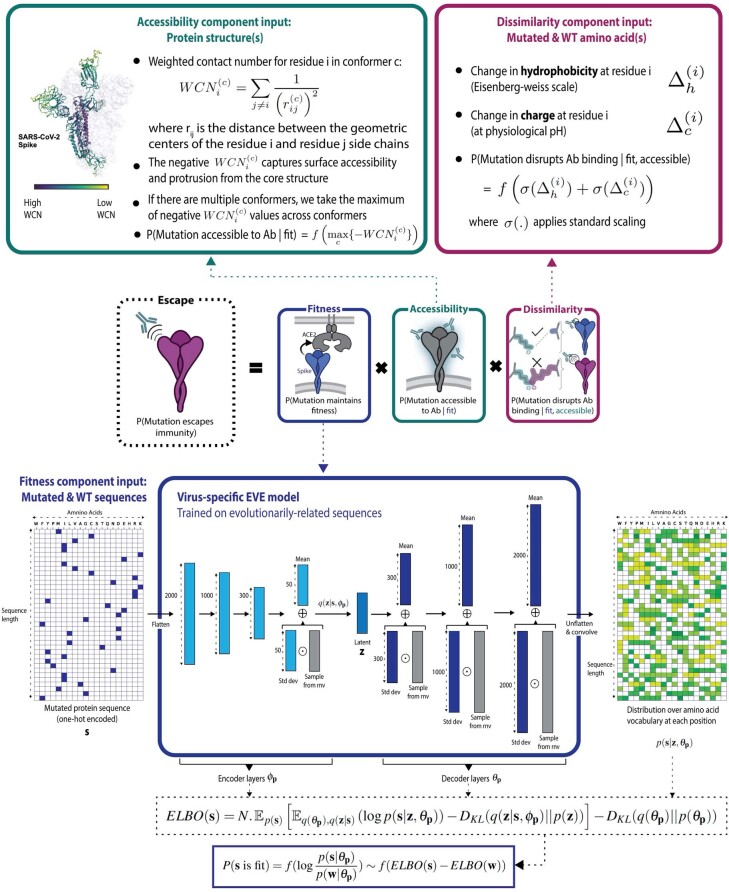
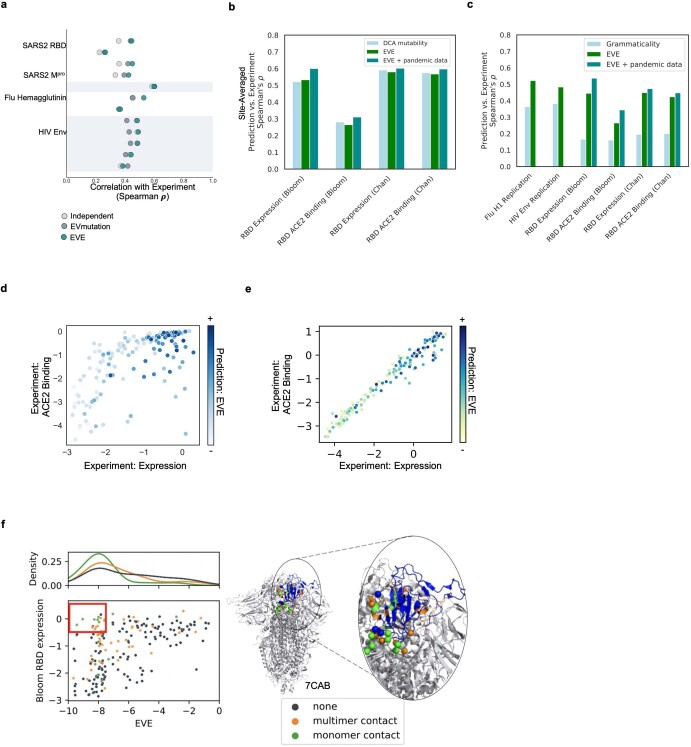
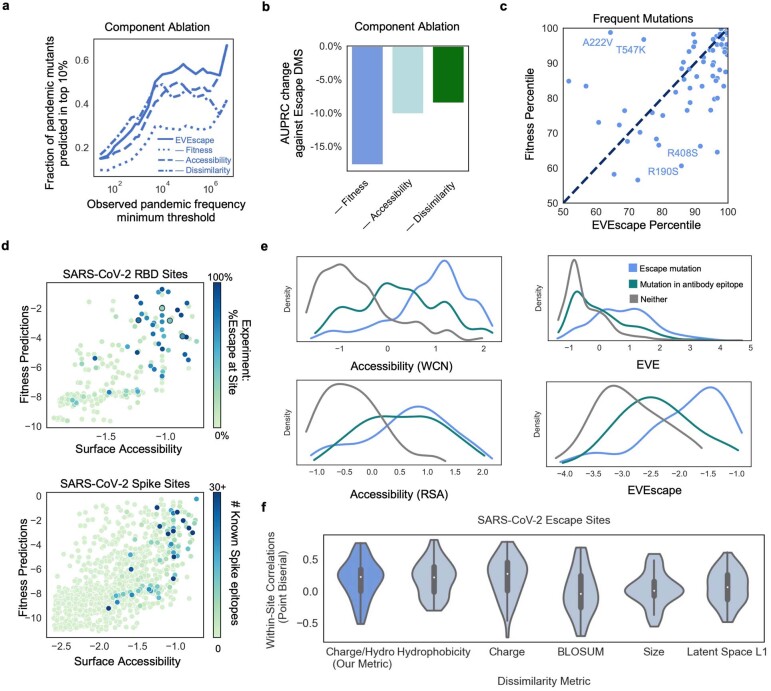
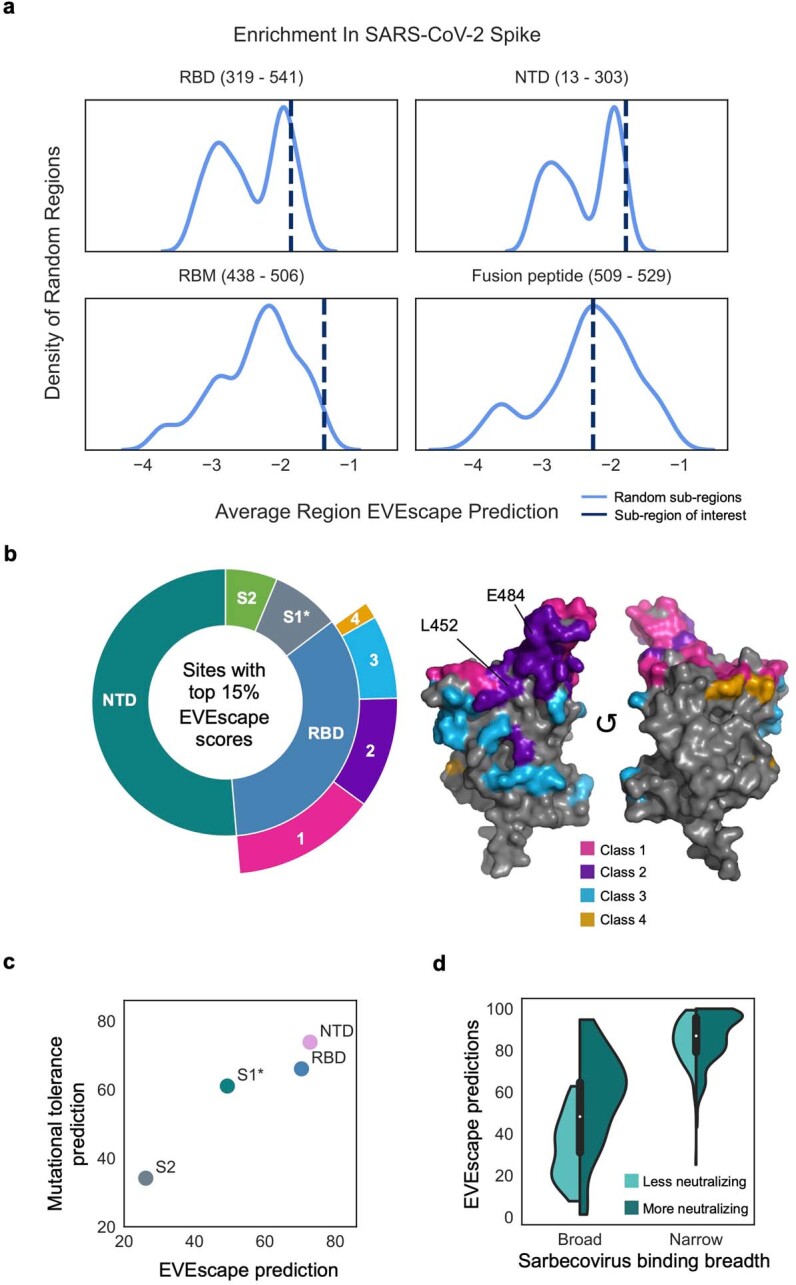
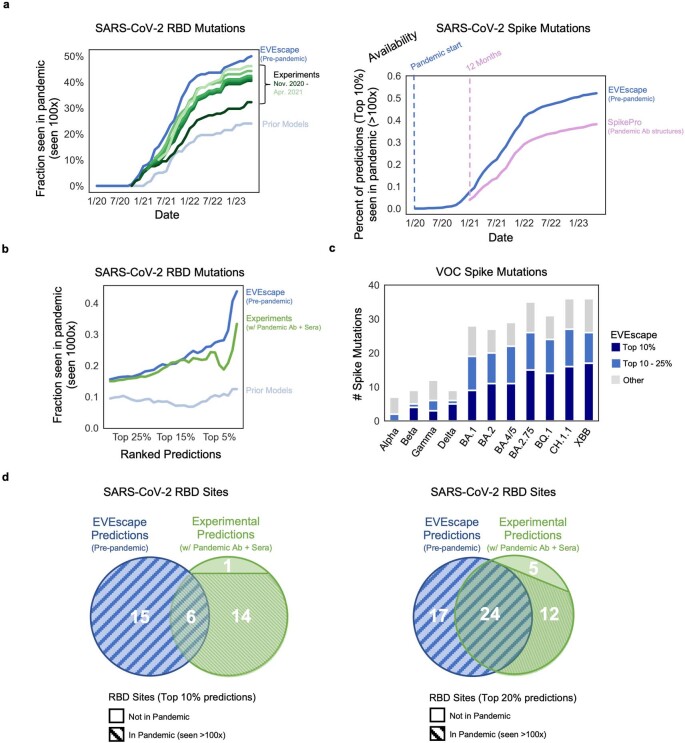
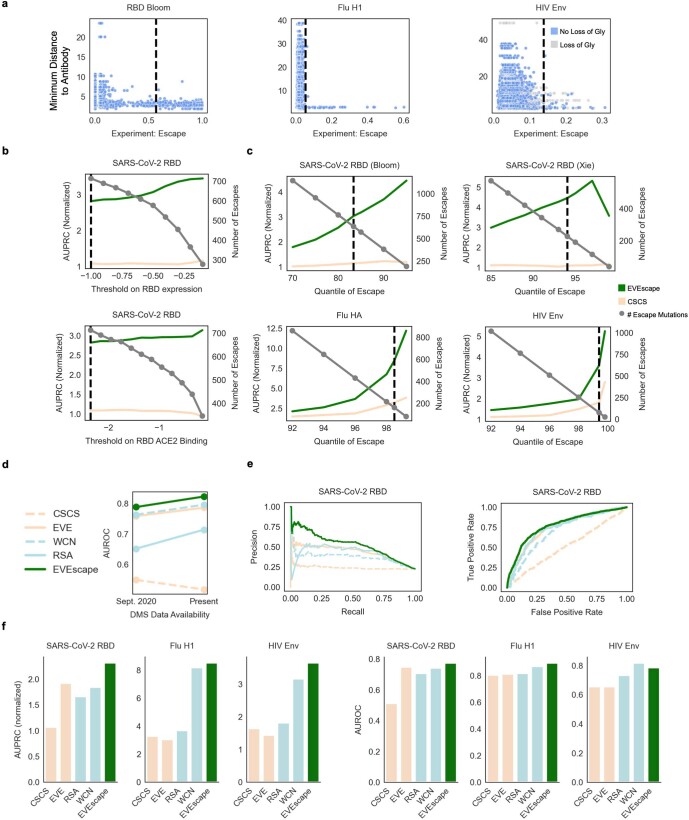
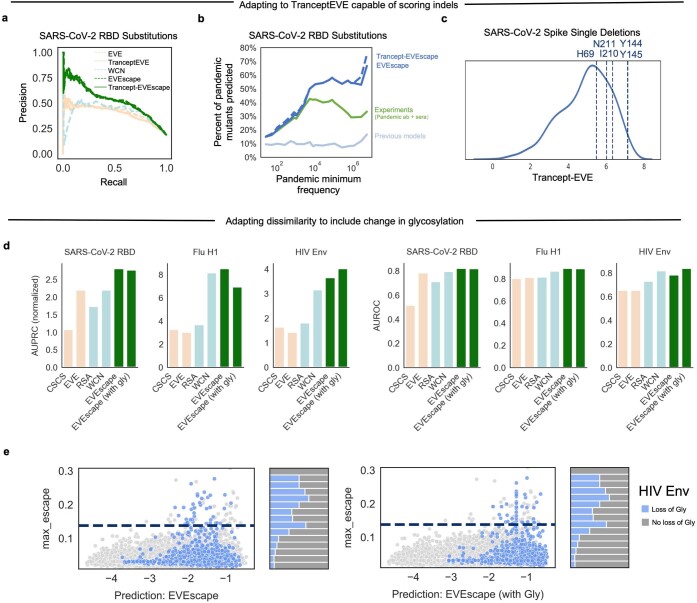
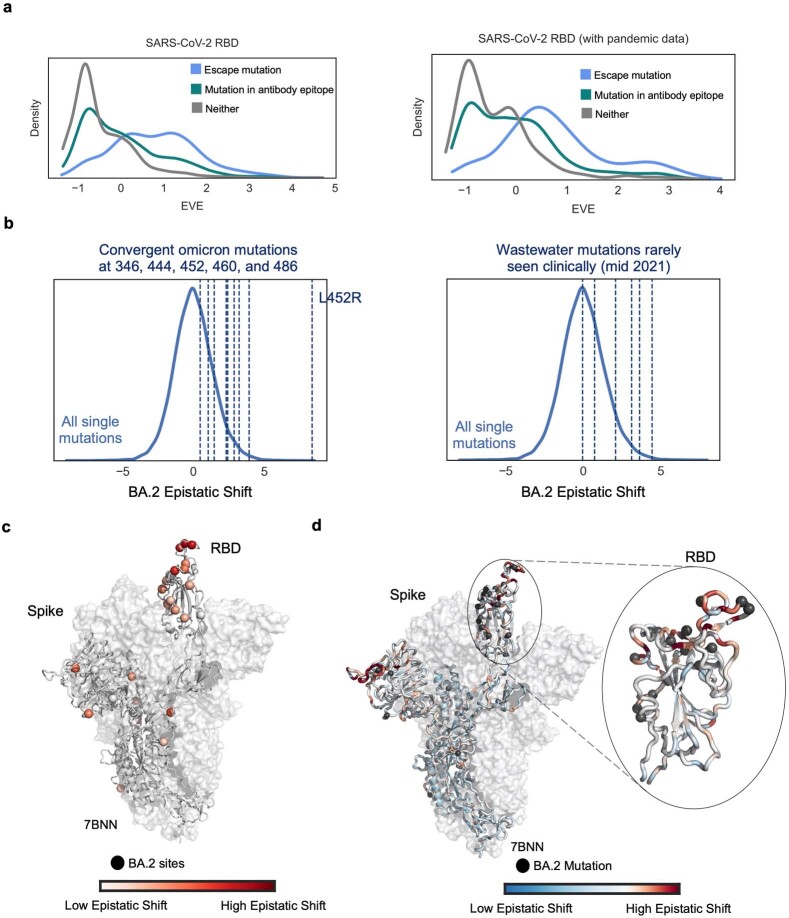
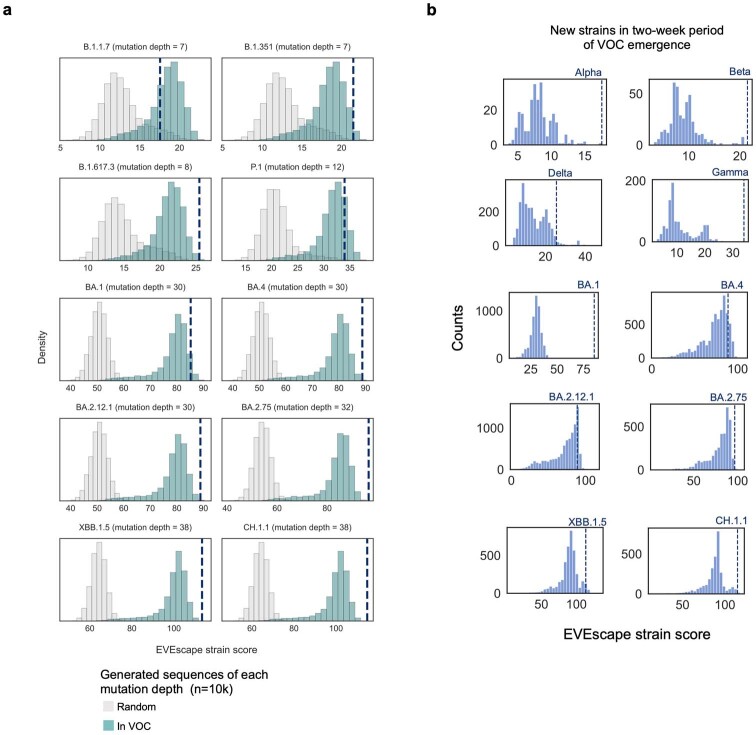
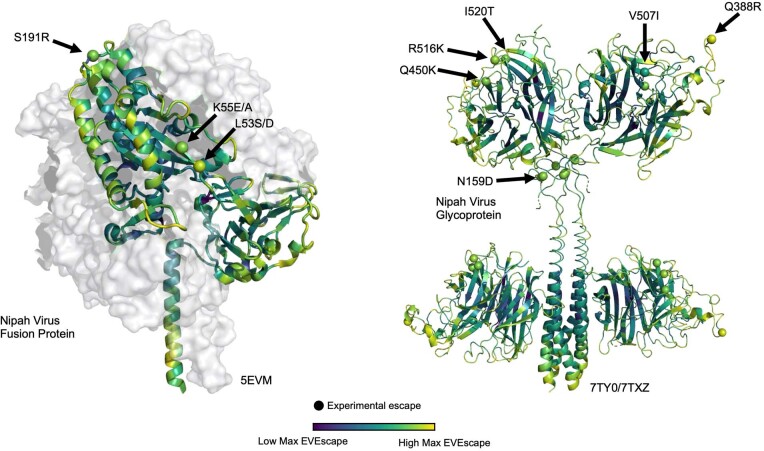
Effective pandemic preparedness relies on anticipating viral mutations that are able to evade host immune responses to facilitate vaccine and therapeutic design. However, current strategies for viral evolution prediction are not available early in a pandemic-experimental approaches require host polyclonal antibodies to test against1-16, and existing computational methods draw heavily from current strain prevalence to make reliable predictions of variants of concern17-19. To address this, we developed EVEscape, a generalizable modular framework that combines fitness predictions from a deep learning model of historical sequences with biophysical and structural information. EVEscape quantifies the viral escape potential of mutations at scale and has the advantage of being applicable before surveillance sequencing, experimental scans or three-dimensional structures of antibody complexes are available. We demonstrate that EVEscape, trained on sequences available before 2020, is as accurate as high-throughput experimental scans at anticipating pandemic variation for SARS-CoV-2 and is generalizable to other viruses including influenza, HIV and understudied viruses with pandemic potential such as Lassa and Nipah. We provide continually revised escape scores for all current strains of SARS-CoV-2 and predict probable further mutations to forecast emerging strains as a tool for continuing vaccine development ( evescape.org ).


Conflict of interest statement

D.S.M. is an advisor for Dyno Therapeutics, Octant, Jura Bio, Tectonic Therapeutic and Genentech and is a cofounder of Seismic Therapeutic. C.S. is an advisor for CytoReason Ltd. The remaining authors declare no competing interests.

Figures

Fig. 1
Fig. 1. Early prediction of antibody escape from deep generative sequence models, structural and biophysical constraints.
a, EVEscape assesses the likelihood of a mutation escaping the immune response on the basis of the probabilities of a given mutation maintaining viral fitness, occurring in an antibody epitope and disrupting antibody binding. b, EVEscape requires only information available early in a pandemic, before surveillance sequencing, antibody–antigen structures or experimental mutational scans are broadly available. This provides further early warning time critical for vaccine development. Ab, antibody. Panel a created with BioRender.com.
Fig. 2
Fig. 2. EVEscape identifies antigenic regions without antibody information.
a, EVEscape scores (site-level maximum) mapped onto a representative Spike three-dimensional structure (Protein Data Bank (PDB) identifier: 7BNN) highlight high-scoring regions with many observed pandemic variants, both in the RBD and in the NTD. Spheres indicate sites with a total number of mutations observed more than 10,000 times in the GISAID sequence database. b, The top decile of EVEscape predictions span diverse epitope regions across Spike, but most of the predictions are in the NTD and RBD, which have a disproportionately high number of predicted EVEscape sites relative to their sequence length (enrichment). The regions considered are NTD (sequence positions 14–306), RBD (319–542), S1* (543–685) and S2 (686–1273), where S1* refers to the region in S1 between RBD and the S2. c, Neutralizing subregions—RBM (receptor-binding motif, 438–506) and NTD supersite (14–20,140–158, 245–263)—have significantly higher than average EVEscape scores, relative to a distribution of 150 random contiguous regions of the same length within the RBD and NTD, respectively. Source data
Fig. 3
Fig. 3. Prepandemic EVEscape is as accurate as intrapandemic experimental scans at anticipating pandemic variation.
a, Percentages of top decile predicted escape mutations by EVEscape, mutational scan experiments (Bloom Set, Supplementary Table 5) and a previous computational model seen more than 100 times in GISAID by each date since the start of the pandemic. EVEscape using prepandemic sequences anticipates pandemic variation at least on par with mutational scan experiments using antibodies and sera available 10 or 17 months into the pandemic. Analysis focuses only on non-synonymous point mutations that are a single nucleotide distance away from the Wuhan viral sequence, as well as on the RBD of Spike as that is where experimental data are available. b, Percentages of observed pandemic mutations in top decile of escape predictions by observed frequency during the pandemic. High-frequency mutations in particular are well-captured by EVEscape. c, Most of the RBD mutations observed in VOC strains have high EVEscape scores and lower scores in the mutational scan experiments against pandemic sera. This is true even when considering a further set of mutations identified in mutational scanning experiments as significantly improving (in the top 2%) either RBD expression or ACE2 binding. d, EVEscape can predict escape mutations in the epitope of the former therapeutic antibody bamlanivimab. E484 is involved in a salt bridge with R96 and R50 of bamlanivimab, which lost Food and Drug Administration emergency use authorization owing to the emergence of Omicron, wherein E484A or E484K mutations (both predicted in the top 1% of EVEscape Spike predictions) escape binding because of the loss of these salt bridges.e, Precision-recall curve for RBD escape predictions of EVEscape, EVEscape fitness component only (EVE model) and a previous computational model compared with DMS escape mutations (AUPRC reported with a comparison with a ‘null’ model in which escape mutations are randomly predicted). expr, expression.; no., number. Source data
Fig. 4
Fig. 4. EVEscape and experiments make distinct, complementary escape predictions.
a, Share of top decile of predicted escape mutations, predicted using EVEscape or mutational scan experiments (Bloom Set, Supplementary Table 5), seen so far more than 100 times in the pandemic. As the virus evolves further, more of the predicted escape mutations are expected to appear. b, RBD site-averaged EVEscape scores agree with site-averaged antibody escape experimental mutational scan measures (Bloom Set, Supplementary Table 5), with high EVEscape sites that are missing from experimental escape prediction found within known antibody footprints. Hue indicates known antibody footprints from the PDB (information that EVEscape as a prepandemic model does not use). c, Predicted escape mutations from experimental mutational scans (Bloom Set, Supplementary Table 5) measuring recognition by convalescent sera from patients infected with either Wuhan, Beta or Delta strains have high EVEscape scores. Sites that escape sera are coloured by whether they have occurred in the pandemic more than 1,000 times. d, Heatmaps illustrating the EVEscape scores of all single mutations to the Wuhan sequence of SARS-CoV-2 RBD. Top lines are sites with observed pandemic mutation frequency >100 and sites in the top 15% of DMS experimental predictions from mutational scan experiments. Source data
Fig. 5
Fig. 5. Identifying strains with high escape potential and forecasting escape for future pandemics.
a, Prepandemic EVEscape scores computed for pandemic strains correlate with fold reduction in pseudovirus 50% neutralization titre for each strain relative to the Wuhan strain (ρ = 0.81, n = 21). Linear regression line shown with a 95% confidence interval. b, Distributions of newly emerging EVEscape strain (unique combination of mutations) scores for non-VOCs throughout 15 periods of the pandemic, with counts of unique new strains per period. EVEscape strain scores increased throughout the pandemic. High-frequency VOC (occurring more than 5,000 times) scores are shown as vertical lines in the first period in which each emerged; new VOCs were predicted to have higher escape scores than most strains in all previous time periods. c, Pandemic circulating strains are grouped according to their EVEscape decile relative to other strains emerging in the same non-overlapping two-week surveillance window. The relative prevalence of each EVEscape decile over the course of the pandemic is plotted in a stacked line-plot. More than 40% of circulating strains on average fall into the top 10% bin. Proportions do not sum to 100% as strains that emerged before the surveillance period of September 2020 to June 2023 are not included. d, VOCs (dotted lines) were among the highest scoring of hundreds or thousands of new strains (histograms) within their two-week window of emergence, enabling EVEscape to forecast which strains will dominate as soon as they appear after only a single observation. e, Site-wise maximum EVEscape scores on Lassa virus glycoprotein structure (PDB: 7PUY). We show agreement between sites of high EVEscape scores (in red) and escape mutations with experimental evidence (shown with spheres). freq., frequency. Source data
Extended Data Fig. 1
Extended Data Fig. 1. EVEscape model components.
We decompose the likelihood of a mutation to escape the immune response as the product of three components: probability of a given mutation to maintain viral fitness (fitness component), to occur in an antibody epitope (accessibility component), and to disrupt antibody binding (dissimilarity component). For fitness (bottom), we train a virus-specific Bayesian VAE on evolutionarily-related proteins to learn a distribution over sequences in that protein family. The ELBO term from the VAE is used as a tractable approximation to the sequence log likelihood, with Δ ELBOs thus quantifying the relative fitness of a given mutated sequence s with respect to the wild type w. Accessibility (top left) is quantified via the negative Weighted Contact Number (WCN) for a residue in a given conformation. If there are multiple conformations, the maximum negative WCN across conformations is used. Dissimilarity (top right) relies on change in key physicochemical properties induced by the mutation, such as hydrophobicity and charge. For all components, the operator f(.) represents a component-specific temperature-scaled logistic transform. Created with BioRender.com.
Extended Data Fig. 2
Extended Data Fig. 2. Fitness effects of viral proteins predicted from evolutionary sequence models.
a) EVE predictions are well correlated with a broad range of viral surface protein deep mutation scanning experiments surveying protein replication and function for SARS-CoV-2 RBD, and Mpro32, H1N1 hemagglutinin, and HIV env,,. b) Site-averaged EVE predictions have similar correlations with site-averaged SARS-CoV-2 RBD DMS experiments as Potts model DCA or EVmutation. c) EVE predictions have higher correlations with Flu H1, HIV Env, and SARS-CoV-2 RBD DMS experiments than grammaticality in CSCS. d) EVE prediction captures a combination of SARS-CoV-2 RBD yeast expression and ACE2 binding - features both necessary for successful immune escape (EVE spearman with expression = 0.45, EVE spearman with ACE2 binding = 0.38 when low expression mutations are removed). e) The mammalian-cell RBD expression and ACE2 binding experiments are highly correlated, likely due to the alternate FACS-binning strategy and metric used for this ACE2 binding experiment. EVE predictions are correlated with both measures. f) Site-averaged EVE scores predict several sites that tolerate mutants in the yeast-display RBD expression assay to be deleterious (red box)–many of these mutants are located at the interface between RBD and the rest of Spike protein. Sites in the red box in scatterplot are shown as spheres on the Spike structure (PDB: 7CAB).
Extended Data Fig. 3
Extended Data Fig. 3. Understanding the roles of each EVEscape component.
a) EVEscape is more predictive of high-frequency pandemic mutations than ablations of any of its three components. Notably, the ablation of the dissimilarity term leads to similar performance at identifying low-frequency mutations, but inferior performance at identifying high-frequency mutations. b) Ablation analysis indicates that all features of EVEscape contribute to performance in predicting RBD escape mutants in deep mutational scanning experiments. c) EVEscape is more predictive than EVE alone at capturing frequent mutations (seen >50,000 times) in full Spike. VOC mutations with high EVE scores and lower EVEscape scores (i.e., A222V and T547K) are known to impact protein conformation and to not escape sera neutralization. Mutations with the highest EVEscape but low EVE scores (i.e., R190S and R408S) are in hydrophobic pockets that may promote antibody binding. d) Sites with either high WCN accessibility or high EVE fitness predictions have a greater percent of escape mutants (upper). WCN and EVE predictions provide similar information about the location of Spike epitopes as identified from antibody-Spike crystal structures in RCSB PDB (lower). e) Density of standard-scaled EVEscape components differ for SARS-CoV-2 RBD escape (and antibody epitope) mutations and non-escape mutations for WCN, RSA, EVE, and site-averaged EVEscape. All but 2 sites in the top 20% of EVEscape scores are in known antibody footprints or have escape mutations in experiments. f) Within-site point biserial correlations between residue dissimilarity metrics and SARS-CoV-2 DMS escape data at escape sites (sites with 3–17 escape mutations). More sites have a higher correlation for our charge-hydrophobicity metric than charge or hydrophobicity alone, BLOSUM62, residue size, or EVE latent space L1 distance. Bounds of boxplot are quartiles with the median as the measure of center.
Extended Data Fig. 4
Extended Data Fig. 4. EVEscape enrichment in regions of SARS-CoV-2 Spike.
a) RBD (particularly receptor binding motif (RBM)) and N-terminal domain (NTD) have significantly enriched average EVEscape scores, relative to a distribution of 500 random contiguous regions of the same length from full Spike. Fusion peptide (not known for escape mutations) does not have enriched average EVEscape scores. b) EVEscape predictions cover diverse epitope regions across Spike and diverse RBD antibody classes (Supplementary Methods) (3D structure of RBD on the right), including known immunodominant sites (E484, K417, L452) (PDB ID: 7BNN). The regions considered are NTD (sequence positions 14 − 306), RBD (319 − 542), S1* (543 − 685), and S2 (686 − 1273), where S1* refers to the region in S1 between RBD and S2. c) Average region EVEscape predictions are highest in RBD and NTD, although NTD is more mutationally tolerant based on average fitness (EVE) score. d) EVEscape scores experimental escape mutants from narrow antibodies and broad neutralizing antibodies higher than those from broad, non-neutralizing antibodies. Sarbecovirus binding breath and neutralization from Starr et al. Bounds of boxplot are quartiles with the median as the measure of center.
Extended Data Fig. 5
Extended Data Fig. 5. EVEscape as accurate as experimental scans at anticipating pandemic variation: retrospective analysis.
a) Top 10% of RBD escape predictions computed using either EVEscape, DMS experiments (Bloom Set, Table S4), or prior models seen by each date over 100 times in GISAID (left). DMS experiments are separated into which studies were available by each starting date. Top 10% of full Spike escape predictions computed using either EVEscape or prior SpikePro model seen by each date over 100 times in GISAID (right). b) Fraction of top mutations (at different percentage thresholds) predicted by EVEscape, DMS experiments, or prior models seen more than 1000 times in GISAID. c) The majority of Spike mutations in VOC strains have high EVEscape scores. d) Venn diagram comparing the top 10% (left) or 20% (right) of RBD sites predicted by EVEscape and by DMS experiments (Bloom Set Table S4). Each bin is stratified to indicate the number of sites observed >100 times over the full pandemic (stripe pattern). All sites in the top 20% of EVEscape predictions have been observed in the pandemic, and there is significantly more overlap between EVEscape and experiments when looking at the top 20% of their predictions as compared to the top 10%.
Extended Data Fig. 6
Extended Data Fig. 6. EVEscape comparison to escape deep mutational scans.
a) Maximum experimental escape values (over the set of antibodies with PDB structures) for each mutation vs. the minimum distance of the mutation site to a tested antibody—most escape mutations (to the right of dashed line) are to residues with atoms within 5Å of any residue on the antibody. For HIV, this is true for the mutations that do not involve loss of glycosylation. b) Impact of choice of RBD expression and ACE2 binding thresholds (dashed line uses thresholds chosen by Bloom escape papers and our paper) on AUPRC (normalized by “null” model – fraction of observed escapes) and # of mutations considered as escape. c) Impact of choice of escape threshold on RBD (Bloom and Xie data separated), Flu, and HIV AUPRC (normalized) and # of escape mutations (dashed line uses escape threshold chosen by our paper). d) Comparison of model performance (AUROC) between data from first escape DMS study (10 antibodies – Sept. 2020) and data available at present (338 antibodies, 55 sera samples). e) Precision-Recall curves (normalized by “null” model) (left) and receiver-operator curves (right) for models predicting DMS escape of SARS-CoV-2 RBD. f) AUPRC (normalized by “null” model) (left) and AUROC (right) values for models predicting DMS escape of SARS-CoV-2 RBD, Flu H1, and HIV Env. Note: The “null” model AUPRC is equivalent to the fraction of observed escapes, and therefore AUPRC values are not comparable between viral proteins with different fractions of escape mutations (i.e., SARS-CoV-2 RBD and HIV Env). The fraction of observed escapes in the DMS experiments are 0.19 for RBD, for 0.015 for Flu, and 0.006 for HIV – Flu and HIV data examined far fewer antibody and sera samples (Table S5).
Extended Data Fig. 7
Extended Data Fig. 7. EVEscape adapts to new models: incorporating glycosylation and a transformer model of mutation fitness capable of scoring indels.
a) The EVEscape fitness component can be substituted with a new generative model, Trancept-EVE that is capable of scoring substitutions as well as insertions and deletions. EVEscape using TranceptEVE as the fitness model performs equivalently to EVEscape using EVE at predicting substitutions from deep mutational scans that escape antibody binding. b) Percent of the top 10% EVEscape predicted substitutions using either EVE or TranceptEVE that were observed at different frequency thresholds during the pandemic shows that EVEscape with TranceptEVE is just as good as, or better than, EVEscape using EVE at predicting pandemic substitutions. c) Histogram of EVEscape scores (with TranceptEVE as a fitness model) for all single deletions to Spike. Single deletions seen in the pandemic more than 1000 times (vertical lines) are predicted higher than most other single deletions, especially the very frequent pandemic deletion Y144- (seen more than a million times). d) Incorporating glycosylation in EVEscape improves performance on HIV Env. Precision-Recall (with AUPRC normalized by “null” model – fraction of observed escapes) (left) and AUROC (right) of EVEscape and EVEscape+Gly models predicting DMS escape mutations for SARS-CoV-2 RBD, Flu H1, and HIV Env. e) Scatterplot of HIV Env maximum DMS escape vs. EVEscape predictions with and without glycosylation. Hue indicates mutations that cause loss of glycosylation. The majority of HIV Env escape mutations involve glycosylation loss, and EVEscape+Gly performs better on these mutations.
Extended Data Fig. 8
Extended Data Fig. 8. EVEscape later in a pandemic: using pandemic data and capturing epistatic shifts.
a) Incorporating pandemic sequences in EVE training data results in a greater distinction between the distributions of escape and non-escape mutation EVE scores. b) Histogram of epistatic shift values between Wuhan and BA.2 strain EVE models for all single mutations, calculated as linear regression residuals. Convergent mutations that arise multiple times in Omicron lineages (mutations at sites 346, 444, 452, 460, and 486) are highlighted on the left. Wastewater mutations seen mid-2021 that were rarely seen clinically in patients, and so likely epistatic, are highlighted on the right. c) Max epistatic shift magnitudes of mutations at sites mutated in BA.2 shows high epistatic shifts concentrated in the RBD. d) Large epistatic shifts for mutations on Wuhan and BA.2 strains are concentrated at sites proximal to BA.2 mutations.
Extended Data Fig. 9
Extended Data Fig. 9. EVEscape strain forecasting.
a) VOCs have high EVEscape scores compared to combinations of random mutations (sampled either from all possible single substitution mutations or from mutations previously observed in VOCs) at the same mutation depth, particularly Delta and later Omicron strains. b) VOCs are among the highest scoring new, unique strains for their two-week period of emergence using a prepandemic EVEscape model.
Extended Data Fig. 10
Extended Data Fig. 10. EVEscape predictions for potential pandemics.
Site-maximum EVEscape scores for Nipah Virus fusion protein (left) and Glycoprotein (right) depict regions of high EVEscape scores. Known escape mutations with experimental evidence (little is known for this understudied virus with pandemic potential) are highlighted with spheres.

Comment in

References

    1. Schmidt F, et al. Measuring SARS-CoV-2 neutralizing antibody activity using pseudotyped and chimeric viruses. J. Exp. Med. 2020;217:e20201181. doi: 10.1084/jem.20201181. - DOI - PMC - PubMed
    1. Dong J, et al. Genetic and structural basis for SARS-CoV-2 variant neutralization by a two-antibody cocktail. Nat. Microbiol. 2021;6:1233–1244. doi: 10.1038/s41564-021-00972-2. - DOI - PMC - PubMed
    1. Greaney AJ, et al. Complete mapping of mutations to the SARS-CoV-2 Spike receptor-binding domain that escape antibody recognition. Cell Host Microbe. 2021;29:44–57.e9. doi: 10.1016/j.chom.2020.11.007. - DOI - PMC - PubMed
    1. Greaney, A. J. et al. Mapping mutations to the SARS-CoV-2 RBD that escape binding by different classes of antibodies. Nat. Commun.12, 4196 (2021). - PMC - PubMed
    1. Greaney AJ, et al. Comprehensive mapping of mutations in the SARS-CoV-2 receptor-binding domain that affect recognition by polyclonal human plasma antibodies. Cell Host Microbe. 2021;29:463–476.e6. doi: 10.1016/j.chom.2021.02.003. - DOI - PMC - PubMed

Publication types