. 2023 Oct;622(7983):627-636.
doi: 10.1038/s41586-023-06621-4. Epub 2023 Oct 11.

Apoptotic stress causes mtDNA release during senescence and drives the SASP

Affiliations

Apoptotic stress causes mtDNA release during senescence and drives the SASP

Stella Victorelli et al. Nature. 2023 Oct.

Erratum in

  • Author Correction: Apoptotic stress causes mtDNA release during senescence and drives the SASP.
    Victorelli S, Salmonowicz H, Chapman J, Martini H, Vizioli MG, Riley JS, Cloix C, Hall-Younger E, Machado Espindola-Netto J, Jurk D, Lagnado AB, Sales Gomez L, Farr JN, Saul D, Reed R, Kelly G, Eppard M, Greaves LC, Dou Z, Pirius N, Szczepanowska K, Porritt RA, Huang H, Huang TY, Mann DA, Masuda CA, Khosla S, Dai H, Kaufmann SH, Zacharioudakis E, Gavathiotis E, LeBrasseur NK, Lei X, Sainz AG, Korolchuk VI, Adams PD, Shadel GS, Tait SWG, Passos JF. Victorelli S, et al. Nature. 2024 Jan;625(7995):E15. doi: 10.1038/s41586-023-07002-7. Nature. 2024. PMID: 38168624 Free PMC article. No abstract available.

Abstract

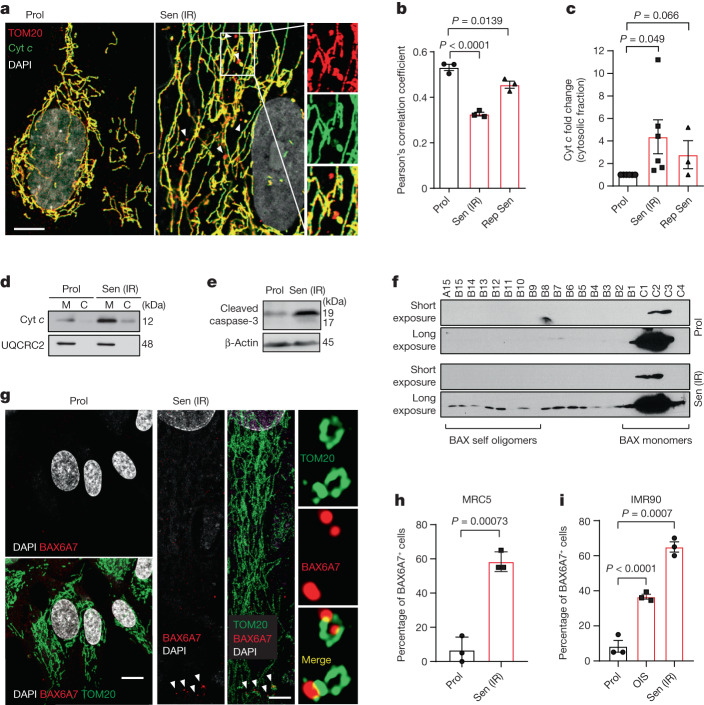
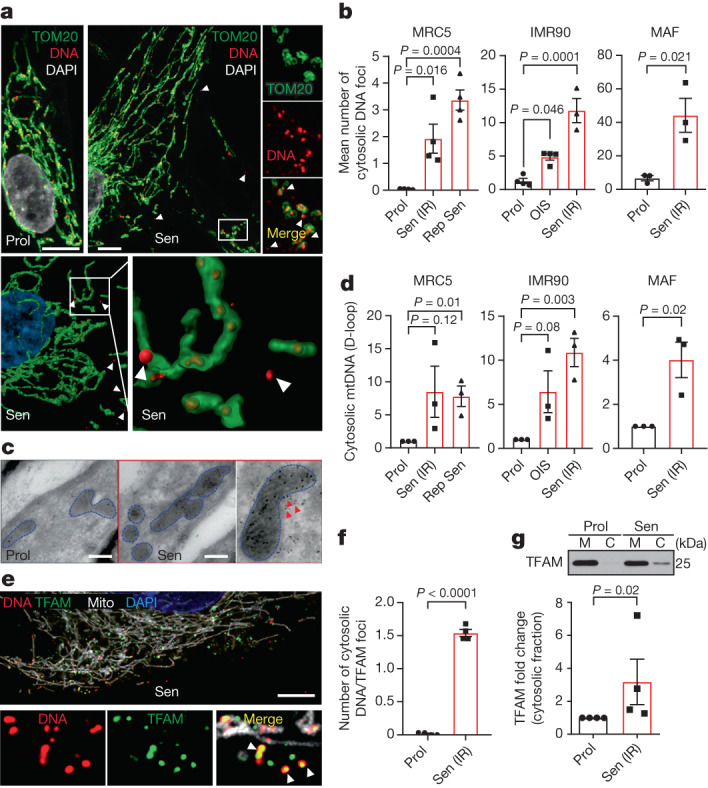
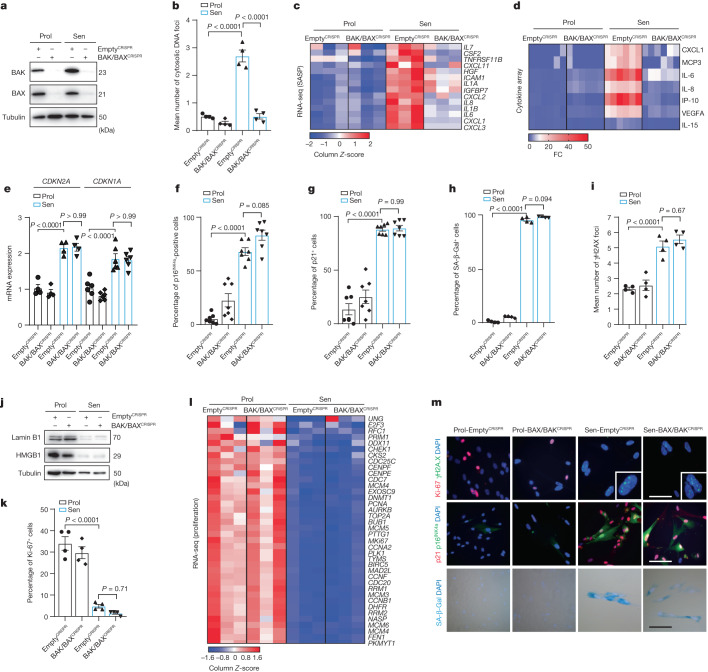
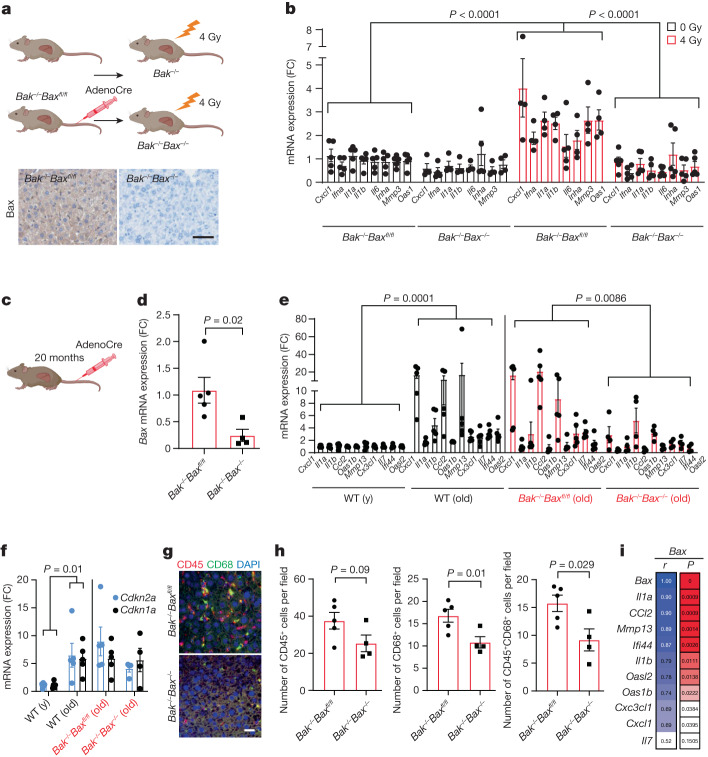
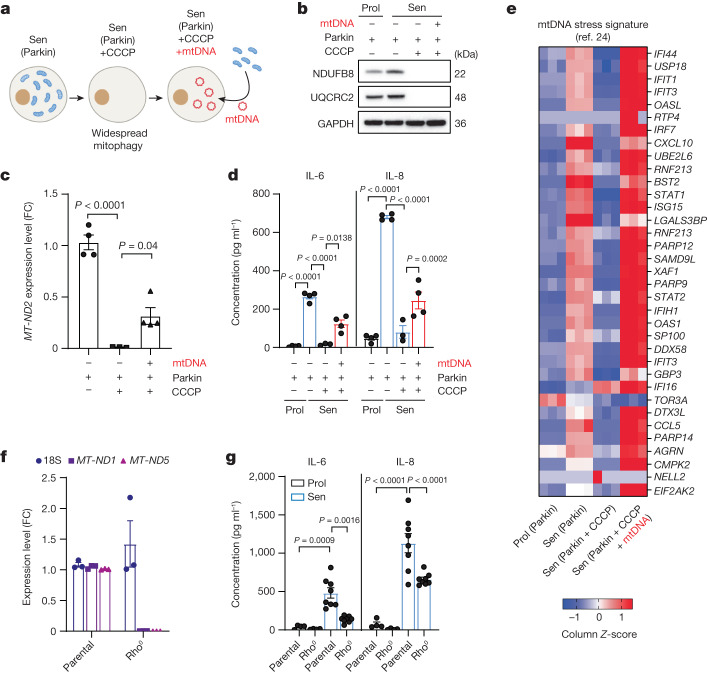
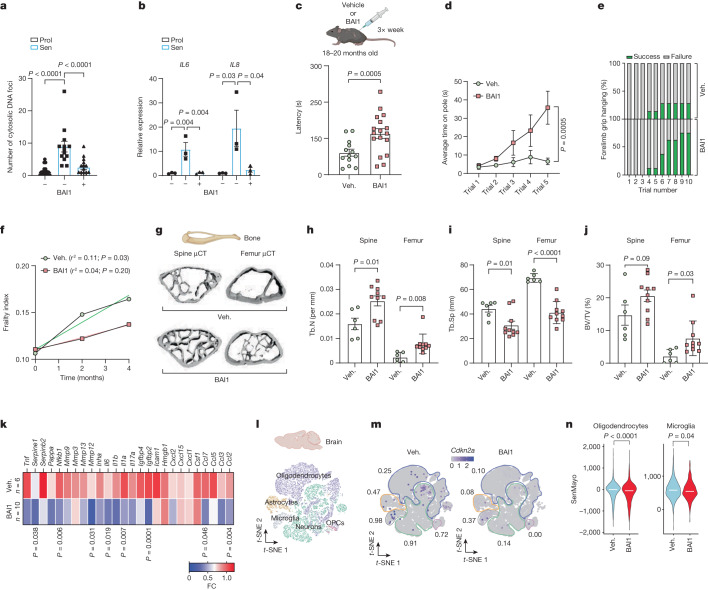
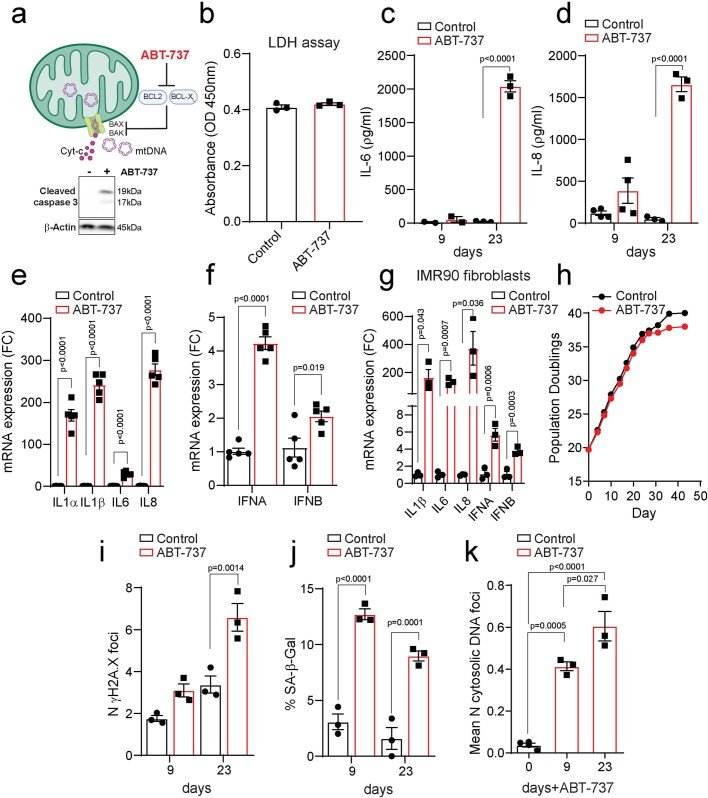
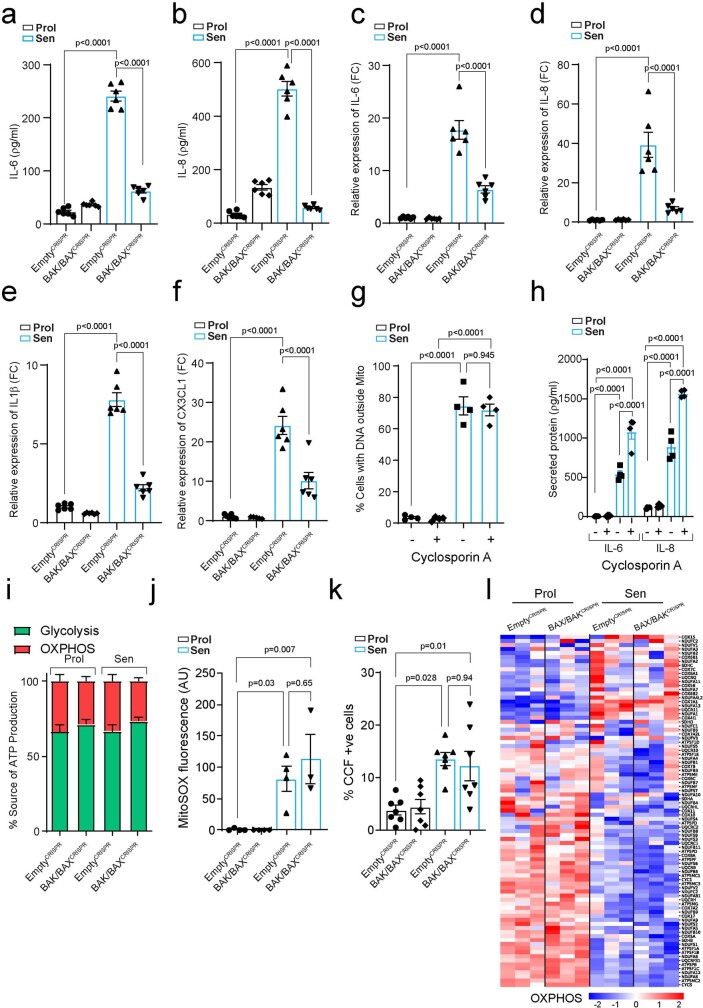
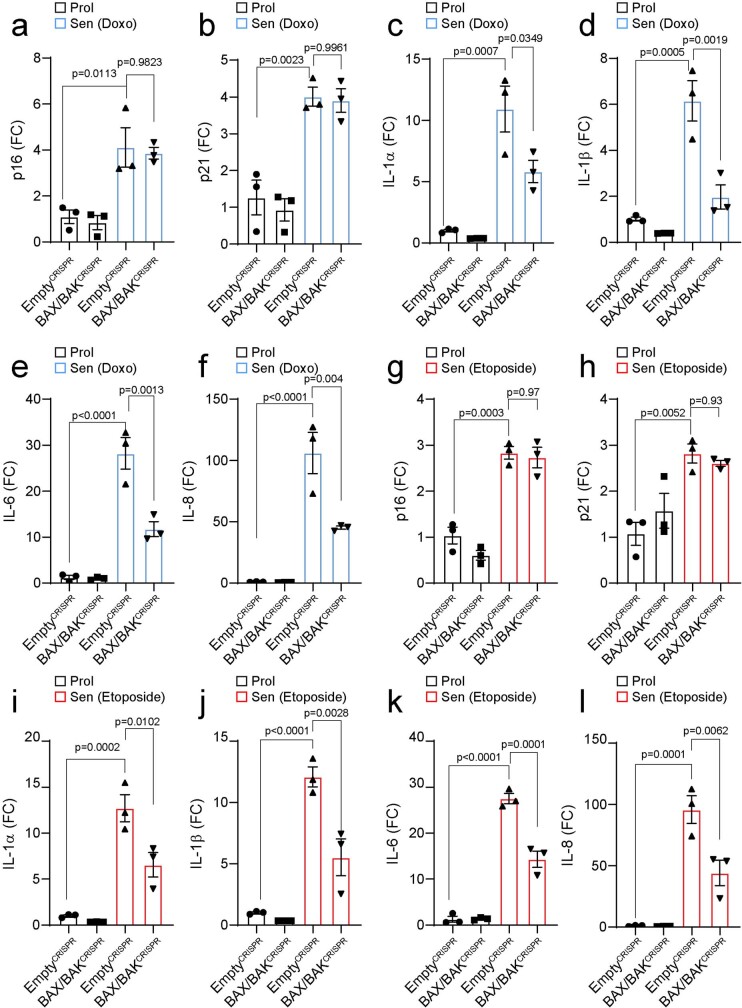
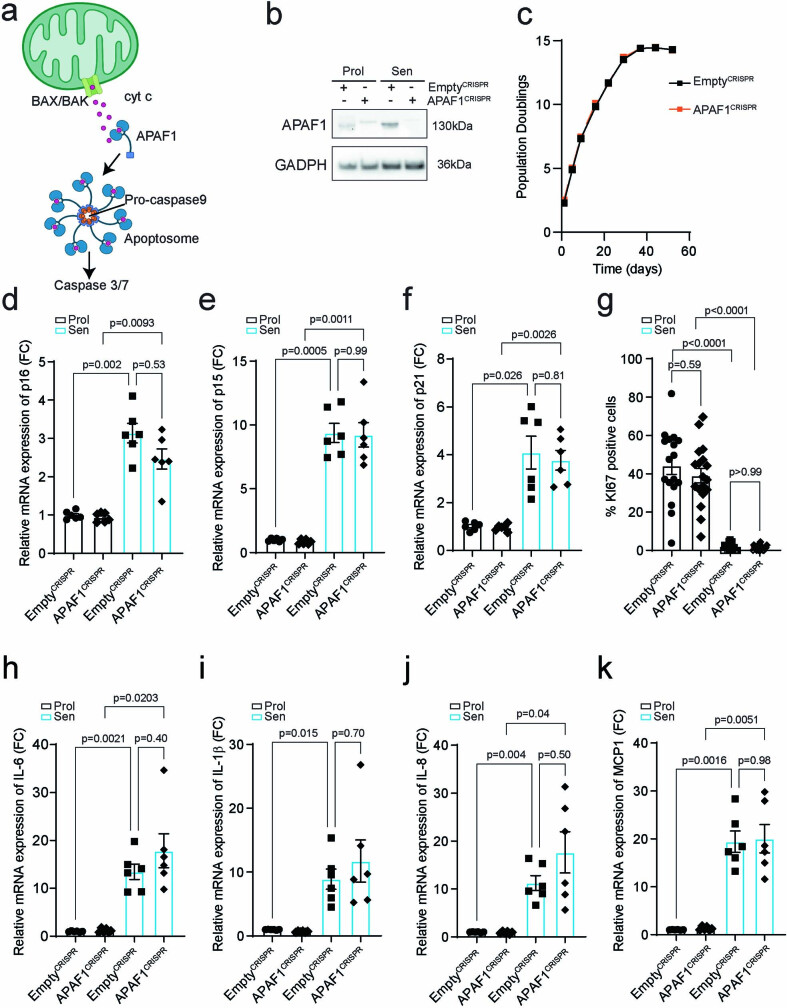
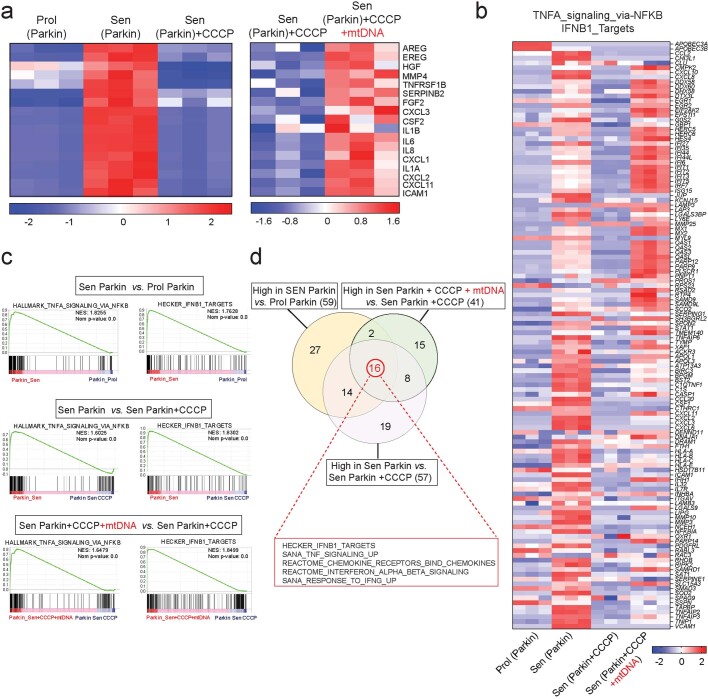
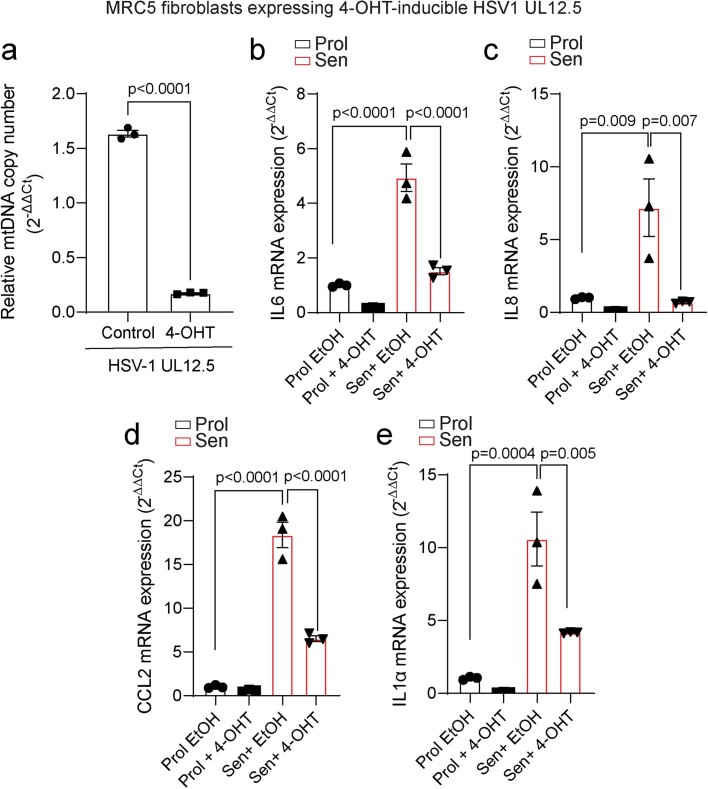
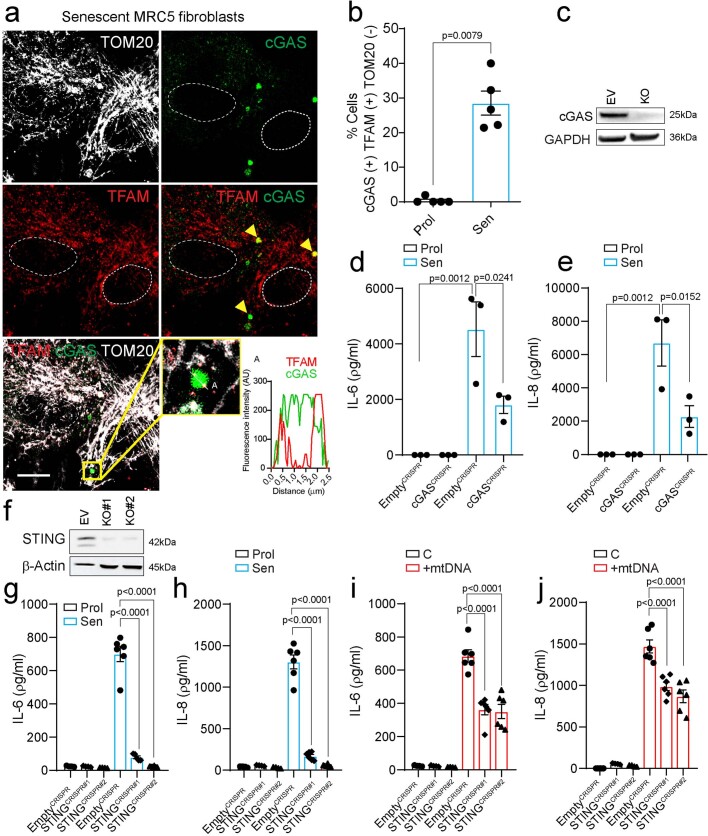
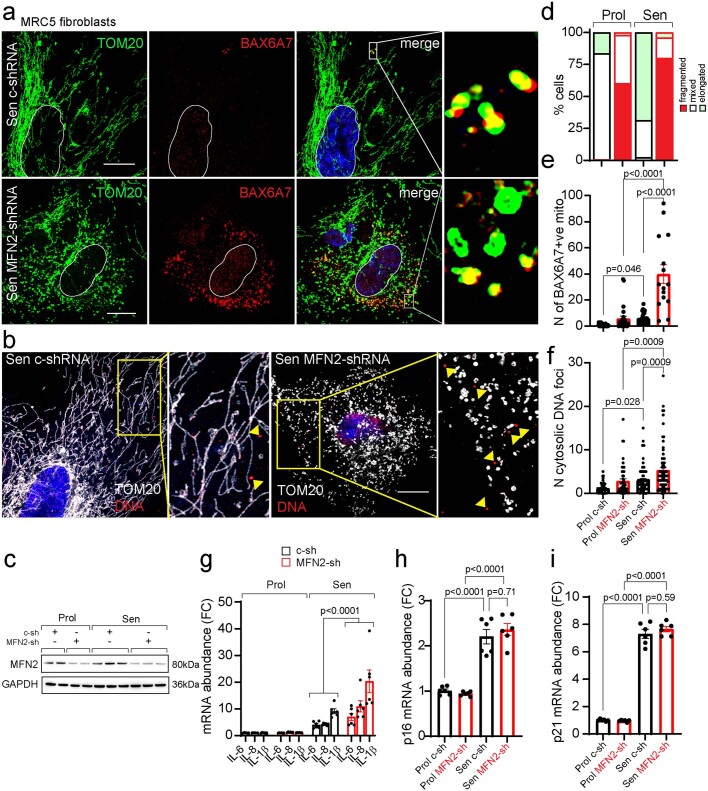
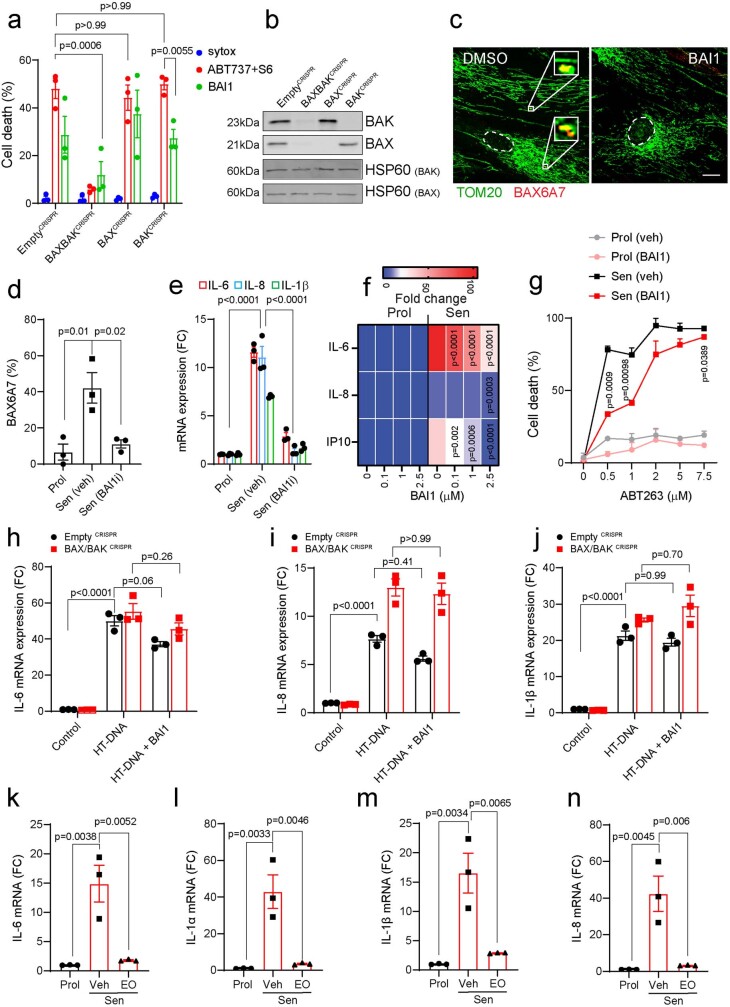
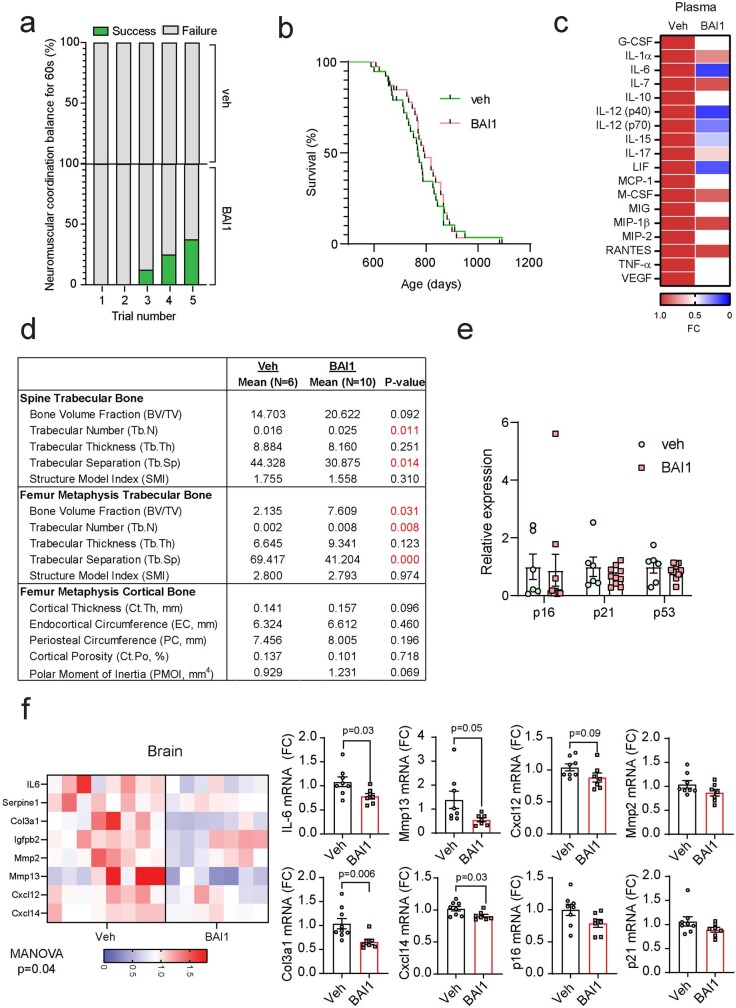
Senescent cells drive age-related tissue dysfunction partially through the induction of a chronic senescence-associated secretory phenotype (SASP)1. Mitochondria are major regulators of the SASP; however, the underlying mechanisms have not been elucidated2. Mitochondria are often essential for apoptosis, a cell fate distinct from cellular senescence. During apoptosis, widespread mitochondrial outer membrane permeabilization (MOMP) commits a cell to die3. Here we find that MOMP occurring in a subset of mitochondria is a feature of cellular senescence. This process, called minority MOMP (miMOMP), requires BAX and BAK macropores enabling the release of mitochondrial DNA (mtDNA) into the cytosol. Cytosolic mtDNA in turn activates the cGAS-STING pathway, a major regulator of the SASP. We find that inhibition of MOMP in vivo decreases inflammatory markers and improves healthspan in aged mice. Our results reveal that apoptosis and senescence are regulated by similar mitochondria-dependent mechanisms and that sublethal mitochondrial apoptotic stress is a major driver of the SASP. We provide proof-of-concept that inhibition of miMOMP-induced inflammation may be a therapeutic route to improve healthspan.


Conflict of interest statement

V.I.K. is a scientific advisor for Longaevus Technologies. S.W.G.T. consults for Exo Therapeutics. The other authors declare no competing interests.

Figures

Fig. 1
Fig. 1. Sublethal mitochondrial apoptotic signalling is a feature of cellular senescence.
a, Representative super-resolution SIM microscopy images of Cyt c (green) and TOM20 (red) in proliferating (prol.) and radiation-induced senescent (Sen IR) human fibroblasts. Scale bar, 10 μm. The magnified images on the right show areas in which Cyt c (green) does not co-localize with TOM20 (red) in senescent cells. b, Quantification of the co-localization between Cyt c and TOM20 using Pearson’s correlation coefficient. n = 3 independent experiments. c, The relative levels of cytosolic Cyt c in irradiation-induced (IR) and replicative (Rep Sen) senescent cells expressed as the fold change compared with the proliferating control. n = 6 (Prol and Sen IR) and n = 3 (replicative senescent) independent experiments. d, Representative western blot of c, showing Cyt c enriched in the cytosolic fraction of senescent cells. UQCRC2 (complex III mitochondria protein) shows that the cytosolic fraction lacks mitochondria. e, Western blot analysis showing the increase in cleaved caspase-3 in irradiation-induced senescent cells. Data are representative of n = 4 independent experiments. f, Western blot analysis of BAX in FPLC fractions of proliferating and senescent cells. Fractions of decreasing protein molecular mass are shown from left to right. Films were exposed for 2 min (short exposure) and overnight (long exposure). Representative blot of n = 2 independent experiments. g, Representative super-resolution SIM microscopy images of BAX(6A7) (activated form of BAX; red) and TOM20 (green). Scale bars, 10 μm. h,i, Quantification of the percentage of MRC5 (h) and IMR90 (i) fibroblasts positive for BAX(6A7) co-localizing with TOM20. For h and i, n = 3 independent experiments. Data are mean ± s.e.m. Statistical significance was assessed using one-way analysis of variance (ANOVA) followed by Tukey’s multiple-comparison test (b, c and i) and two-sided Student’s unpaired t-tests (c and h). Gel source data for df are provided in Supplementary Fig. 1. Source data
Fig. 2
Fig. 2. Senescent cells have increased levels of cytosolic mtDNA.
a, Representative super-resolution AiryScan microscopy images of DNA (red) and TOM20 (green) in proliferating and senescent cells (top). Scale bars, 5 μm. Bottom, 3D representations of the mitochondrial network (green) and DNA (red), showing that most DNA foci are located within mitochondria with some foci in the cytoplasm of senescent cells. b, The mean number of DNA foci present in the cytoplasm of proliferating and senescent human MRC5 and IMR90 fibroblasts and mouse adult fibroblasts (MAFs). n = 3 for IMR90 Sen (IR) and MAF, n = 4 independent experiments for all the other conditions. c, Representative electron microscopy images of DNA immuno-gold labelling in proliferating and senescent cells. Representative image of n = 2 independent experiments. Scale bars, 200 nm. d, qPCR quantification of the levels of mtDNA (D-loop region) present in the cytosolic fraction of proliferating and senescent human MRC5 and IMR90 fibroblasts and MAFs, normalized to the levels of total cellular mtDNA. n = 3 independent experiments. e, Representative super-resolution AiryScan microscopy image of DNA (red), TFAM (green) and mitochondria (Mito, white; labelled with BacMam 2.0 RFP) in senescent cells. Scale bar, 10 μm. The magnified images show TFAM co-localizing with DNA outside the mitochondrial network, representing mtDNA leakage. f, Quantification of the mean number of DNA + TFAM foci present outside of the mitochondrial network in proliferating and senescent cells. n = 4 independent experiments. g, Representative western blot (top) and quantification (bottom) of TFAM present in the cytosolic fraction of proliferating and senescent cells. n = 4 independent experiments. Values are normalized to the mitochondrial protein UQCRC2 (shown in Fig. 1d; the samples in g and Fig. 1d were probed for Cyt c and TFAM, respectively, on the same blot) and expressed as the fold change. Gel source data for g are provided in Supplementary Fig. 1. Data are mean ± s.e.m. Statistical significance was assessed using one-way ANOVA followed by Tukey’s multiple-comparison test (b) and two-sided Student’s unpaired t-tests (b, d, f and g). Individual data points are from biological replicates. Source data
Fig. 3
Fig. 3. BAX and BAK macropores mediate mtDNA release and the SASP in senescent cells.
a, CRISPR–Cas9 gene editing was used to generate human fibroblasts deficient in BAX and BAK (BAX−/− BAK−/−). Western blot showing successful CRISPR–Cas9-mediated deletion of BAK and BAX in proliferating and senescent (IR) cells. BAX/BAKCRISPR indicates cells negative for BAX and BAK. Western blot is representative of n = 3 independent experiments. b, The mean number of cytosolic DNA foci in proliferating and senescent BAX−/−BAK−/− cells. n = 4 independent experiments. c, Column-clustered heat map of SASP genes that are differentially expressed in senescence and rescued by deletion of BAX and BAK. The colour intensity represents the column Z-score; red and blue indicate high and low expression, respectively. d, The levels of secreted cytokines in proliferating and senescent empty vector (EV) and BAX−/−BAK−/− cells. n = 6 independent experiments. e, mRNA levels of CDKN2A (n = 4 independent experiments) and CDKN1A (n = 6 independent experiments) in proliferating and senescent EV and BAX−/−BAK−/− cells. f,g, The percentage p16INK4a-positive (f) and p21-positive (g) proliferating and senescent EV and BAX−/−BAK−/− cells. n = 7 independent experiments. h,i, Quantification of the percentage of senescence-associated β-galactosidase (Sen-β-Gal)-positive cells (h) and the mean number of γH2AX foci in proliferating and senescent EV and BAX−/−BAK−/− cells (i). n = 4 independent experiments. j, Western blot analysis of lamin B1 and HMGB1 levels in proliferating and senescent EV and BAX−/−BAK−/− cells. Representation of n = 3 independent experiments. k, The percentage of Ki-67-positive proliferating and senescent EV and BAX−/−BAK−/− cells. n = 4 independent experiments. l, Column-clustered heat map of proliferation genes that are differentially expressed in senescent cells and are not rescued by deletion of BAX and BAK. The colour intensity represents the column Z-score. m, Representative microscopy images of Ki-67 (red) and γH2AX (green) (top); p21 (red) and p16INK4a (green) (blue is DAPI) (middle); and Sen-β-Gal (bottom) in proliferating and senescent EV and BAX−/−BAK−/− cells. Scale bars, 100 µm. Representative images of n = 4 independent experiments. Data are mean ± s.e.m. Statistical significance was assessed using one-way ANOVA followed by Tukey’s multiple-comparison test (b, ei and k). Individual data points are from biological replicates. Gel source data for j are provided in Supplementary Fig. 1. Source data
Fig. 4
Fig. 4. Deletion of Bax and Bak reduces the SASP in vivo.
a, Schematic of the experimental procedure (top). Bottom, representative immunohistochemical image showing successful deletion of Bax in the liver after AAV injection. Scale bar, 100 µm. b, Quantification of mRNA levels of the indicated SASP genes in the livers of Sham- and 4-Gy-irradiated Baxfl/flBak−/− and Bak−/−Bax−/− mice. n = 5 (sham-IR Baxfl/flBak−/− and 4Gy-IR Bak−/−Bax−/−) and n = 4 (sham-IR Bak−/−Bax−/− and 4-Gy-IR Baxfl/flBak−/−) mice. Values are expressed as the fold change compared with sham-irradiated Baxfl/flBak−/− mice. c, Schematic of the experimental procedure. d, Quantification of mRNA levels of Bax in the livers of aged Baxfl/flBak−/− mice after tail-vein injection of AAV-Cre virus. n = 5 (Baxfl/flBak−/−) and n = 4 (Bak−/−Bax−/−) mice. e,f, Quantification of mRNA expression of the indicated SASP genes (e) and of Cdkn2a and Cdkn1a (f) in young (y; n = 5) and old (n = 5) wild-type mice and aged Baxfl/flBak−/− mice (n = 5) after AAV-Cre virus injection (n = 4). g, Representative immunofluorescence image of CD45 (red) and CD68 (green) in the livers of aged Baxfl/flBak−/− (n = 5) and Bax−/−Bak−/− mice (n = 4). Scale bar, 30 µm. h, Quantification of g. i, The correlation coefficient between expression levels of Bax and different SASP factors in the livers of aged Baxfl/flBak−/− and Bax−/−Bak−/− mice. Data are mean ± s.e.m. Statistical significance was assessed using two-way ANOVA followed by Tukey’s multiple-comparison test (b, e and f), two-sided Student’s unpaired t-tests (d and h) and Pearson’s correlation coefficient (i); *P< 0.05, **P< 0.01, ***P < 0.001. Source data
Fig. 5
Fig. 5. Cytosolic mtDNA drives the SASP in senescent cells.
a, Schematic of the experimental approach. b, Western blot analysis of the expression levels of the mitochondrial proteins NDUFB8 and UQCRC2, demonstrating that mitochondrial proteins are absent after Parkin-mediated clearance and are not restored after mtDNA transfection in IMR90 human fibroblasts. c, qPCR quantification showing the levels of the mitochondrial gene MT-ND2 in Parkin-expressing IMR90 fibroblasts after widespread mitophagy and after mtDNA transfection. n = 3 (Parkin + CCCP) and n = 4 (Parkin control and Parkin + CCCP + mtDNA) independent experiments). d, The secretion levels of IL-6 and IL-8 in Parkin cells after mitochondria clearance and after mtDNA transfection. n = 3 (Parkin + CCCP) and n = 4 (Parkin control and Parkin + CCCP + mtDNA) independent experiments. e, Heat map revealing that the mtDNA stress signature identified previously was induced at the mRNA level in senescent cells, while the addition of CCCP reversed this phenotype. Reintroduction of mtDNA was able to restore this stress signature. f, mRNA expression levels of the nuclear-encoded gene 18S and the mitochondrial-genome-encoded genes MT-ND1 and MT-ND5 in parental and Rho0 cells. n = 3 independent experiments. g, The secreted levels of IL-6 and IL-8 in proliferating (n = 4) and senescent (n = 8) Rho0 cells. Data are mean ± s.e.m. Statistical significance was assessed using one-way ANOVA followed by Tukey’s multiple-comparison test (c, d and g). Individual data points are from biological replicates. Gel source data for b are provided in Supplementary Fig. 1. Source data
Fig. 6
Fig. 6. Pharmacological inhibition of BAX improves healthspan in aged mice.
a, Mean cytosolic DNA foci in human fibroblasts treated with BAI1. n = 20 (proliferating), n = 14 (senescent) and n = 17 (senescent + BAI1) cells analysed, representative of 2 independent experiments. b, The mRNA levels of IL6 and IL8 in proliferating and senescent (IR) human fibroblasts with or without BAI1 treatment. n = 3 independent experiments. c, The experimental scheme (top). Bottom, rotarod latency in vehicle-treated (n = 13) and BAI1-treated (n = 17) aged mice. d,e, The average time spent on the pole (d) and forelimb grip strength (the number of trials required to remain hanging for a total of 90 s; percentage success is shown in green) (e) in vehicle-treated (n = 7) or BAI1-treated (n = 8) mice. f, The frailty index of mice at 0, 2 and 4 months after treatment with vehicle (n = 14) or BAI1 (n = 15). The linear regression of the mean frailty index at each timepoint is shown. g, Representative μCT images of bone microarchitecture at the lumbar spine and femur of vehicle- and BAI1-treated mice. hj, Quantification of μCT-derived trabecular number (Tb.N; per mm) (h) and trabecular separation (Tb.Sp; mm) (i) and bone volume fraction (BV/TV; percentage) (j). k, The mRNA expression of SASP genes was assessed using qPCR with reverse transcription (RT–qPCR) in the femur of vehicle- or BAI1-treated mice. Values are the fold change (FC) compared with the vehicle. For gk, n = 6 (vehicle) and n = 10 (BAI1-treated) mice. l, Single-nucleus suspensions from vehicle-treated and BAI1-treated aged mice were prepared from whole brains for RNA-seq analysis. The t-distributed stochastic neighbour embedding (t-SNE) plots indicate the separation of different cell populations. m, BAI1 reduced the fraction of p16INK4a-expressing cells across cell populations. n, BAI1 significantly reduced the expression of the SenMayo gene set in oligodendrocytes and microglia. Two vehicle-treated and two BAI1-treated mice were pooled for analysis. Data are mean ± s.e.m. Statistical significance was assessed using one-way ANOVA followed by Tukey’s multiple-comparison test (a and b), two-sided Student’s unpaired t-tests (c, hk and n) and two-way ANOVA followed by Sidak’s multiple-comparison test (d). Source data
Extended Data Fig. 1
Extended Data Fig. 1. ABT-737 treatment induces miMOMP and drives a SASP-like response.
(a) Scheme representing the mechanism by which ABT-737 induces miMOMP. Below, representative Western blot showing cleaved caspase 3 in proliferating and ABT-737- treated MRC5 fibroblasts. (b) Absorbance values (at 450 nm) as a measure for lactate dehydrogenase (LDH) release from proliferating MRC5 fibroblasts treated with vehicle or ABT-737 for 72 h (n = 3 independent experiments), showing no difference in cell death. Levels of secreted (c) IL-6 (n = 2 and n = 3 independent experiments, 9 and 23 days, respectively) and (d) IL-8 in control and MRC5 fibroblasts treated with ABT-737 for 9 (n = 4 independent experiments) and 23 days (n = 3 independent experiments). Quantification of mRNA expression levels of interleukins (IL-1α,β, IL 6 and IL-8), interferon genes (IFN-α and β) in MRC5 (n = 5 independent experiments) (e-f) and IMR90 fibroblasts (n = 3 independent experiments) (g) 23 days after ABT-737 treatment. (h) Graph showing population doublings of control and ABT-737-treated MRC5 fibroblasts. Quantification of (i) mean number of γH2AX foci, (j) percentage of Sen-β-Gal-positive cells and (k) mean number of DNA nucleoids located outside of the mitochondrial network in control and MRC5 fibroblasts treated with ABT-737 for 9 and 23 days (n = 3 independent experiments; n = 4 for day 0). Data are mean ± S.E.M. Statistical significance was assessed using one-way ANOVA followed by Tukey’s multiple comparison test (k), two-sided Student’s unpaired t-test (b, e-g), two-way ANOVA followed by Sidak’s multiple comparison test (c, d, i, j). Source data
Extended Data Fig. 2
Extended Data Fig. 2. BAX and BAK mitochondrial pores regulate the SASP without the involvement of the MPTP.
Levels of secreted (a) IL-6 and (b) IL-8 in proliferating and senescent (IR) EV and BAX/BAK-/- cells (n = 6 independent experiments). Quantification of mRNA levels of (c) IL-6, (d) IL-8, (e) IL1β and (f) CX3CL1. Data are expressed as fold change to proliferating EV cells (n = 6 independent experiments). (g) Percentage of cells containing DNA foci located outside of mitochondrial network, and (h) Levels of secreted IL-6 and IL-8 in proliferating and senescent cells treated with DMSO or 1 μM Cyclosporin A (n = 4 independent experiments). (i) Graph showing the energy production by glycolysis or oxidative phosphorylation normalized to total ATP production and expressed as a percentage (n = 5 independent experiments; n = 4 Sen BAK/BAXCRISPR). (j) Quantification of MitoSOX fluorescence intensity in proliferating and senescent EV and BAX/BAK−/− cells (n = 4 independent experiments for Prol and Sen EV and Prol BAX/BAK−/− cells; n = 3 independent experiment for Sen BAX/BAK−/− cells). (k) Quantification of the percentage of EV and BAX/BAK−/− cells displaying Cytoplasmic chromatin Fragments (CCF) (n = 7 independent experiments). (l) Column clustered heatmap of OXPHOS genes that are differentially expressed in senescent cells and are not changed by BAX/BAK deletion. The colour intensity represents column Z-score, where red and blue indicate high and low expression, respectively. Data are mean ± S.E.M. Statistical significance was assessed using one-way ANOVA followed by Tukey’s multiple comparison test (a-k). Source data
Extended Data Fig. 3
Extended Data Fig. 3. BAX and BAK deletion inhibits the SASP in therapy-induced senescent cells.
Quantification of mRNA expression levels of (a) p16INK4A, (b) p21 and SASP factors (c) IL-1α, (d) IL-1β, (e) IL-6 and (f) IL-8 in proliferating and doxorubicin-induced senescent (n = 3 independent experiments) BAX/BAK−/− MRC5 human fibroblasts. Quantification of mRNA levels of (g) p16INK4A, (h) p21, (i) IL-1 α, (j) IL-1β, (k) IL-6 and (l) IL-8 in proliferating and etoposide-induced senescent (n = 3 independent experiments) BAX/BAK−/− MRC5 human fibroblasts. Data are expressed as fold change to proliferating EmptyCRISPR cells. Data are mean ± S.E.M. Statistical significance was assessed using one-way ANOVA followed by Tukey’s multiple comparison test (a-l). Source data
Extended Data Fig. 4
Extended Data Fig. 4. Caspase activation is not involved in SASP regulation in senescent cells.
(a) Scheme showing the mechanism of miMOMP-induced caspase activation. (b) Western blot showing successful CRISPR/Cas9 deletion of APAF1 in proliferating and senescent (IR) MRC5 human fibroblasts. Representative of n = 2 experiments. (c) Graph showing population doublings of EV and APAF1-deficient cells. Data are representative of n = 2 independent experiments. Quantification of mRNA levels of (d) p16INK4A, (e) p15, (f) p21 (n = 6 independent experiments). (g) Quantification of the percentage of EV and APAF1 deficient cells positive for Ki67. Each dot represents the average per image (n = 3 technical replicates; 6 images taken per replicate). Quantification of mRNA levels of (h) IL-6, (i) IL-1β, (j) IL-8, (k) MCP1 in proliferating and senescent (IR) EV and APAF1-deficient cells (n = 6 independent experiments). Data are mean ± S.E.M. Statistical significance was assessed using one-way ANOVA followed by Tukey’s multiple comparison test (d-k). For gel source data (b), see Supplementary Fig. 1. Source data
Extended Data Fig. 5
Extended Data Fig. 5. Widespread mitochondrial clearance suppresses inflammation during senescence, while reintroduction of mtDNA restored it.
(a) Column clustered heatmap of SASP genes that are differentially expressed in senescent IMR90 fibroblasts, down-regulated upon mitochondria clearance and are rescued by mtDNA transfection. The colour intensity represents column Z-score, where red and blue indicate high and low expression, respectively. (b) Gene members of two hallmark signatures, TNFA-signalling via NFKB (M5890) and Hecker IFNB1 targets (M3010), were upregulated in senescent cells and downregulated after CCCP. Subsequent addition of mtDNA rescued this phenotype. (c) The GSEA plots for Parkin Sen vs. Parkin Prol display an enrichment for the TNFA-signalling via NF-κB (M5890) and Hecker IFNB1 targets (M3010) pathways in the senescent cell population. Addition of mtDNA led to a significant enrichment compared to CCCP alone in senescent cells. (d) Venn diagram depicting a substantial overlap of enriched pathways in all three conditions (FWER p-value < 0.25). Source data
Extended Data Fig. 6
Extended Data Fig. 6. Expression of a tamoxifen-inducible viral DNase (HSV-1 UL12.5) that specifically targets mitochondria, results in depletion of mtDNA and suppresses the SASP.
a) Relative mtDNA copy number of MRC5-UL12.5 fibroblasts with and without tamoxifen treatment (100 nM, 48 h). (b-e) mRNA expression levels of SASP genes, IL6, IL8, Ccl2 and IL-1α in proliferating and senescent (IR) MRC5-UL12.5 fibroblasts with and without tamoxifen treatment (48 h). Data are mean ± S.E.M. of n = 3 independent experiments. Statistical significance was assessed using two-sided Student’s unpaired t-test (a), one-way ANOVA followed by Tukey’s multiple comparison test (b-e). Source data
Extended Data Fig. 7
Extended Data Fig. 7. Cytosolic mtDNA acts via the cGAS–STING pathway to drive the SASP in senescent cells.
(a) Representative immunofluorescence image of cGAS–GFP fusion protein (green) co-localizing with TFAM (red) in senescent cells. Magnification at the bottom shows cGAS–GFP reporter colocalizing with TFAM foci in the absence of TOM20 (white) (scale bar is 20 µm). Graph represents quantification of cGAS and TFAM signals in selected linear region indicated in a. (b) Quantification of the percentage of proliferating and senescent cells (IR) containing cGAS co-localizing with cytosolic TFAM foci (n = 5 independent experiments). (c) Western blot showing the level of cGAS upon CRISPR/Cas9-mediated cGAS deletion. Representative blot of n = 1 independent experiment. Secreted levels of (d) IL-6 and (e) IL-8 in proliferating and senescent EV and cGAS-deficient MRC5 human fibroblasts (n = 3 independent experiments). (f) Representative Western blot showing the level of STING upon CRISPR/Cas9-mediated STING deletion using two different gRNAs. Blot is representative of n = 2 independent experiments. Secreted levels of (g) IL-6 and (h) IL-8 in proliferating (n = 4 independent experiments) and senescent (n = 6 independent experiments) EV and STING-deficient MRC5 human fibroblasts. Secreted levels of (i) IL-6 and (j) IL-8 in EV and STING-deficient MRC5 human fibroblasts upon mtDNA transfection (n = 4 for control, n = 6 independent experiments for +mtDNA condition). Data are mean ± S.E.M. Statistical significance was assessed using two-sided Student’s unpaired t-test (b), one-way ANOVA followed by Tukey’s multiple comparison test (d, e, g-j). Source data
Extended Data Fig. 8
Extended Data Fig. 8. MFN2 deficiency exacerbates intracellular mtDNA release and the SASP in senescent MRC5 fibroblasts.
(a) Representative immunofluorescence images of TOM20 (green) and activated BAX (BAX6A7) (red) in senescent (IR) control (c-shRNA) and shRNA-mediated MFN2 knockout MRC5 fibroblasts (scale bar is 20 µm). Magnifications show BAX6A7 co-localizing with fragmented mitochondria. (b) Representative immunofluorescence images of TOM20 (white) and DNA (red) in control and shRNA-mediated MFN2 knockout MRC5 human fibroblasts (scale bar is 20 µm). Magnification shows DNA foci located outside of TOM20. Images are representative of n = 3 independent experiments (a, b). (c) Western blot showing the protein level of MFN2 following shRNA-mediated deletion of MFN2 in proliferating and senescent MRC5 fibroblasts. Quantification of (d) the percentage of cells containing fragmented, mixed, and elongated mitochondria (n = 3 independent experiments), (e) the number of BAX6A7- positive mitochondria in proliferating and senescent control and MFN2-shRNA MRC5 fibroblasts (n = 74 Prol, n = 26 Prol (sh-MFN2), n = 29 Sen (sh-C), n = 15 Sen (sh-MFN2) cells analysed over 2 independent experiments). Data are mean ± S.E.M. (f) Number of DNA foci located outside of TOM20 in proliferating and senescent control and MFN2-shRNA MRC5 fibroblasts. Data are mean of n = 3 independent experiments ± S.E.M. (n = 50 Prol, n = 49 Prol (sh-MFN2), n = 78 Sen (sh-C), n = 76 Sen (sh-MFN2) cells). Quantification of mRNA expression level of (g) indicated SASP factors, (h) p16INK4A, and (i) p21 in proliferating and senescent control- and MFN2- shRNA MRC5 fibroblasts. Data are mean of n = 6 independent experiments ± S.E.M. Statistical significance was assessed using one-way ANOVA followed by Tukey’s multiple comparison test (e, f, h, i), two-way ANOVA followed by Tukey’s multiple comparison test (g). For gel source data (c), see Supplementary Fig. 1. Source data
Extended Data Fig. 9
Extended Data Fig. 9. BAI1 suppresses miMOMP and SASP in senescent cells and does not inhibit DNA-induced inflammation.
(a) Percentage cell death following ABT737 + S6 induced cell death at hour 8 post apoptosis induction in presence of vehicle control or BAI1. Data are representative of n = 3 independent experiments. (b) Western blot showing successful CRISPR/Cas9-mediated deletion of BAX/BAK and single BAX and BAK in U2OS cells. HSP60 was used as loading control. Image is representative of two separate blots. (c) Representative image of TOM20 (green) and BAX6A7 (red) in senescent (IR) MRC5 fibroblasts treated with DMSO or BAI1 (scale bar is 25 µm). (d) Percentage of MRC5 fibroblasts containing BAX6A7-positive mitochondria following BAI1 treatment (n = 3 independent experiments). (e) mRNA expression levels of the indicated SASP genes in BAI1-treated senescent MRC5 fibroblasts (n = 3 independent experiments). (f) Heatmap showing secreted levels of IL-6, IL-8 and IP-10 in proliferating and senescent MRC5 fibroblasts treated with different concentrations of BAI1. Values are shown as fold change to proliferating controls. Data are mean of n = 4 independent experiments. (g) Percentage death of vehicle- or BAI1- treated proliferating and senescent cells upon ABT263 treatment at the concentrations indicated. Data are mean of n = 3 technical replicates ± S.E.M. mRNA levels of (h) IL-6, (i) IL-8, and (j) IL-1β in control (EmptyCRISPR) and BAX/BAK-/- MRC5 fibroblasts treated with Herring testes DNA (HT-DNA) with or without BAI1 (n = 3 independent experiments). mRNA expression levels of (k) IL-6, (l) IL-1α, (m) IL-1β, and (n) IL-8 in senescent cells treated with eltrombopagan (EO) (n = 3 independent experiments). Data are mean ± S.E.M. Statistical significance was assessed using one-way ANOVA followed by Tukey’s multiple comparison test (d, f, k-n), two-way ANOVA followed by Sidak’s multiple comparisons test (h-j) or Tukey’s multiple comparison test (a, e, g). For gel source data (b), see Supplementary Fig. 1. Source data
Extended Data Fig. 10
Extended Data Fig. 10. Treatment with BAI1 improves healthspan and reduces inflammation but it does not affect lifespan of aged mice.
(a) Neuromuscular coordination shown as a percentage number of successful attempts (green) to remain on a straight rod for 60 s (n = 7 vehicle and n = 8 BAI1-treated mice). (b) Kaplan-Meier survival curves of animals treated with vehicle (n = 38) or Bax inhibitor (n = 39) from 18–20 months old until death. (c) Heatmap showing levels of cytokines found in plasma from mice treated with vehicle or BAI1. Values are shown as fold change compared to vehicle-treated animals. Red denotes high expression and blue indicates low expression. d) Table summarizing μCT-derived parameters obtained for the spine and femur from vehicle (n = 6) and BAI1-treated mice (n = 10). e) mRNA expression of p16, p21 and p53 in control (n = 6) and BAI-1 treated mice (n = 10). f) (left) Heatmap showing mRNA expression of the indicated SASP factors in the brain from aged animals treated with BAI1 (p = 0.04). (right) Graphs showing quantification of levels of mRNA of the indicated genes in brains from aged mice treated with BAI1 (n = 8 vehicle- and n = 7 BAI1-treated mice). Data are mean ± S.E.M. Statistical significance was assessed using two-sided Student’s unpaired t-test (d, f), MANOVA (heatmap in f). Source data

References

    1. Gorgoulis V, et al. Cellular senescence: defining a path forward. Cell. 2019;179:813–827. doi: 10.1016/j.cell.2019.10.005. - DOI - PubMed
    1. Correia-Melo C, et al. Mitochondria are required for pro-ageing features of the senescent phenotype. EMBO J. 2016;35:724–742. doi: 10.15252/embj.201592862. - DOI - PMC - PubMed
    1. Bock FJ, Tait SWG. Mitochondria as multifaceted regulators of cell death. Nat. Rev. Mol. Cell Biol. 2020;21:85–100. doi: 10.1038/s41580-019-0173-8. - DOI - PubMed
    1. Hayflick L, Moorhead PS. The serial cultivation of human diploid cell strains. Exp. Cell. Res. 1961;25:585–621. doi: 10.1016/0014-4827(61)90192-6. - DOI - PubMed
    1. Coppé J-P, et al. Senescence-associated secretory phenotypes reveal cell-nonautonomous functions of oncogenic RAS and the p53 tumor suppressor. PLoS Biol. 2008;6:e301. doi: 10.1371/journal.pbio.0060301. - DOI - PMC - PubMed

Publication types