

Flexible circuit mechanisms for context-dependent song sequencing
- PMID: 37821705
- PMCID: PMC10600009
- DOI: 10.1038/s41586-023-06632-1
Flexible circuit mechanisms for context-dependent song sequencing
Abstract
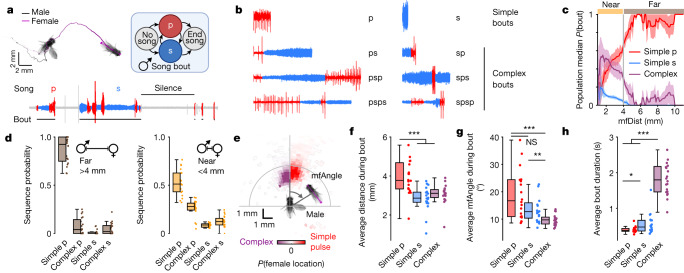
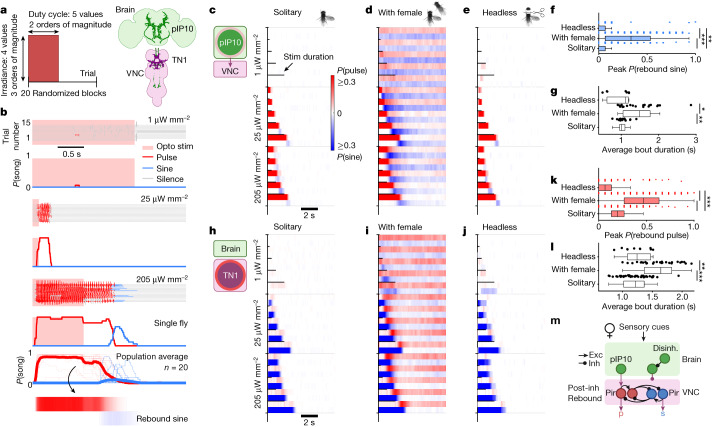
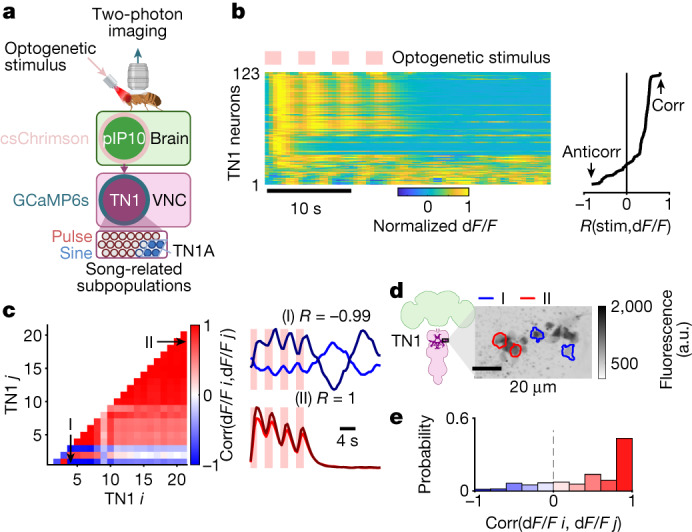
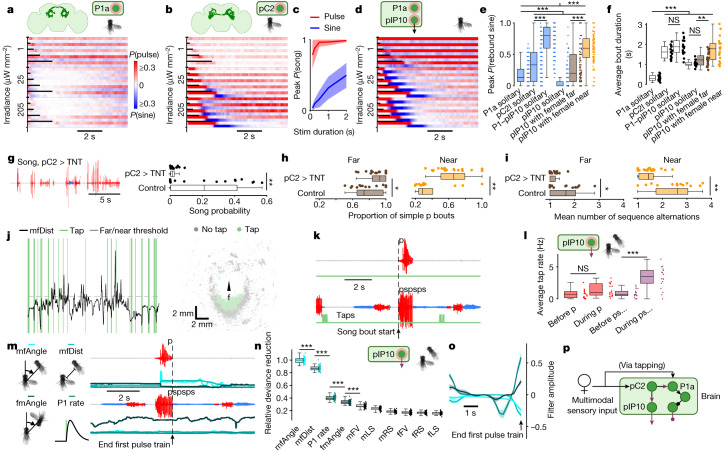
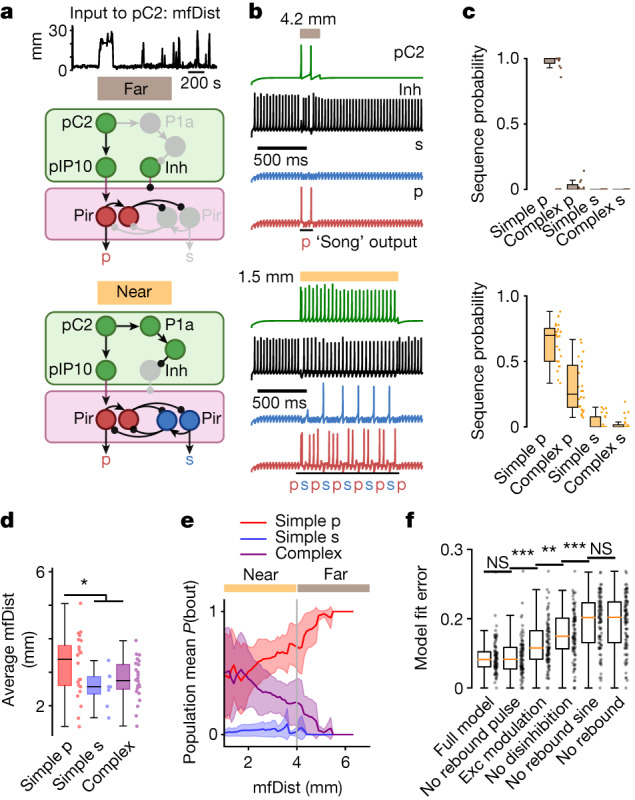
Sequenced behaviours, including locomotion, reaching and vocalization, are patterned differently in different contexts, enabling animals to adjust to their environments. How contextual information shapes neural activity to flexibly alter the patterning of actions is not fully understood. Previous work has indicated that this could be achieved via parallel motor circuits, with differing sensitivities to context1,2. Here we demonstrate that a single pathway operates in two regimes dependent on recent sensory history. We leverage the Drosophila song production system3 to investigate the role of several neuron types4-7 in song patterning near versus far from the female fly. Male flies sing 'simple' trains of only one mode far from the female fly but complex song sequences comprising alternations between modes when near her. We find that ventral nerve cord (VNC) circuits are shaped by mutual inhibition and rebound excitability8 between nodes driving the two song modes. Brief sensory input to a direct brain-to-VNC excitatory pathway drives simple song far from the female, whereas prolonged input enables complex song production via simultaneous recruitment of functional disinhibition of VNC circuitry. Thus, female proximity unlocks motor circuit dynamics in the correct context. We construct a compact circuit model to demonstrate that the identified mechanisms suffice to replicate natural song dynamics. These results highlight how canonical circuit motifs8,9 can be combined to enable circuit flexibility required for dynamic communication.
© 2023. The Author(s).
Conflict of interest statement
The authors declare no competing interests.
Figures


References
Publication types
MeSH terms
Grants and funding
LinkOut - more resources
Full Text Sources
Molecular Biology Databases
