. 2023 Oct;622(7984):775-783.
doi: 10.1038/s41586-023-06560-0. Epub 2023 Oct 11.

Mexican Biobank advances population and medical genomics of diverse ancestries

Affiliations

Mexican Biobank advances population and medical genomics of diverse ancestries

Mashaal Sohail et al. Nature. 2023 Oct.

Abstract

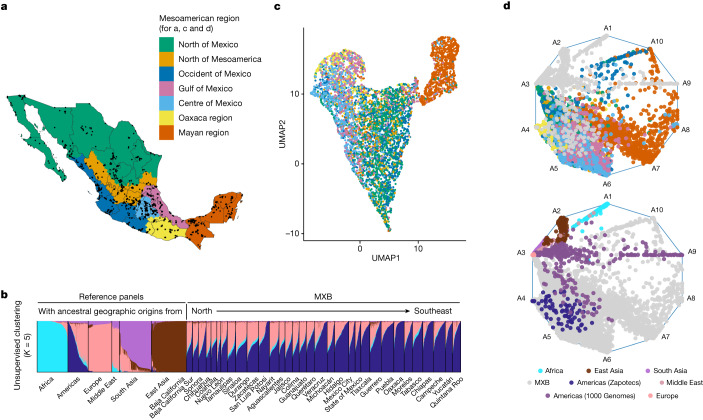
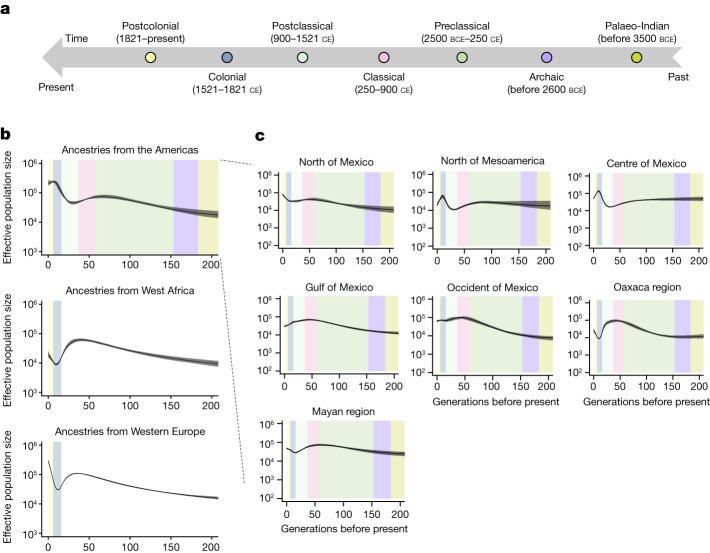
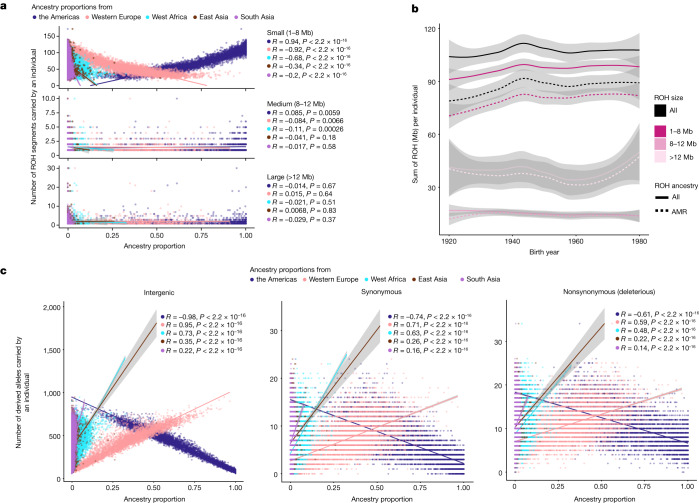
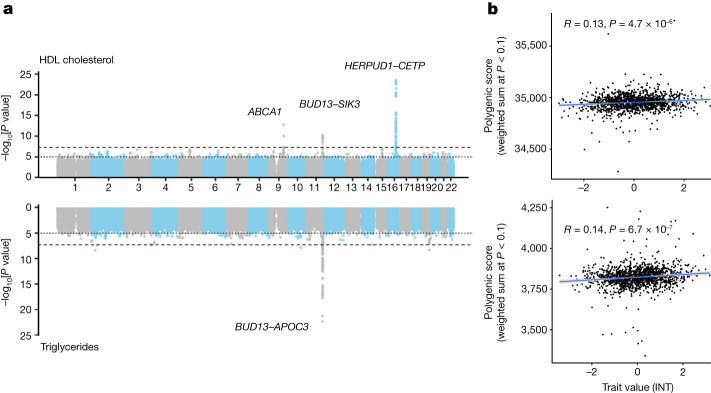
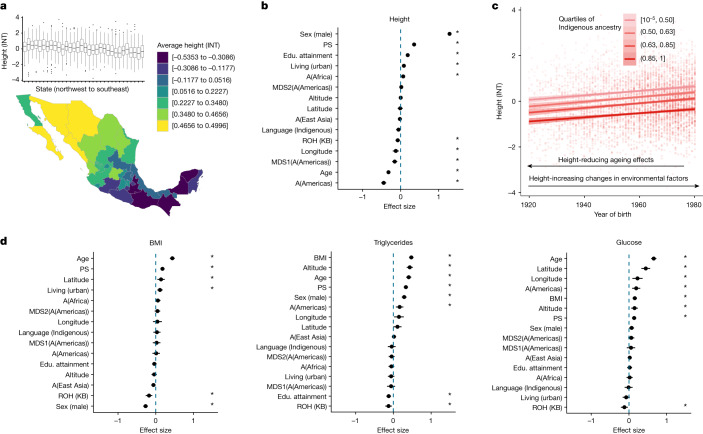
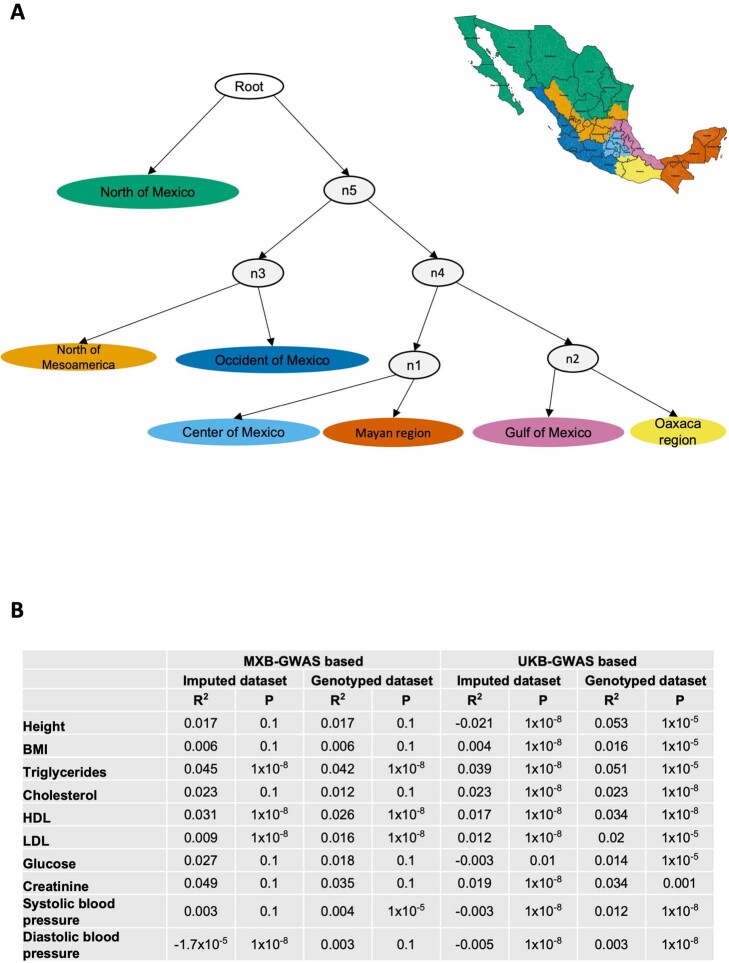
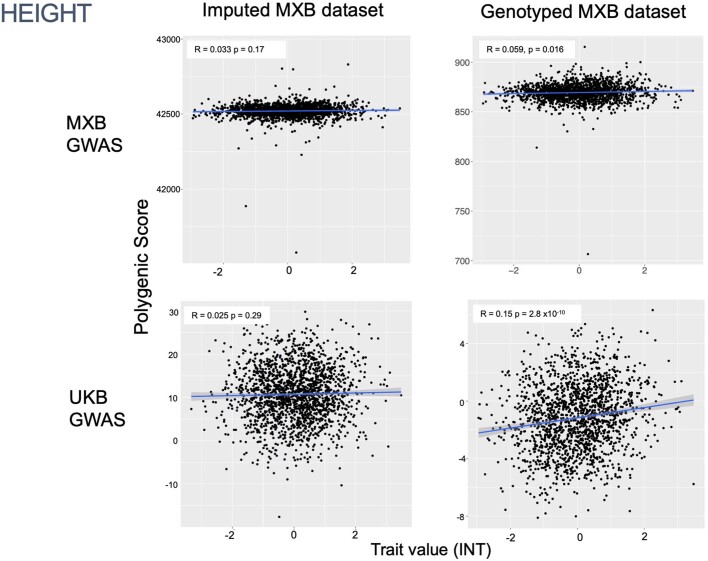
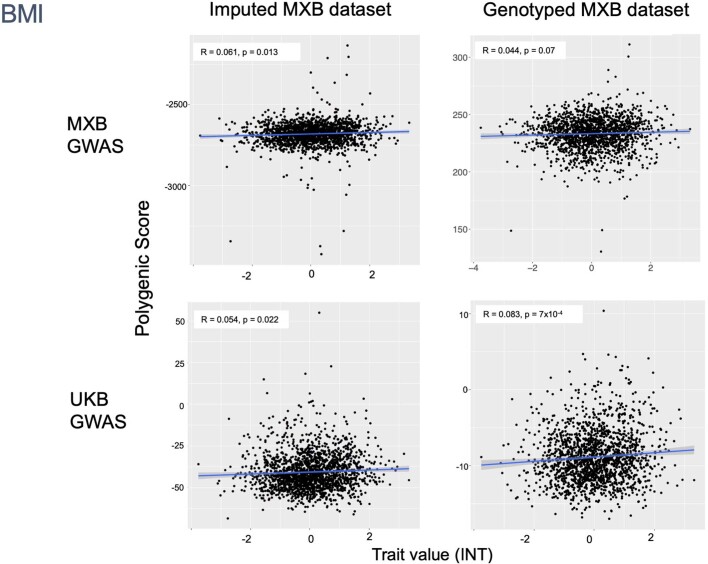
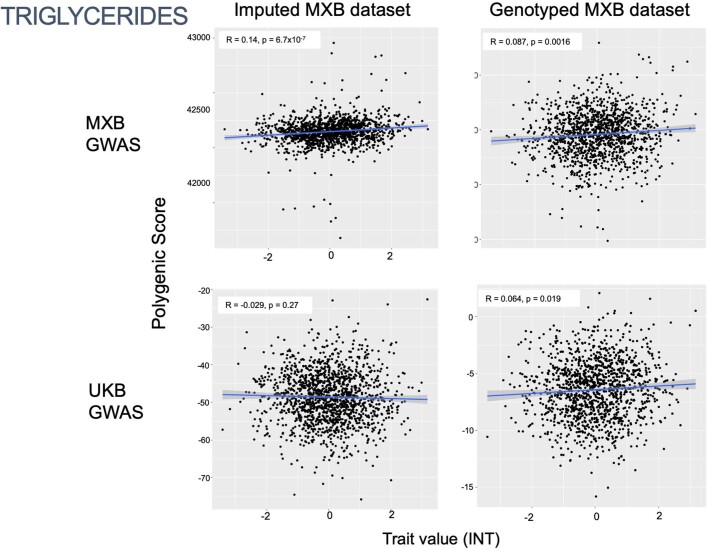
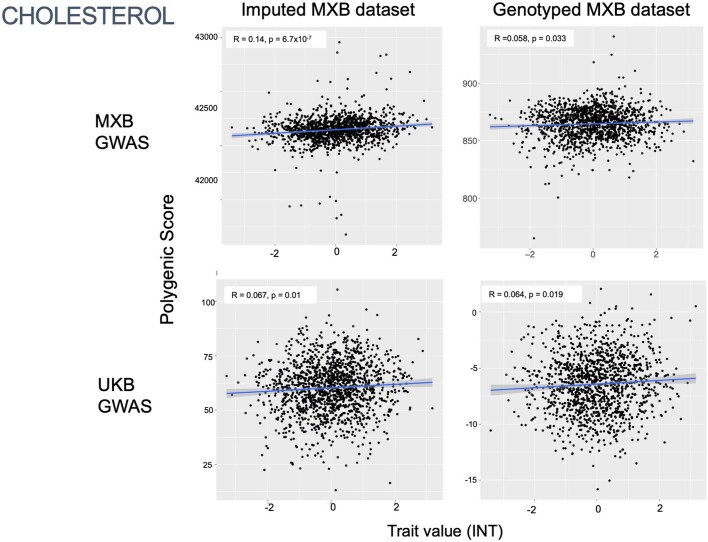
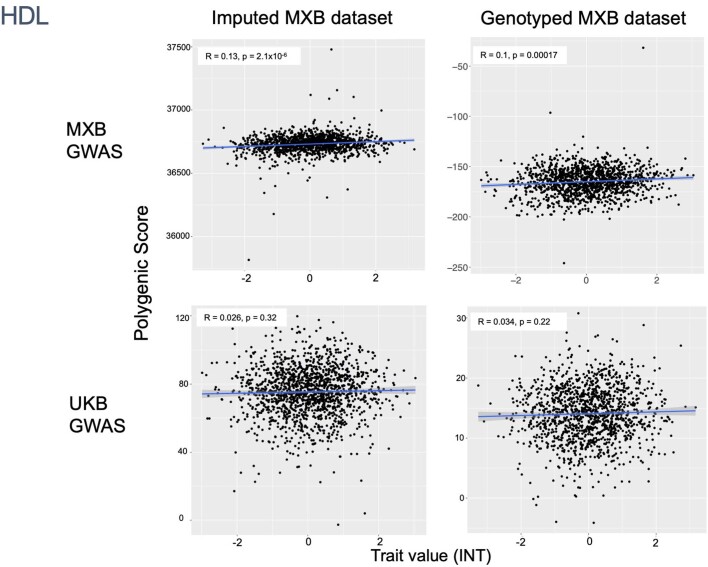
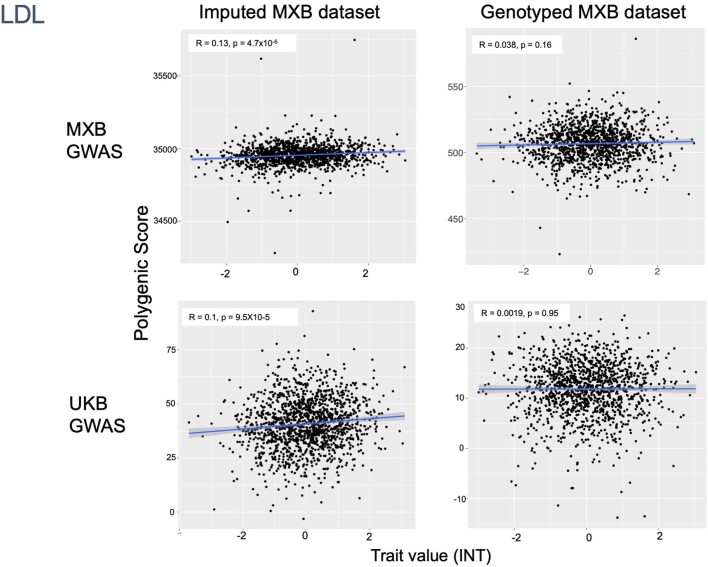
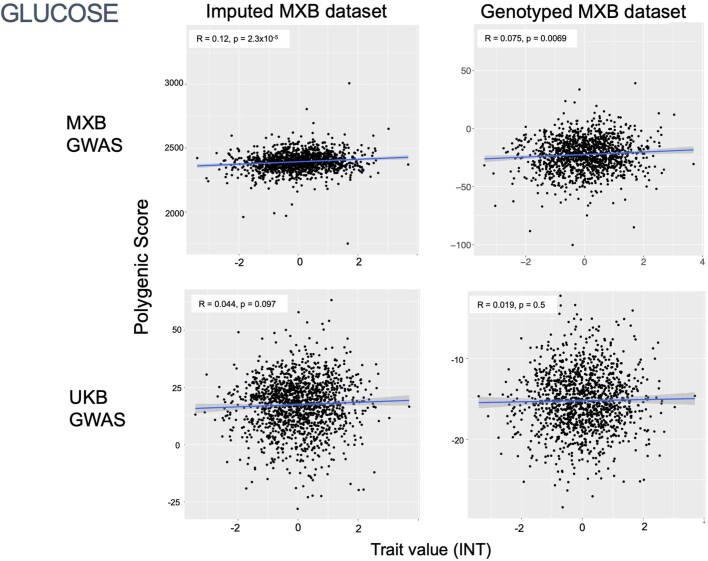
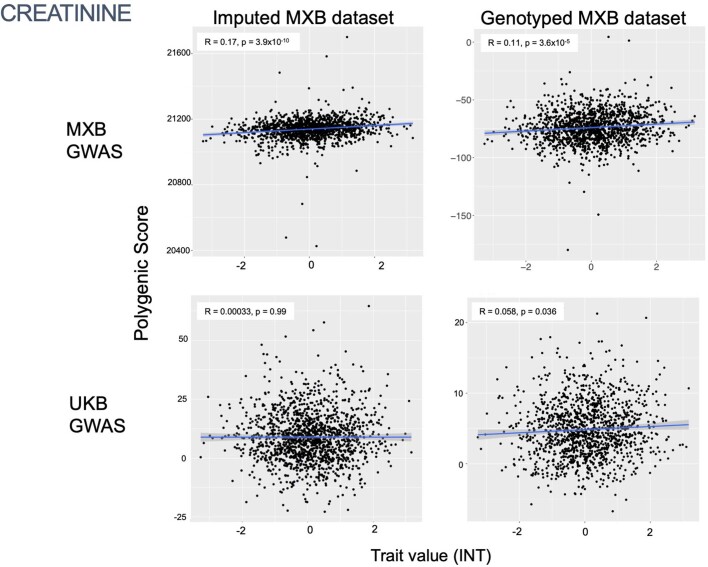
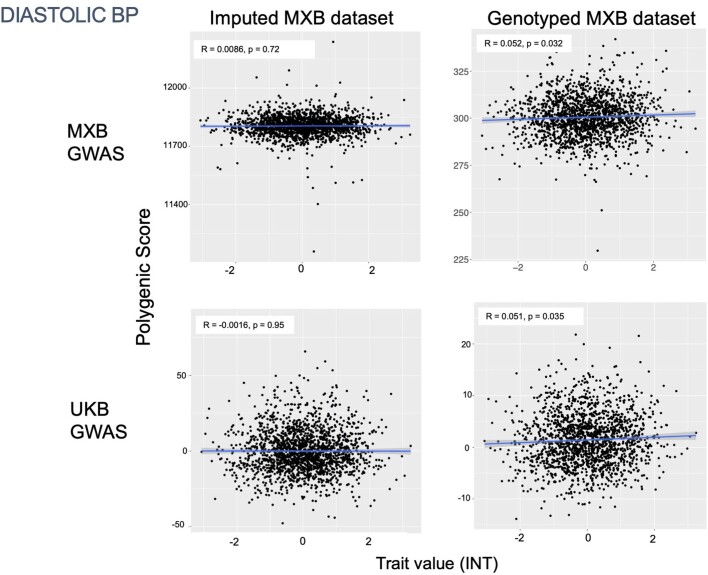
Latin America continues to be severely underrepresented in genomics research, and fine-scale genetic histories and complex trait architectures remain hidden owing to insufficient data1. To fill this gap, the Mexican Biobank project genotyped 6,057 individuals from 898 rural and urban localities across all 32 states in Mexico at a resolution of 1.8 million genome-wide markers with linked complex trait and disease information creating a valuable nationwide genotype-phenotype database. Here, using ancestry deconvolution and inference of identity-by-descent segments, we inferred ancestral population sizes across Mesoamerican regions over time, unravelling Indigenous, colonial and postcolonial demographic dynamics2-6. We observed variation in runs of homozygosity among genomic regions with different ancestries reflecting distinct demographic histories and, in turn, different distributions of rare deleterious variants. We conducted genome-wide association studies (GWAS) for 22 complex traits and found that several traits are better predicted using the Mexican Biobank GWAS compared to the UK Biobank GWAS7,8. We identified genetic and environmental factors associating with trait variation, such as the length of the genome in runs of homozygosity as a predictor for body mass index, triglycerides, glucose and height. This study provides insights into the genetic histories of individuals in Mexico and dissects their complex trait architectures, both crucial for making precision and preventive medicine initiatives accessible worldwide.


Conflict of interest statement

The authors declare no competing interests.

Figures

Fig. 1
Fig. 1. Mosaic ancestral patterns in the MXB and the genetic diversity within Mexico.
a, Sampling for the MXB (n = 5,812 individuals with latitude and longitude values), showing Mexico regionalized into Mesoamerican regions according to an anthropological and archaeological context. b, Unsupervised clustering using ADMIXTURE and global reference panels (n = 9,007 including MXB) from the 1000 Genomes Project, the Human Genome Diversity Project and the Population Architecture using Genomics and Epidemiology Study. c, Uniform manifold approximation and projection (UMAP) analysis of MXB (= 5,622) coloured by Mesoamerican region. d, Archetypal analysis of MXB (n = 5,833) with reference global individuals as in b, coloured by region (top) or in grey (bottom). This approach determines each individual’s position in a ten-dimensional space that in this visualization is reduced to two dimensions. Reference individuals (bottom) are coloured using ADMIXTURE inferred clusters from b. For example, for the Americas (1000 Genomes) and Middle East, where multiple clusters are inferred, a colour combining these cluster colours is used.
Fig. 2
Fig. 2. Effective population size (Ne) values across ancestries and geographies reveal the histories present within Mexico.
a, Mesoamerican chronology colouring different periods in Mesoamerican history using an anthropological and archaeological context. b, Ancestry-specific effective population size (Ne) changes over the past 200 generations across Mexico (n = 5,436) inferred using IBD tracts, coloured by chronology from a assuming 30 years per generation. c, Ancestry-specific effective population size (Ne) changes over time for ancestries from the Americas in different regions of Mexico (see Supplementary Figs. 25–29 for other generation intervals and ancestries). n = 1,177, 640, 952, 590, 820, 315 and 938 for the north of Mexico, north of Mesoamerica, centre of Mexico, Gulf of Mexico, occident of Mexico, Oaxaca region and the Mayan region, respectively.
Fig. 3
Fig. 3. Demographic histories affect patterns of genetic variation in Mexico.
a, Small ROH prevalence is correlated with ancestry proxies inferred from ADMIXTURE reflecting an ancient bottleneck or relatively small population size in the past (n = 5,833 individuals). b, Sum of ROH per individual as a function of birth year (n = 5,833 individuals). Solid lines show ROH overall, and dashed lines indicate ROH overlapping ancestries from the Americas (AMR). ROH are divided into small, medium and large ROH, as in a. Smoothed conditional mean lines are shown using the locally estimated scatterplot smoothing method. Error bands represent 95% confidence intervals. c, Mutation burden in different ancestries shows the effects of bottleneck events in causing loss of rare variants (n = 5,818 individuals). Rare variants are correlated with levels of ancestries from the Americas, Western Europe or West Africa for rare variants (derived allele frequency ≤ 5%). Smoothed conditional mean lines are shown using a linear model. Error bands represent 95% confidence intervals. Spearman correlation values are shown (R and two-sided P values) for all ancestries. Analysis of whole-genome sequences from 1000 Genomes MXL samples shows that the rare mutation burden result is robust to ascertainment bias of Illumina’s Multi-Ethnic Global Array (Supplementary Figs. 39 and 40). Variants were annotated using the Variant Effect Predictor tool, and nonsynonymous (deleterious) variants are a combined set of missense variants predicted to be damaging by polyphen2 along with splice, stop lost and stop gained variants.
Fig. 4
Fig. 4. Illustrative examples of GWAS and polygenic prediction in the MXB.
a, Manhattan plots showing GWAS results for HDL cholesterol (top, n = 4,484) and triglycerides (bottom, n = 4,483) in the full MXB dataset. Fine-mapped genes are labelled (Methods). To aid with visualization, 1 in 200 SNPs with P > 0.01 were sampled for the Manhattan plots. b, Prediction performance is measured by the correlation between polygenic score (the sum of all alleles associated at P < 0.1 weighted by their estimated effect sizes) and trait value (as measured by Pearson correlation R and its associated two-sided P value) for HDL cholesterol (top, n = 1,327) and triglycerides (bottom, n = 1,326). According to the schematic in Supplementary Fig. 41, for b, GWAS was carried out in two-thirds of the MXB, and the remaining one-third of the MXB was used to compute polygenic scores and test their ability to predict complex traits. Smoothed conditional mean lines are shown using a linear model. Error bands represent 95% confidence intervals. Scores were computed using TOPMed-imputed MXB genotypes. Traits were normalized using an inverse normal transform (INT) for both a and b. For further evaluation of prediction performance, see Extended Data Figs. 1b and 2–10 and Supplementary Tables 8 and 9.
Fig. 5
Fig. 5. An analysis of the factors influencing height and other complex trait variation.
a, Bottom: map of average height in Mexico (n = 5,770). Height was normalized using an INT. Top: box plots of height (INT) variation in each state from northwest to southeast. The box plots show the median value and the quartiles. Whiskers extend to the minimum and the maximum values. The dots represent outliers. n = 5,846 biologically independent samples were used for the analysis. b, Explanatory model for height variation implicates the role of genetics and environment. The plot shows effect-size estimates and confidence intervals (1.96 × s.e.m.) from a mixed-model analysis. All quantitative predictors are centred and scaled by 2 standard deviations. Asterisks show significance at false discovery rate < 0.05 across traits and predictors analysed. n = 4,625 biologically independent samples were used for the analysis. c, Height as a function of birth year in quartiles of ancestries from the Americas (n = 5,598). Error bands represent 95% confidence intervals. d, Trait profiles for BMI (left), triglycerides (middle) and glucose (right). Results of mixed-model analysis, as in b. The plot shows effect-size estimates and confidence intervals (1.96 × s.e.m.) from a mixed-model analysis. n = 4,607, 3,664 and 3,613 biologically independent samples were used for the analysis for BMI, triglycerides and glucose, respectively. For b and d, PS are polygenic scores computed using UKB summary statistics (SNPs significant at P < 108), A(Africa/East Asia/Americas) refers to ancestry proportions from that region as inferred from ADMIXTURE, and MDS1(A(Americas)) and MDS2(A(Americas)) refers to multidimensional scaling (MDS) axes within ancestries from the Americas as inferred using a MAAS-MDS analysis (Supplementary Fig. 24). Educational (Edu.) attainment is on a scale from 0 to 8 (low to high educational attainment), and altitude is measured in metres (low to high).
Extended Data Fig. 1
Extended Data Fig. 1. Genetic histories and polygenic prediction in the MXB.
A) Admixture histories of individuals in different cultural regions using an AdmixtureBayes approach. Here the admixture graph with the highest posterior probability is shown, inferred using genomic regions with ancestries from the Americas. Internal inferred ancestral node populations are colored grey. The tree is rooted using the Han as an outgroup. B) Trait variance explained and p-value threshold of best predictive polygenic score using MXB-GWAS-based or UKB-GWAS-based prediction. Polygenic scores were computed using SNPs significant at five different p-value thresholds (0.1, 0.01, 0.001, 0.00001, 10−8). A linear null model was created for each trait including age, sex and 10 principal components as covariates. A second polygenic score model was created adding the polygenic score to the null model. We computed the R2 of the polygenic score by taking the difference between the R2 of the polygenic score model and the R2 of the null model. The maximum R2 was used to the pick the p-value threshold for the best predictive polygenic score shown in the table.
Extended Data Fig. 2
Extended Data Fig. 2. Prediction performance of MXB-GWAS-based or UKB-GWAS-based polygenic scores computed for height in the MXB.
Traits are inverse normalized. Prediction performance is measured by the correlation between polygenic score (the sum of all alleles associated at p < 0.1 weighted by their estimated effect sizes) and trait value (Pearson correlation R and associated two-sided p-value). Smoothed conditional mean lines are shown using a linear model. Error bands represent 95% confidence intervals.
Extended Data Fig. 3
Extended Data Fig. 3. Prediction performance of MXB-GWAS-based or UKB-GWAS-based polygenic scores computed for BMI in the MXB.
Traits are inverse normalized. Prediction performance is measured by the correlation between polygenic score (the sum of all alleles associated at p < 0.1 weighted by their estimated effect sizes) and trait value (Pearson correlation R and associated two-sided p-value). Smoothed conditional mean lines are shown using a linear model. Error bands represent 95% confidence intervals.
Extended Data Fig. 4
Extended Data Fig. 4. Prediction performance of MXB-GWAS-based or UKB-GWAS-based polygenic scores computed for triglycerides in the MXB.
Traits are inverse normalized. Prediction performance is measured by the correlation between polygenic score (the sum of all alleles associated at p < 0.1 weighted by their estimated effect sizes) and trait value (Pearson correlation R and associated two-sided p-value). Smoothed conditional mean lines are shown using a linear model. Error bands represent 95% confidence intervals.
Extended Data Fig. 5
Extended Data Fig. 5. Prediction performance of MXB-GWAS-based or UKB-GWAS-based polygenic scores computed for cholesterol in the MXB.
Traits are inverse normalized. Prediction performance is measured by the correlation between polygenic score (the sum of all alleles associated at p < 0.1 weighted by their estimated effect sizes) and trait value (Pearson correlation R and associated two-sided p-value). Smoothed conditional mean lines are shown using a linear model. Error bands represent 95% confidence intervals.
Extended Data Fig. 6
Extended Data Fig. 6. Prediction performance of MXB-GWAS-based or UKB-GWAS-based polygenic scores computed for HDL in the MXB.
Traits are inverse normalized. Prediction performance is measured by the correlation between polygenic score (the sum of all alleles associated at p < 0.1 weighted by their estimated effect sizes) and trait value (Pearson correlation R and associated two-sided p-value). Smoothed conditional mean lines are shown using a linear model. Error bands represent 95% confidence intervals.
Extended Data Fig. 7
Extended Data Fig. 7. Prediction performance of MXB-GWAS-based or UKB-GWAS-based polygenic scores computed for LDL in the MXB.
Traits are inverse normalized. Prediction performance is measured by the correlation between polygenic score (the sum of all alleles associated at p < 0.1 weighted by their estimated effect sizes) and trait value (Pearson correlation R and associated two-sided p-value). Smoothed conditional mean lines are shown using a linear model. Error bands represent 95% confidence intervals.
Extended Data Fig. 8
Extended Data Fig. 8. Prediction performance of MXB-GWAS-based or UKB-GWAS-based polygenic scores computed for glucose in the MXB.
Traits are inverse normalized. Prediction performance is measured by the correlation between polygenic score (the sum of all alleles associated at p < 0.1 weighted by their estimated effect sizes) and trait value (Pearson correlation R and associated two-sided p-value). Smoothed conditional mean lines are shown using a linear model. Error bands represent 95% confidence intervals.
Extended Data Fig. 9
Extended Data Fig. 9. Prediction performance of MXB-GWAS-based or UKB-GWAS-based polygenic scores computed for creatinine in the MXB.
Traits are inverse normalized. Prediction performance is measured by the correlation between polygenic score (the sum of all alleles associated at p < 0.1 weighted by their estimated effect sizes) and trait value (Pearson correlation R and associated two-sided p-value). Smoothed conditional mean lines are shown using a linear model. Error bands represent 95% confidence intervals.
Extended Data Fig. 10
Extended Data Fig. 10. Prediction performance of MXB-GWAS-based or UKB-GWAS-based polygenic scores computed for diastolic blood pressure in the MXB.
Traits are inverse normalized. Prediction performance is measured by the correlation between polygenic score (the sum of all alleles associated at p < 0.1 weighted by their estimated effect sizes) and trait value (Pearson correlation R and associated two-sided p-value). Smoothed conditional mean lines are shown using a linear model. Error bands represent 95% confidence intervals.

References

    1. Mills MC, Rahal C. The GWAS Diversity Monitor tracks diversity by disease in real time. Nat. Genet. 2020;52:242–243. doi: 10.1038/s41588-020-0580-y. - DOI - PubMed
    1. Maples BK, Gravel S, Kenny EE, Bustamante CD. RFMix: a discriminative modeling approach for rapid and robust local-ancestry inference. Am. J. Hum. Genet. 2013;93:278–288. doi: 10.1016/j.ajhg.2013.06.020. - DOI - PMC - PubMed
    1. Hilmarsson, H., Kumar, A. S., Rastogi, R. & Bustamante, C. D. High resolution ancestry deconvolution for next generation genomic data. Preprint at bioRxiv10.1101/2021.09.19.460980 (2021).
    1. Browning SR, et al. Ancestry-specific recent effective population size in the Americas. PLoS Genet. 2018;14:e1007385. doi: 10.1371/journal.pgen.1007385. - DOI - PMC - PubMed
    1. Gimbernat-Mayol, J., Mantes, A. D., Bustamante, C. D., Montserrat, D. M. & Ioannidis, A. G. Archetypal analysis for population genetics. PLoS Comput. Biol.18, e1010301 (2022). - PMC - PubMed

Publication types

MeSH terms