. 2023 Oct;622(7984):784-793.
doi: 10.1038/s41586-023-06595-3. Epub 2023 Oct 11.

Genotyping, sequencing and analysis of 140,000 adults from Mexico City

Collaborators, Affiliations

Genotyping, sequencing and analysis of 140,000 adults from Mexico City

Andrey Ziyatdinov et al. Nature. 2023 Oct.

Erratum in

  • Author Correction: Genotyping, sequencing and analysis of 140,000 adults from Mexico City.
    Ziyatdinov A, Torres J, Alegre-Díaz J, Backman J, Mbatchou J, Turner M, Gaynor SM, Joseph T, Zou Y, Liu D, Wade R, Staples J, Panea R, Popov A, Bai X, Balasubramanian S, Habegger L, Lanche R, Lopez A, Maxwell E, Jones M, García-Ortiz H, Ramirez-Reyes R, Santacruz-Benítez R, Nag A, Smith KR, Damask A, Lin N, Paulding C, Reppell M, Zöllner S, Jorgenson E, Salerno W, Petrovski S, Overton J, Reid J, Thornton TA, Abecasis G, Berumen J, Orozco-Orozco L, Collins R; Regeneron Genetics Center; Mexico City Prospective Study; Baras A, Hill MR, Emberson JR, Marchini J, Kuri-Morales P, Tapia-Conyer R. Ziyatdinov A, et al. Nature. 2024 Feb;626(8001):E18. doi: 10.1038/s41586-024-07051-6. Nature. 2024. PMID: 38332034 Free PMC article. No abstract available.

Abstract

The Mexico City Prospective Study is a prospective cohort of more than 150,000 adults recruited two decades ago from the urban districts of Coyoacán and Iztapalapa in Mexico City1. Here we generated genotype and exome-sequencing data for all individuals and whole-genome sequencing data for 9,950 selected individuals. We describe high levels of relatedness and substantial heterogeneity in ancestry composition across individuals. Most sequenced individuals had admixed Indigenous American, European and African ancestry, with extensive admixture from Indigenous populations in central, southern and southeastern Mexico. Indigenous Mexican segments of the genome had lower levels of coding variation but an excess of homozygous loss-of-function variants compared with segments of African and European origin. We estimated ancestry-specific allele frequencies at 142 million genomic variants, with an effective sample size of 91,856 for Indigenous Mexican ancestry at exome variants, all available through a public browser. Using whole-genome sequencing, we developed an imputation reference panel that outperforms existing panels at common variants in individuals with high proportions of central, southern and southeastern Indigenous Mexican ancestry. Our work illustrates the value of genetic studies in diverse populations and provides foundational imputation and allele frequency resources for future genetic studies in Mexico and in the United States, where the Hispanic/Latino population is predominantly of Mexican descent.


Conflict of interest statement

A.Z., J. Backman, J. Mbatchou, S.M.G., T.J., Y.Z., D.L., J.S., R.P., A.P., X.B., S.B., L.H., R.L., A.L., E.M., M.J., A.D., N.L., C.P., E.J., W.S., J.O., J.R., T.A.T., G.A., A.B. and J. Marchini are current employees and/or stockholders of Regeneron Genetics Center or Regeneron Pharmaceuticals. A.N., K.R.S. and S.P. are current employees and/or stockholders of AstraZeneca. M.P. is a current employee and stockholder of AbbVie. All remaining authors declare no competing interests relevant to the current paper.

Figures

Fig. 1
Fig. 1. Familial relatedness.
a, Percentage of the genome estimated to have zero, one or two alleles identical-by-descent (IBD). b, Distribution of the number of relatives that participants have in the MCPS cohort. The height of each bar shows the count of participants with the stated number of relatives. The colours indicate the proportions of each relatedness class within each bar.
Fig. 2
Fig. 2. PCA analysis of the MCPS data together with Indigenous Mexican, European and African datasets.
a,b, A total of 500 MCPS samples were used for analyses, together with 108 African Yoruba (KG_AFR_YRI) and 107 European Iberian (KG_EUR_IBS) samples from the 1000 Genomes project (KG) dataset, and 591 unrelated samples from 60 Indigenous Mexican populations corresponding to central, southern, southeastern, northern and northwestern regions of Mexico from the MAIS. c,d, These analyses used an unrelated set of 58,051 samples together with the 1000 Genomes and MAIS samples. All other MCPS samples are projected onto the axes.
Fig. 3
Fig. 3. Global ancestry proportions estimated from LAI.
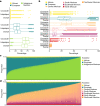
a,b, Distributions of LAI-based global ancestry proportions for n = 138,511 MCPS individuals from a 7-way analysis (b) and reduced to 3 continental populations (a). c,d, Stacked bar plots of three-way (c) and seven-way (d) global ancestry proportions for n = 138,511 MCPS individuals.
Fig. 4
Fig. 4. Imputation accuracy using the MCPS10k and TOPMed imputation panels.
a,b, Accuracy was measured using the R2 between the imputed variants and 128,728 variants measured using exome sequencing on chromosome 2 in 67,079 MCPS samples not in (or related to) the MCPS reference panel samples. Results are stratified by allele frequency (x axis on log10 scale), reference panel and into two populations (top and bottom 50% of Indigenous Mexican ancestry shown by solid and dashed lines). a, Results for all samples. b, Results stratified by the amount of Indigenous Mexican estimated in each sample.
Fig. 5
Fig. 5. Allele frequency comparison between MCPS WES and gnomAD.
Allele frequencies on linear (top) and log (bottom) scale. The comparisons from left to right are MCPS European versus gnomAD non-Finnish European, MCPS African versus gnomAD African/African American, MCPS Indigenous Mexican versus gnomAD Latino/Admixed American, and MCPS all versus gnomAD Latino/Admixed American.
Extended Data Fig. 1
Extended Data Fig. 1. Pairwise measures of relatedness.
(A) IBD0 vs IBD1, (B) IBD1 vs IBD2, and (C) IBD0 vs Kinship coefficient.
Extended Data Fig. 2
Extended Data Fig. 2. Graph of second-degree family networks of size four or greater.
Plot created using the Graphviz software with the sfdp layout engine which uses a “spring” model that relies on a force-directed approach to minimize edge length.
Extended Data Fig. 3
Extended Data Fig. 3. ADMIXTURE ancestry proportion estimates.
The program ADMIXTURE was used to estimate per-individual ancestry proportions and population-specific allele frequencies in a panel of 3,964 reference samples, including 1,000 MCPS samples. The remaining set of 137,511 MCPS samples were projected into the admixture model using parameter estimates from the reference sample. Results are shown for the K = 18 model that attained the lowest cross-validation error. Ancestry proportion estimates for reference samples of African, European, and Indigenous American ancestry from the 1KG, HGDP, and MAIS datasets are shown in the top row and estimates for MCPS participants are shown in the bottom row. AA=African American.
Extended Data Fig. 4
Extended Data Fig. 4. Genome-wide distribution of local ancestry proportions.
The ancestry dosages inferred by RFMix are averaged across 78,833 unrelated MCPS samples and plotted along the genome. For each panel (or Chromosome) two gray rectangles denote terminal 2Mbp-length regions (of analyzed sites) at the beginning and end of Chromosome, while the red rectangle denotes the centromere region.
Extended Data Fig. 5
Extended Data Fig. 5. Distribution of ROH.
(a) Histogram of the sample counts, distribution of the per-sample number of ROH segments, and distribution of per-sample average ROH segment length are given by fraction of genome in ROH for n = 138,200 samples. Data in box plots are presented with the median as the center, the box bounded by the 25th and 75th percentiles, whiskers extending from the box to values within 1.5*IQR (Interquartile Range), and outlying values such as minima/maxima as bpoints. (b) For each individual, the total length, average length, and fraction of genome in ROH is given by number of ROH.
Extended Data Fig. 6
Extended Data Fig. 6. Comparison of MCPS10k and TOPMed imputation.
Plots show imputation info scores from MCS10k and TOPMed imputed variants in 67,079 MCPS samples at 6,473,872 variants on chromosome 2. Each plot uses a different MAF bin. The red line is Y=X. The blue dashed line is the regression line.
Extended Data Fig. 7
Extended Data Fig. 7. Portability of a UK Biobank (n=443,145) derived BMI PRS to MCPS (N = 119,864) individuals across imputation reference panels.
In panel A, the UK Biobank PRS accuracy is assessed using the incremental R2 between the BMI PRS and measured BMI (kg/m2) in MCPS individuals, divided into quartiles (N = 29,966 per quartile) by proportion of Indigenous Mexican Ancestry. Results are also stratified by the reference panel used to impute genotype dosages in MCPS (red = MCPS, blue = TOPMed). The R2 measures are denoted by a circle (MCPS) or triangle (TOPMed), with vertical bars denoting the 95% confidence interval. The BMI values used in PRS derivation were transformed (RINT by sex, ancestry PCs) and adjusted for age and age2. Panel B displays the change in BMI per BMI PRS standard deviation (SD), with mean change represented by a circle (MCPS) or triangle (TOPMed) and vertical bars denoting the 95% confidence interval. BMI regression models were adjusted for sex, age, age2, and ancestry PCs. The median proportion of Indigenous Mexican ancestry in each quartile is also shown in both panel A and B.
Extended Data Fig. 8
Extended Data Fig. 8. Portability of an MCPS (N=119,864) derived BMI PRS to UKB (N = 443,145) individuals.
In panel A, the MCPS PRS accuracy is measured using the incremental R2 between the BMI PRS and measured BMI (kg/m2) in UK Biobank individuals, stratified by 1000 Genomes-based continental ancestry (red = African [N = 8025], lime green = East Asian [N = 2110], green = European [N = 424,283], blue = Latino [N = 590], purple = South Asian [N = 8137]). The R2 measures are denoted by a circle (African), triangle (East Asian), rectangle (European), dash (Latino), and dotted rectangle (South Asian), with vertical bars denoting the 95% confidence interval. The BMI values used in PRS derivation were transformed (RINT by sex, ancestry PCs) and adjusted for age and age2. Panel B displays the change in BMI per BMI PRS standard deviation (SD) using the same color scheme based on 1000 Genomes-based continental ancestry, with the shapes denoting the mean BMI change (circle [African], triangle [East Asian], rectangle [European], dash [Latino], and dotted rectangle [South Asian] and vertical bars denoting the 95% confidence interval. BMI Regression models were adjusted for sex, age, age2, and ancestry PCs.
Extended Data Fig. 9
Extended Data Fig. 9. Schematic of ancestry-specific allele frequency estimation.
The estimation proceeds in 4 stages. To start with the array dataset is phased to produce a scaffold of common variants (top). Then local ancestry inference (LAI) is applied to the phased array dataset (left). In parallel, the WES and WGS variants are phased onto the phased array scaffold (right). Then finally the phased exome variant dataset is overlayed onto the local ancestry estimates to assign ancestry to every allele in the WES and WGS datasets (bottom). The process is probabilistic and interpolates the ancestry probabilities at the WES and WGS sites from the flanking array sites.
Extended Data Fig. 10
Extended Data Fig. 10. Allele frequency comparison between MCPS WES and gnomAD LAI estimates.
Allele frequencies on linear (top) and log (bottom) scale. The comparisons from left to right are MCPS European vs gnomAD (LAI) European, MCPS African vs gnomAD (LAI) African, MCPS Indigenous Mexican vs gnomAD Amerindigenous. The gnomAD (LAI) refers to an extension to the gnomAD v3 database with local ancestry resolved allele frequency estimates for Latino/Admixed American samples in gnomAD (see URLs). The number of high-quality variants overlapped between MCPS WES and gnomAD (LAI) is 241,307, 211,105 and 201,624 for European, African and Amerindigenous ancestries, respectively.

References

    1. Tapia-Conyer R, et al. Cohort profile: the Mexico City Prospective Study. Int. J. Epidemiol. 2006;35:243–249. doi: 10.1093/ije/dyl042. - DOI - PubMed
    1. Belbin GM, Nieves-Colón MA, Kenny EE, Moreno-Estrada A, Gignoux CR. Genetic diversity in populations across Latin America: implications for population and medical genetic studies. Curr. Opin. Genet. Dev. 2018;53:98–104. doi: 10.1016/j.gde.2018.07.006. - DOI - PubMed
    1. Garcia-Ortiz H, et al. The genomic landscape of Mexican Indigenous populations brings insights into the peopling of the Americas. Nat. Commun. 2021;12:5942. doi: 10.1038/s41467-021-26188-w. - DOI - PMC - PubMed
    1. Alvarez C, et al. BRCA1 and BRCA2 founder mutations account for 78% of germline carriers among hereditary breast cancer families in Chile. Oncotarget. 2017;8:74233–74243. doi: 10.18632/oncotarget.18815. - DOI - PMC - PubMed
    1. Gonzaga-Jauregui C, et al. Mutations in COL27A1 cause Steel syndrome and suggest a founder mutation effect in the Puerto Rican population. Eur. J. Hum. Genet. 2015;23:342–346. doi: 10.1038/ejhg.2014.107. - DOI - PMC - PubMed

Publication types