. 2023 Oct 11;6(1):1031.
doi: 10.1038/s42003-023-05396-8.

Stress-induced brain responses are associated with BMI in women

Collaborators, Affiliations

Stress-induced brain responses are associated with BMI in women

Anne Kühnel et al. Commun Biol. .

Abstract

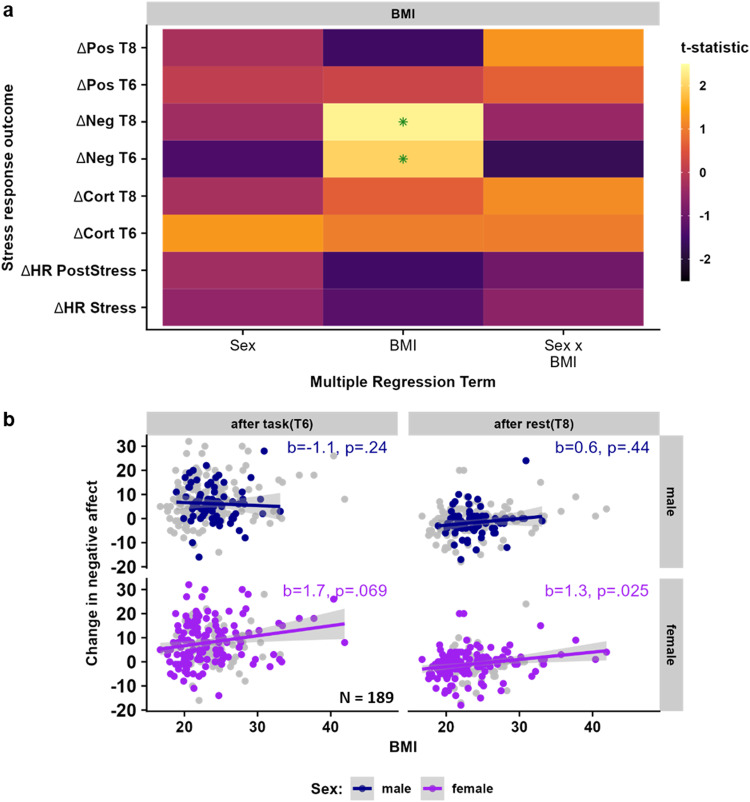
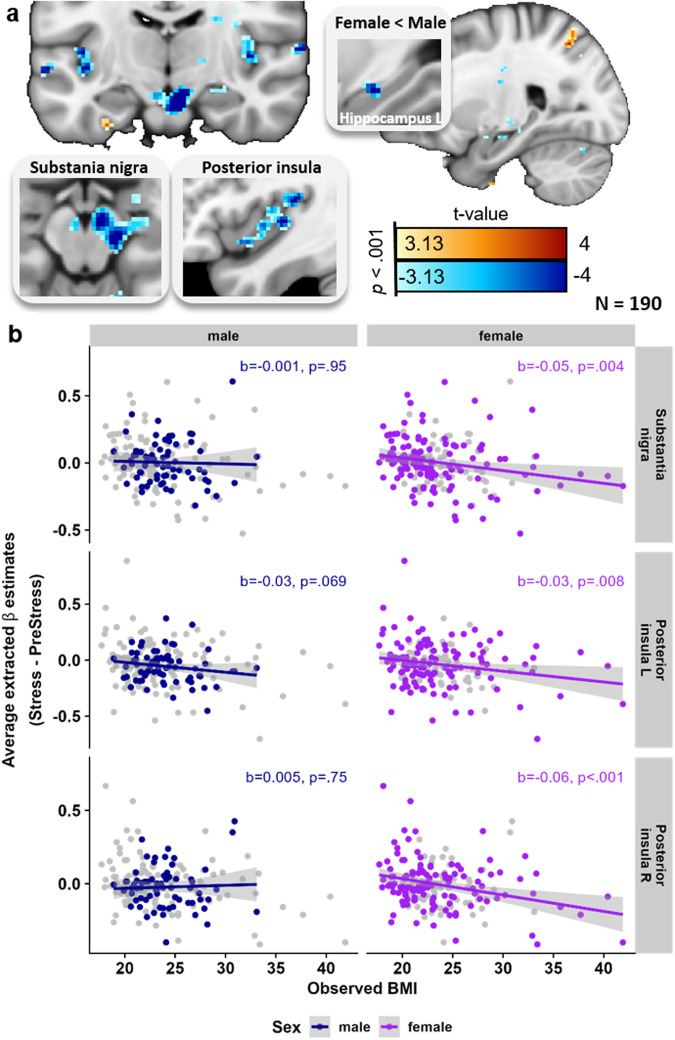
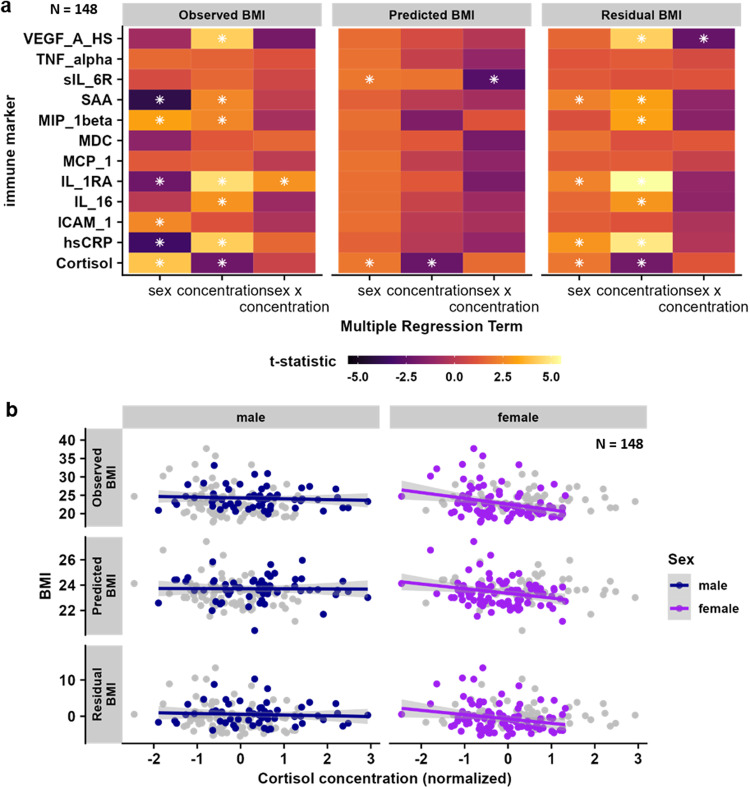
Overweight and obesity are associated with altered stress reactivity and increased inflammation. However, it is not known whether stress-induced changes in brain function scale with BMI and if such associations are driven by peripheral cytokines. Here, we investigate multimodal stress responses in a large transdiagnostic sample using predictive modeling based on spatio-temporal profiles of stress-induced changes in activation and functional connectivity. BMI is associated with increased brain responses as well as greater negative affect after stress and individual response profiles are associated with BMI in females (pperm < 0.001), but not males. Although stress-induced changes reflecting BMI are associated with baseline cortisol, there is no robust association with peripheral cytokines. To conclude, alterations in body weight and energy metabolism might scale acute brain responses to stress more strongly in females compared to males, echoing observational studies. Our findings highlight sex-dependent associations of stress with differences in endocrine markers, largely independent of peripheral inflammation.


Conflict of interest statement

The authors declare no competing interests.

Figures

Fig. 1
Fig. 1. The stress task induced a similar stress response on the endocrine, subjective, and cardiovascular level in females and males.
a Stress-induced increases (n = 189), relative to T2, (T6: b = 7.7, t(183) = −12.6, p < 0.001) in negative affect recover below baseline levels after stress (T8: b = −1.3, t(183) = −4.7, p < 0.001). At the same time, positive affect decreases (T6: b = −2.3, t(183) = −8.0, p < 0.001) but does not fully recover (T8: b = −1.1, t(183) = −2.5, p = 0.014). b Stress induces increases in heart rate (n = 165, b = 6.7, t(159) = 13, p < 0.001). During PostStress, heart rate decreases again (b = −5.8, t(159) = −12.4, p < 0.001) but does not fully recover (b = 0.9, t(159) = 2.1, p = 0.033). c Stress induces a cortisol response (n = 186) in participants not already reacting to the placement of an intravenous catheter (“non-responder”) compared to the pre-task cortisol measurement (T2). Cortisol levels recover close to baseline levels after the 30-min break. Thin lines depict individual cortisol trajectories; thick lines show group averages. The shaded area shows the timing of the stress task. d Changes in cortisol (N = 186) directly after the task (T6 – T2) and after the 30-min rest (T8 – T2) do not differ between males and females. Values in a, b, and d show residualized (age, sex, IV-cortisol response, diagnosis status) averages and confidence intervals (95% CI) for males and females separately. Source data are provided in the Supplementary Data 1.
Fig. 2
Fig. 2. Stress-induced increases in negative affect are larger in participants with a high body mass index (BMI).
a Estimates for the effects of sex, BMI, and their interaction from regression models of multi-level stress responses (subjective response: n = 189 participants, cardio-vascular response: n = 165 participants, and cortisol response: n = 186 participants). Estimates are t-values from linear multiple regressions adjusted for linear effects of age, presence of a psychiatric diagnosis, and cortisol response to intravenous catheter placement. Green asterisks indicate significant results (p < 0.05). b Scatterplots showing associations of n = 186 participants between BMI and stress-induced negative affect after the task (both sexes: b = 1.48, t(182) = 2.00, p = 0.047) and after the following 30-min rest (both sexes: b = 1.18, t(182) = 2.35, p = 0.019) separated for males and females to depict potential sex differences. Associations with BMI were significant in n = 120 females (T8), but not in n = 69 males. While models account for covariates, the data is shown unadjusted in the scatterplots. ∆Cort T6 = Cortisol increase after the end of the task (T6) compared to baseline (T0). Shaded areas depict 95% confidence intervals of the association of unadjusted data. ∆Cort T8 = Cortisol increase after rest (T8) compared to baseline (T0). ∆HR PostStress = Difference in heart rate between task-blocks in the PostStress and PreStress condition, ∆HR Stress = Difference in heart rate between task-block in the PostStress and PreStress condition, ∆Neg T6 = Difference in state negative affect directly after the task (T6) compared to before the task (T3), ∆Pos T6 = Difference in state positive affect directly after the task (T6) compared to before the task (T3). Source data are provided in the Supplementary Data 1.
Fig. 3
Fig. 3. Stress-induced deactivations in the posterior insula and substantia nigra are stronger with increasing BMI.
a Whole-brain regression analyses (n = 190) show associations between body mass index (BMI) and stress-induced (Stress – PreStress) activation changes. Higher BMI is associated with increased (warm colors) stress-induced activation in the superior parietal lobe/precuneus and decreased (cool colors) activation in the substantia nigra and posterior insula. Voxel-threshold for display: p < 0.001, t > 3.13. b Extracted beta estimates (average across the region of interest, ROI) from corresponding ROIs defined in the Shen atlas are negatively associated with BMI. Regression weights and significance values are derived from separate multiple regressions for n = 120 females and n = 70 males (accounting for confounds and data is shown unadjusted for the visualization). Shaded areas show 95% confidence intervals for the associations of unadjusted data. Associations with BMI are only significant in females. BMI = body mass index, L = left, R = right. Source data are provided in the Supplementary Data 1.
Fig. 4
Fig. 4. Block-wise changes in activation across the task are related to body mass index (BMI) in females.
a An elastic net model based on activation changes during the task predicts BMI. Predicted and observed values of BMI in n = 190 participants were significantly correlated across the complete sample (r(188) = 0.33, pperm < 0.001). This association was driven by n = 120 females (r(118) = 0.26, p = 0.005), but was not seen in n = 70 men (r(68) = −0.05, p = 0.66). Prediction models included covariates (age, sex, diagnosis, pre-task cortisol, and log-transformed average framewise displacement), but for visualization, data is unadjusted. b The model based on stress-induced activation trajectories (yellow) predicted BMI beyond a baseline model based on confounding variables. The observed R2 (yellow) from all n = 190 participants is higher than the 95% percentiles (errorbars) of the model with true confounds but permuted features (repeated 10,000 times). In contrast, models based on functional connectivity (FC trajectories), or a combination of FC and activation trajectories did not perform better than the baseline model including confounds (i.e., observed R2 within 95% percentile range indicated by the errorbars). Overlapping bars show the average model performance of the observed model (yellow) or the baseline models with permuted features (violet). Error bars depict 95% percentiles derived from permuting (10,000 resamples) the outcome together with the confounding variables to evaluate the contribution of the activation features beyond the confounds. c Standardized weights from the prediction model including stress-induced changes in activation. Depicted weights were retained in ≥80% of outer cross-validation folds. d Importance of each feature set (i.e., all timepoints of one region) for the prediction of BMI. The ∆R2 reflects how much predictive accuracy is lost when leaving out all timepoints of the feature. e Standardized weights predicting BMI across the complete sample in the model including averaged activations for PreStress, Stress, and PostStress. f Activation changes (and changes in activation and FC combined) only predict BMI in n = 120 females, but not males, beyond a baseline model including confounds when training separate models. Error bars depict 95% percentiles derived from permuting the outcome together with confounds to evaluate the contribution of features beyond confounds. vmPFC = ventromedial prefrontal cortex, Put = Putamen, PCC = posterior cingulate cortex, Hyp = Hypothalamus, HippP = posterior hippocampus, HippM = medial hippocampus, HippA = anterior hippocampus, dACC = dorsal anterior cingulate cortex, Cau = caudate, Amy = amygdala. Source data are provided in the Supplementary Data 1.
Fig. 5
Fig. 5. Peripheral levels of cytokines do not account for associations with predicted body mass index (BMI) based on stress-induced brain response patterns.
a Multiple regression coefficients for the associations between sex, normalized cytokine concentration, and their interaction with participant’s BMI, the BMI predicted by stress-induced brain responses, and the residual BMI in n = 148 independent participants. Only baseline (morning) cortisol concentration was related to the observed as well as the predicted BMI. White asterisks indicate significant predictors. All regressions models include age, psychiatric diagnosis, and medication status as additional covariates. b Scatterplots for the association between baseline cortisol and BMI (observed, predicted, and residual), split by sex in n = 89 females and n = 59 males. Associations were numerically stronger and significant in females (rho(83) = −0.27, p = 0.003), compared with males (rho(53) = −0.15, p = 0.22), but the interaction between sex and cortisol was not significant (t(142) = 0.46, p = 0.64). Correlation values are partial correlations corrected confounds, but data is shown unadjusted in the scatterplots. Shaded areas show 95% confidence intervals of unadjusted associations. hsCRP = high sensitivity CRP, IL-1RA = interleukin 1 receptor antagonist, VEGF-A = vascular endothelial growth factor A, ICAM-1 = intracellular adhesion molecule 1, MCP-1 = chemokine (C-C motif) ligand 2, MIP-1beta = chemokine (C-C motif) ligand 4, MDC = chemokine (C-C motif) ligand 22, TNF-alpha = tumor necrosis factor alpha, IL-16 = interleukin 16, SAA = serum amyloid A, sIL-6R = soluble IL-6 = receptor. Source data are provided in the Supplementary Data 1.

References

    1. McEwen BS. Protection and damage from acute and chronic stress: allostasis and allostatic overload and relevance to the pathophysiology of psychiatric disorders. Ann. N. Y. Acad. Sci. 2004;1032:1–7. - PubMed
    1. Jackson SE, Kirschbaum C, Steptoe A. Hair cortisol and adiposity in a population-based sample of 2,527 men and women aged 54 to 87 years. Obesity. 2017;25:539–544. - PMC - PubMed
    1. Holmes MV, et al. Causal effects of body mass index on cardiometabolic traits and events: a Mendelian randomization analysis. Am. J. Hum. Genet. 2014;94:198–208. - PMC - PubMed
    1. Iliodromiti S, et al. The impact of confounding on the associations of different adiposity measures with the incidence of cardiovascular disease: a cohort study of 296 535 adults of white European descent. Eur. Heart J. 2018;39:1514–1520. - PMC - PubMed
    1. Khan SS, et al. Association of body mass index with lifetime risk of cardiovascular disease and compression of morbidity. JAMA Cardiol. 2018;3:280–287. - PMC - PubMed

Publication types