. 2023 Nov 27;62(48):e202311530.
doi: 10.1002/anie.202311530. Epub 2023 Oct 27.

Expanding the Range of Bioorthogonal Tags for Multiplex Stimulated Raman Scattering Microscopy

Affiliations

Expanding the Range of Bioorthogonal Tags for Multiplex Stimulated Raman Scattering Microscopy

Neville Murphy et al. Angew Chem Int Ed Engl. .

Abstract

Multiplex optical detection in live cells is challenging due to overlapping signals and poor signal-to-noise associated with some chemical reporters. To address this, the application of spectral phasor analysis to stimulated Raman scattering (SRS) microscopy for unmixing three bioorthogonal Raman probes within cells is reported. Triplex detection of a metallacarborane using the B-H stretch at 2480-2650 cm-1 , together with a bis-alkyne and deuterated fatty acid can be achieved within the cell-silent region of the Raman spectrum. When coupled to imaging in the high-wavenumber region of the cellular Raman spectrum, nine discrete regions of interest can be spectrally unmixed from the hyperspectral SRS dataset, demonstrating a new capability in the toolkit of multiplexed Raman imaging of live cells.

Keywords: Bioorthogonal Labeling; Imaging Probes; Raman Microscopy; Spectral Phasor Analysis; Stimulated Raman Scattering.


Conflict of interest statement

The authors declare no conflict of interest.

Figures

Figure 1
Figure 1
Analysis of metallacarboranes using spontaneous Raman scattering. A) Molecular structure of metallacarboranes used in this study. B) Chemical structures of the bis‐alkynes used in this study. C) Raman spectra of ortho‐carborane and the metallacarboranes in solid form. Spectra were acquired using 785 nm excitation with a 20× lens (~20 mW) for 10 s. D) Analysis of the relative Raman scattering of metallacarboranes (B−H, 2480–2630 cm−1) and bis‐alkynes (C≡C, ~2220 cm−1) relative to EdU (5‐ethynyl‐2′‐deoxyuridine, C≡C, 2120 cm−1). Data represent the mean relative intensity vs. EdU (RIE) from 12 replicate spectra with error bars ±S.D. E) Raman shift of the B−B−M bending mode of metallacarboranes.
Figure 2
Figure 2
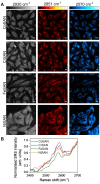
Imaging metallacarboranes in live cells using SRS microscopy. A) HeLa cells were treated with metallacarborane (250 μM, 4 h) before imaging using SRS microscopy at the following frequencies: 2930 cm−1 (CH3, proteins), 2851 cm−1 (CH2, lipids), 2570 cm−1 (B−H) with 2400 cm−1 (off‐resonance) signal subtracted. DMSO control cells: see Figure S3. Scale bars: 10 μm. B) SRS spectra are also presented for single cells across the range 2400–2700 cm−1. Spectra normalised between 0–1.
Figure 3
Figure 3
Cellular segmentation using spectral phasor analysis. HeLa cells were treated with FeSAN (500 μM, 15 min) before SRS images were acquired across the range A) 3050–2800 cm−1 (0.4 nm, 40 images) and B) 2650–2450 cm−1 (0.4 nm, 35 images). The spectral phasor plot has been segmented into the following regions: (A) nucleus, (B) nucleolus, (C) cytoplasm, (D) lipid droplets (LDs), (E) LD periphery, (F) cell boundary and (G) FeSAN. A yellow dashed marker indicates the expanded region showing co‐localization of the (G) FeSAN segment (red) with the (B) nucleolus segment (green). C) Normalised SRS spectra corresponding to the segments (A)–(G). The SRS spectra have been normalised between 0–1.
Figure 4
Figure 4
Multiplex imaging of metallacarboranes using spectral phasor analysis. A) HeLa cells were treated with stearic acid‐d35 5 (200 μM, 8 h) before treatment with CrSAN (250 μM, 4 h) and AM‐ester 3 (100 μM, 30 min). SRS images were then acquired across the range 3050–2800 cm−1 (0.4 nm/~7 cm−1, 40 images), 2650–2450 cm−1 (0.4 nm/~7 cm−1, 35 images) and 2250–2000 cm−1 (0.4 nm/~7 cm−1, 40 images). Spectral phasor analysis was then performed on the combined image stacks. A) The spectral phasor has been segmented into the following areas as indicated by the coloured boxes and corresponding labels: (A) nucleus, (B) nucleolus, (C) cytoplasm, (D) lipid droplets (LDs), (E) LD periphery, (F) cell boundary, (G) CrSAN, (H) stearic acid‐d35 5 and AM‐ester 3, (I) AM‐ester. An average intensity projection is presented. Scale bar: 10 μM. B) Normalised average SRS spectra for the ROIs identified in (A). The spectra were normalised between 0–1. C) Chemical structures of stearic acid‐d35 5 and AM‐ester 3 including the spectral range for their detection.

References

    1. Cutrale F., Trivedi V., Trinh L. A., Chiu C.-L., Choi J. M., Artiga M. S., Fraser S. E., Nat. Methods 2017, 14, 149–152. - PubMed
    1. Wei L., Chen Z., Shi L., Long R., Anzalone A. V., Zhang L., Hu F., Yuste R., Cornish V. W., Min W., Nature 2017, 544, 465. - PMC - PubMed
    1. Tipping W. J., Lee M., Serrels A., Brunton V. G., Hulme A. N., Chem. Soc. Rev. 2016, 45, 2075–2089. - PMC - PubMed
    1. Tsikritsis D., Legge E. J., Belsey N. A., Analyst 2022, 147, 4642–4656. - PubMed
    1. None

Publication types

MeSH terms

LinkOut - more resources