. 2023 Oct 11;24(1):32.
doi: 10.1186/s12860-023-00492-3.

From network analysis to experimental validation: identification of regulators of non-muscle myosin II contractility using the folded-gastrulation signaling pathway

Affiliations

From network analysis to experimental validation: identification of regulators of non-muscle myosin II contractility using the folded-gastrulation signaling pathway

Andy Zhao et al. BMC Mol Cell Biol. .

Abstract

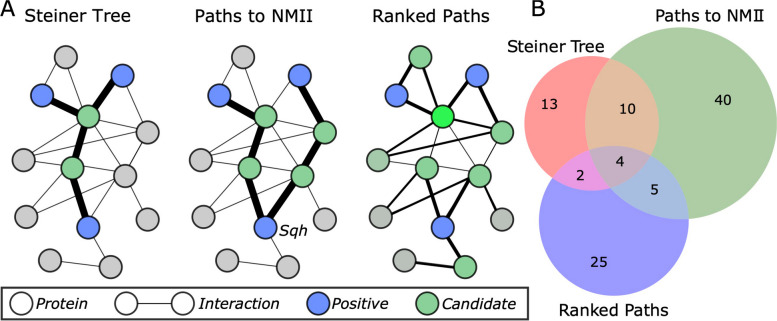
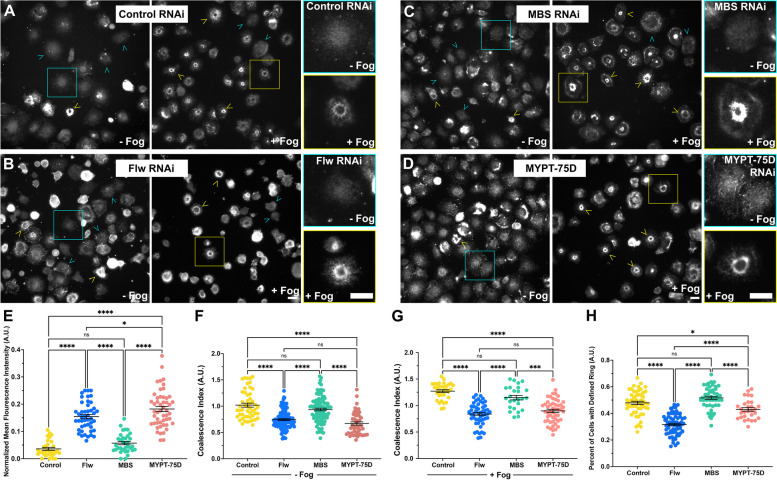
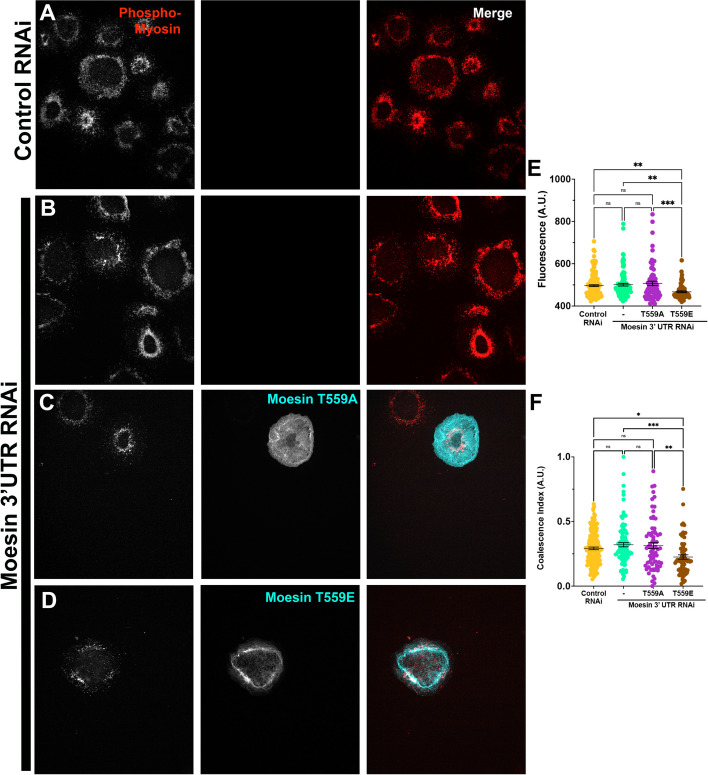
The morphogenetic process of apical constriction, which relies on non-muscle myosin II (NMII) generated constriction of apical domains of epithelial cells, is key to the development of complex cellular patterns. Apical constriction occurs in almost all multicellular organisms, but one of the most well-characterized systems is the Folded-gastrulation (Fog)-induced apical constriction that occurs in Drosophila. The binding of Fog to its cognizant receptors Mist/Smog results in a signaling cascade that leads to the activation of NMII-generated contractility. Despite our knowledge of key molecular players involved in Fog signaling, we sought to explore whether other proteins have an undiscovered role in its regulation. We developed a computational method to predict unidentified candidate NMII regulators using a network of pairwise protein-protein interactions called an interactome. We first constructed a Drosophila interactome of over 500,000 protein-protein interactions from several databases that curate high-throughput experiments. Next, we implemented several graph-based algorithms that predicted 14 proteins potentially involved in Fog signaling. To test these candidates, we used RNAi depletion in combination with a cellular contractility assay in Drosophila S2R + cells, which respond to Fog by contracting in a stereotypical manner. Of the candidates we screened using this assay, two proteins, the serine/threonine phosphatase Flapwing and the putative guanylate kinase CG11811 were demonstrated to inhibit cellular contractility when depleted, suggestive of their roles as novel regulators of the Fog pathway.

Keywords: Apical constriction; Contractility; Drosophila melanogaster; Folded gastrulation; Non-muscle myosin II.


Conflict of interest statement

The authors declare no competing interests.

Figures

Fig. 1
Fig. 1
Graph algorithms used to identify protein candidates. A Algorithms developed to identify candidate proteins from the interactome and the positive proteins. Brighter/lighter green indicates a higher Ranked Paths score. B Venn diagram of protein candidates from each method; see Supplementary Table 1 for candidate list
Fig. 2
Fig. 2
Computationally identified candidates lead to the inhibition of NMII contractility. A-H Phase-contrast images of S2R + cells treated with control (A and B), CG10374 (C and D), Flapwing (E and F), or Oya (G and H) RNAi. Cells were either perfused with control cell media (A, C, E, G) or treated with Fog-conditioned media (B, D, F, H); yellow arrows indicate cells that have contracted following Fog perfusion. The white box in (A) denotes uncontracted cells shown at higher magnification while the yellow box in (B) denotes the contracted cells shown at higher magnification (right). Scale bars 10 µm. I-K Scatter plots quantifying the fraction of contracted cells with and without Fog perfusion following RNAi treatments with CG10274 RNAi (I), Flapwing RNAi (J), and Oya RNAi (K). I There was no statistically significant difference between control and CG10274 RNAi cells with and without Fog treatment, however in there was an inhibition of cellular contractility following RNAi treatment with Flapwing and Oya as compared to control RNAi treated cells (****p-values < 0.0001, Student's T-test, N = 3). (L & M) Results from RT-qPCR indicating the efficacy of RNAi treatments for cells treated with Flapwing RNAi (L) and Oya (M). There was a statistically significant reduction in Flw mRNA as compared to control treatments (****p-value > 0.0001, Student’s t-test, N = 3), similarly, we observed a statistically significant reduction in Oya mRNA following RNAi treatment as compared to controls (** p-value = 0.0024, ****p-value > 0.0001, one-way ANOVA, N = 5)
Fig. 3
Fig. 3
RNAi depletion of Oya disrupts the localization of phosphorylated non-muscle myosin II. A-C Drosophila S2R + cells stained for actin (right panel, cyan in merged image) and phosphomyosin (middle panel, red in merged image) treated with (A) control, (B) Oya, or (C) Sqh RNAi. Yellow arrowheads denote coalesced phosphomyosin contractile network while cyan arrowheads denote a dispersed network. Scale bar is 10 µm. D The quantification of the ratio of the fluorescent intensities of phoshomyosin to actin following RNAi treatments. The mean (± SEM) phosphomyosin:actin ratio in Oya depleted cells (magenta circles) was statistically significantly lower than that of control treated cells (yellow circles) but greater than that of Sqh depleted cells (blue circles) (**** p < 0.0001, one-way ANOVA with Tukey’s post-hoc analysis). (E) Quantification of the coalescence index measuring the degree of phosphomyosin coalescence in cells treated with control (yellow circles), Oya (magenta circles), and Sqh RNAi (blue circles). The mean (± SEM) coalescence in Oya depleted cells is less than control treated cells yet higher than Sqh depleted cells (** p-value = 0.00295, **** p-value < 0.0001, one-way ANOVA with Tukey’s post-hoc analysis N = 3)
Fig. 4
Fig. 4
Depletion of PP1 complex has distinct effects S2R + cellular contractility. A-G Phase-contrast imaging of S2R + cells from the cellular contractility assay (A) in the absence of Fog or (B-G) following the perfusion of Fog. Cells were treated with (A and B) control, (C) MBS, (D) Flw, (E) MYPT-75D RNAi or double-depleted with (F) Flw and MBS, or (G) Flw and MYPT-75D RNAi. The white box in (A) denotes an uncontracted cell shown at higher magnification while the yellow box in (B) denotes a contracted cell shown at higher magnification.Yellow arrowheads indicate contracted cells, cyan arrowheads indicate rounded cells. Scale bars 10 µm. H and I Quantification of the mean (± SEM) fraction of contracted cells and fraction of rounded cells following treatment with control (yellow circles), Flw (blue circles), MBS (green circles), MYPT-75D (peach circles), Flw and MBS (magenta circles), and Flw and MYPT-75D RNAi (purple circles). The fraction of Flw depleted cells was statistically significantly lower than all other conditions, while depletion of MBS was no different than control RNAi treated samples. Depletion of MYPT-75D was also statistically significant from both control RNAi and Flw RNAi treated cells showing an intermediate phenotype. Double depletion of Flw and MBS and Flw and MYPT-75D also showed an intermediate phenotype, being statistically significantly different from control RNAi as well as single RNAi treatments of Flw, MBS, and MYPT-75D (**p-value = 0.0090,***p-value = 0.0004, ****p-value < 0.0001, one-way ANOVA with Kruskal–Wallis test, N = 3). (I) We observed a statistically significant increase in the fraction of rounded cells following Flw RNAi as compared to all other conditions. The fraction of rounded cells following MBS or MYPT-75D depletion was no different than control RNAi treated cells, while double depletion led to an intermediate cell rounding phenotype statistically significantly different from that of Flw, MBS, or MYPT-75D RNAi treated cell, as well as control cells (*p-value = 0.0417, ***p-value = 0.002, ****p-value < 0.0001, one-way ANOVA with Kruskal–Wallis test, N = 3)
Fig. 5
Fig. 5
PP1 complex members have distinct localization patterns. A-C S2R + cells co-expressing TagRFP-tagged (A) Flapwing (left panel, cyan in merge), (B) MBS (left panel, cyan in merge), or (C) MYPT-75D (left panel, cyan in merge) with SQH-EGFP (middle panel, red in merge) imaged by TIRF microscopy. Yellow lines indicate a representative region of interest where line scans were taken and graphically represented in D-F. Scale bar 10 µm. D-F Line scans from cells co-expressing TagRFP-tagged (D) Flw, (E) MBS, and (F) MYPT-75D (all in cyan), with EGFP-Sqh (red). Graphs represent the Normalized Fluorescent Intensity of 7–10 cells per condition
Fig. 6
Fig. 6
Depletion of Flw increases the amount of phosphomyosin in S2R + cells, but leads to a less organized contractile network. A-D) S2R + cells fixed and stained for phosphomyosin in the absence of Fog (left panels), or after the perfusion of Fog (right panels) following treatment with (A) control, (B) Flw, (C) MBS, or MYPT-75D RNAi. Yellow arrowheads denote cells with a coalesced phosphomyosin contractile network in the form of peri-nuclear rings, while cyan arrowheads indicate a more diffuse phosphomyosin network. Yellow boxes denote cells with peri-nuclear rings shown at higher magnification, while cyan boxes denote cells with a diffuse phosphomyosin network shown at higher magnification. Scale bars 10 µm. EH Quantification of the mean (± SEM) (E) Normalized Fluorescence Intensity, (F & G) Coalesce Index, (H) Number of cells with defined rings for cells following treatment with control (yellow circles), Flw (blue circles), MBS (green circles), and MYPT-75D (peach circles). E Depletion of Flw and MYPT-75D led to a statistically significant increase in normalized mean phosphomyosin fluorescence intensity while the depletion of MBS was no different than that of control RNAi treated samples. F The coalescence index indicated that depletion of Flw and MYPT-75D were statistically indistinguishable from one another but were statistically less organized as compared to MBS and control RNAi treated samples. G In comparing the number of defined rings, Flw depletion led to a lower number of cells with rings as compared to all other RNAi conditions. (**p-value = ,***p-value = , ****p-value < 0.0001, one-way ANOVA with Tukey’s post-hoc analysis, N = 3, N = 29–89 image fields)
Fig. 7
Fig. 7
Flw regulates cellular contractility through its interaction with Moesin. A-D Phase-contrast images of S2R + cells following perfusion of Fog and treatment with (A) control, (B) Flw, (C) Moesin, and (D) Flw and Moesin RNAi. Yellow arrowheads denote contracted cells and cyan arrowheads denote rounded cells. Scale bar 10 µm. E and F Quantification of the fraction (± SEM) of (E) Contracted cells and (F) Rounded cells, treated with control (yellow circles), Moesin (mint green circles), Flw (blue circles), and Flw and Moesin (magenta circles) RNAi. E Depletion of Moesin led to a statistically significant increase in the fraction of contracted cells, while double depletion of Moesin and Flw only led to a partial rescue (**p-value = 0.002304,***p-value = 0.000258, ****p-value < 0.0001, one-way ANOVA with Tukey’s post-hoc analysis, N = 3). F Conversely, depletion of Moesin did not affect the fraction rounded cells we observed, while depletion of Flw led to a statistically significant increase. The double depletion of Moesin and Flw failed to rescue this cell-rounding phenotype ( ****p-value < 0.0001, one-way ANOVA with Tukey’s post-hoc analysis, N = 3)
Fig. 8
Fig. 8
Moesin’s phosphorylation state affects cellular contractility. A and B Phase-contrast (left) and fluorescent imaging (right, green in merge) of S2R + cells following Fog perfusion treated with Moesin 3’UTR RNAi and expressing EGFP tagged (A) Moesin T559E or (B) Moesin T559A. Scale bar 10 µm. C and D Quantification of the fraction (± SEM) of (C) Contracted and (D) Rounded cells following RNAi treatment with control (yellow circles) and Moesin 3’UTR (mint green circles) RNAi. We also expressed EGFP-tagged Moesin T559A (plum circles) and Moesin T559E (brown circles) following Moesin 3’UTR RNAi. C The hypercontractile phenotype following Moesin 3’UTR RNAi could not be rescued by the expression of EGFP-Moesin T559A, while expression of EGFP-Moesin T559E led to a statistically significant decrease in the number of contracted cells (***p-value = 0.000174, ****p-value < 0.0001, one-way ANOVA with Tukey’s post-hoc analysis, N = 3). D Conversely, the number of rounded cells following rescue with EGFP-Moesin T559A was no different than Moesin 3’UTR RNAi alone, but expression EGFP-Moesin T559E led to a significant increase in the number of rounded cells (*p-value = 0.0254,****p-value < 0.0001, one-way ANOVA with Tukey’s post-hoc analysis, N = 3)
Fig. 9
Fig. 9
Moesin’s phosphorylation state feeds back to the phosphorylation state of NMII’s regulatory light chain. A-D TIRF images S2R + treated with (A) control RNAi or (B-D) Moesin 3’UTR RNAi and cells fixed and stained for phosphomyosin (left panel, red in merge). C and D Cells were also expressing EGFP-tagged (C) Moesin T559A (middle panel, cyan in merge) or (D) Moesin T559E (middle panel cyan in merge). Scale bar 10 µm. E and F Quantification of the mean (± SEM) (C) Fluorescence and (D) Coalescence Index of cells following RNAi treatment with control (yellow circles) and Moesin 3’UTR (mint green circles) RNAi. We also expressed EGFP-tagged Moesin T559A (plum circles) and Moesin T559E (brown circles) following Moesin 3’UTR RNAi. E Expression of Moesin T559E following Moesin 3’UTR RNAi led to a statistically significant decrease in the amount of phosphorylated NMII regulatory light chain (**p-value = 0.004123,***p-value = 0.00057, one-way ANOVA with Tukey’s post-hoc analysis, N = 3). Similarly, expression of Moesin T559E following Moesin 3’UTR RNAi led to a decrease in Coalescence (*p-value = 0.0149, **p-value = 0.00495,***p-value = 0.00566, one-way ANOVA with Tukey’s post-hoc analysis, N = 3)

References

    1. Vijayraghavan DS, Davidson LA. Mechanics of neurulation: From classical to current perspectives on the physical mechanics that shape, fold, and form the neural tube. Birth Defects Res. 2017;109:153–168. - PMC - PubMed
    1. Rothstein M, Bhattacharya D, Simoes-Costa M. The molecular basis of neural crest axial identity. Dev Biol. 2018;444:S170–S180. - PMC - PubMed
    1. Sweeton D, Parks S, Costa M, Wieschaus E. Gastrulation in Drosophila: the formation of the ventral furrow and posterior midgut invaginations. Development. 1991;112:775–789. - PubMed
    1. Solnica-Krezel L. Conserved Patterns of Cell Movements during Vertebrate Gastrulation. Curr Biol. 2005;15:R213–R228. - PubMed
    1. Martin AC, Goldstein B. Apical constriction: themes and variations on a cellular mechanism driving morphogenesis. Development. 2014;141:1987–1998. - PMC - PubMed

LinkOut - more resources