. 2023 Sep 16:31:100727.
doi: 10.1016/j.omto.2023.100727. eCollection 2023 Dec 19.

Allogeneic tumor cell-derived extracellular vesicles stimulate CD8 T cell response in colorectal cancer

Affiliations

Allogeneic tumor cell-derived extracellular vesicles stimulate CD8 T cell response in colorectal cancer

Travis J Gates et al. Mol Ther Oncolytics. .

Abstract

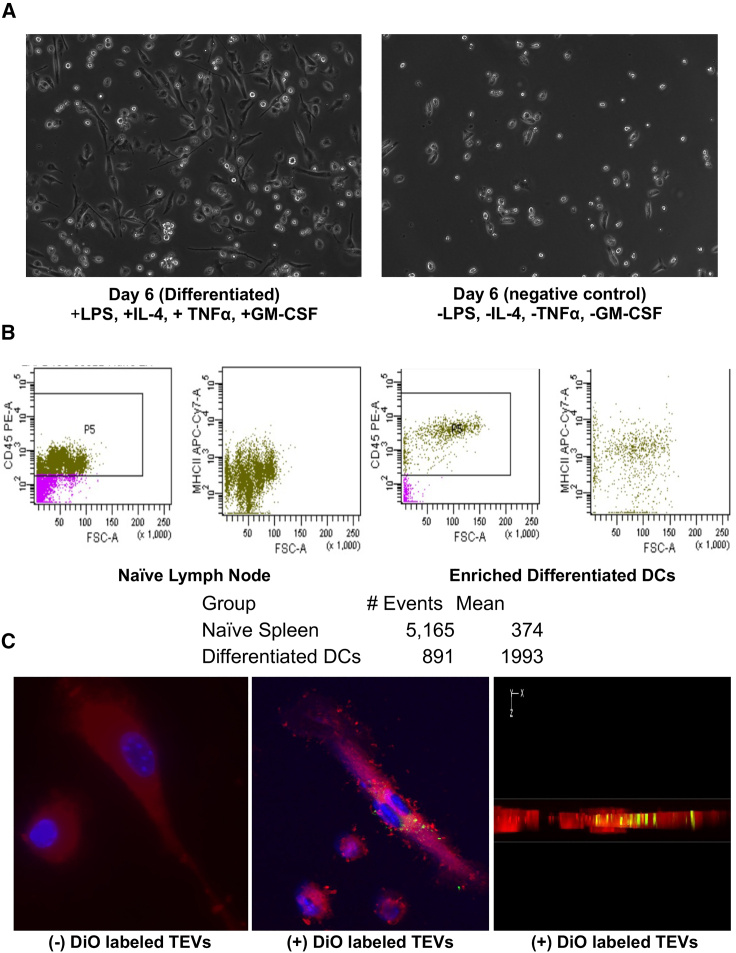
Most colorectal cancer (CRC) patients present with a microsatellite-stable phenotype, rendering them resistant to immune checkpoint inhibitors (ICIs). Among the contributors to ICI resistance, tumor-derived extracellular vesicles (TEVs) have emerged as critical players. Previously we demonstrated that autologous transfer of TEVs without miR-424 can induce tumor antigen-specific immune responses in CRC models. Therefore, we postulated that allogeneic TEVs, modified to lack miR-424 and derived from an MC38 cells, could induce CD8+ T cell responses while restraining CT26 cell-based tumor. Here, we show that prophylactic administration of MC38 TEVs, without miR-424, showed a significant augmentation in CD8+ T-cells within CT26 tumors. This allogenic TEV effect was evident in CT26 tumors but not B16-F10 melanoma. Furthermore, we demonstrated the capacity of dendritic cells (DCs) to internalize TEVs, a possible mechanism to elicit immune response. Our investigation of autologously administered DCs, which had been exposed to modified TEVs, underscores their potential to dampen tumor growth while elevating CD8+ T cell levels vis-a-vis MC38 wild-type TEVs exposed to DCs. Notably, the modified TEVs were well tolerated and did not increase peripheral blood cytokine levels. Our findings underscore the potential of modified allogeneic TEVs without immune-suppressive factors to elicit robust T cell responses and limit tumor growth.

Keywords: T cells; allogeneic; colorectal cancer; dendritic cells; immune checkpoint inhibitors; tumor extracellular vesicles.


Conflict of interest statement

The authors declare no competing interests.

Figures

None
Graphical abstract
Figure 1
Figure 1
TEV isolation and characterization (A) Western blot data showing the expression of EV markers, including ALIX (∼100 kDa) and CD81 (∼25 kDa), alongside negative controls β-tubulin (∼60 kDa) and β-actin (∼40 kDa), for MC38 WT, MC38-miR-control, and MC38-424i TEVs. (B) Nanotracker analysis showcasing size distribution profiles of TEVs derived from MC38-424i (yellow), MC38-miR-control (red), and MC38-WT (black) TEVs. (C) Transmission electron microscopy images presenting the morphological characteristics of MC38-WT, MC38-miR-control, and MC38-424i TEVs.
Figure 2
Figure 2
Treatment with allogeneic MC38 TEVs on CT26 tumor slows tumor progression (A) Schematic representation illustrating the administration of TEVs, tumor inoculation, and images capturing tumor progression within distinct groups (saline n = 8; MC38-WT TEV n = 7; MC38-miR-control TEV n = 7; MC38-424i TEV n = 9). (B) Flow cytometry validation confirming the depletion of α-CD4 and α-CD8 T cells, accompanied by tumor images post TEV inoculation in BALB/c mice bearing CT26 tumors. (C) Comparison of endpoint tumor volumes among different groups (saline, MC38-WT TEV, MC38-miR-control TEV, MC38-424i TEV, MC38-424i TEV + α-CD4, MC38-424i TEV + α-CD8, respectively). ∗∗∗p < 0.005; error bars ± SEM.
Figure 3
Figure 3
Treatment with allogeneic MC38 TEVs modulates T cell infiltrates (A) Immunofluorescence depicting CD8+ T cell distribution (red) and DAPI nuclear staining (blue) within CT26 tumors, comparing saline-treated (red) and MC38-424i TEV-treated (blue) groups. ∗p < 0.05; error bars ± SEM. (B) Peripheral blood cytokine levels from mice treated with saline or MC38-424i TEV. (C) Quantification of cytokine levels in peripheral blood, contrasting saline-treated (red) and MC38-424i TEV-treated (blue) groups. Error bars ± SEM.
Figure 4
Figure 4
Treatment with MC38 TEVs on B16 melanoma tumors (A) Schematic representation of the administration of MC38 TEVs in C57BL/6J mice bearing B16-F10 tumors. (B) Comparison of tumor volumes between the saline-treated group (black) and the MC38-424i TEV-treated group (gray). ns, p > 0.05; error bars ± SEM. (C) Immunofluorescence visualization of CD8+ T cells (red) and DAPI nuclear staining (blue) within B16-F10 tumors, comparing the saline-treated group (black) and the MC38-424i TEV-treated group (orange). ns, p > 0.05; error bars ± SEM.
Figure 5
Figure 5
Dendritic cell isolation and TEV capture in vitro (A) Comparison of DC morphology on day 6 with (left) and without (right) differentiation induced by Il-4, TNF-α, GM-CSF, and LPS. (B) Mean fluorescence intensity of MHC class II-APC-Cy7 in naive splenocytes and day 6 in vitro differentiated DCs. (C) Fluorescence microscopy images demonstrating the uptake of TEVs (red) by DCs, with and without labeling of TEVs using DiO (green). Nuclei stained with DAPI are shown in blue. A cross-sectional view (X-Z plane) of z stack images containing DiO-labeled TEVs is also presented.
Figure 6
Figure 6
Autologous transfer of DCs exposed to TEVs slows tumor growth (A) Illustration depicting the process of DC isolation, TEV pulsing, and autologous transfer of DCs to BALB/c animals before tumor challenge with CT26 colon cancer cells. (B) Images showing the tumor status at the experimental endpoint for the MC38-424i, MC38 WT, MC38-miR-control, No TEV, and saline groups (n = 5/group). (C) Graph depicting the tumor volumes at the experimental endpoint for the MC38-424i, MC38-WT, MC38-miR-control, no TEV, and saline groups (n = 5/group). ∗p < 0.05; ns, p > 0.05; error bars ± SEM. (D) Immunofluorescence images and quantification of CD8+ T cells (red) and DAPI-stained nuclei (blue) in CT26 tumors among the saline, MC38-WT, and MC38-424i TEV treatment groups. ∗p < 0.05; ns, p > 0.05; error bars ± SEM.

Update of

References

    1. Siegel R.L., Miller K.D., Wagle N.S., Jemal A. Cancer statistics, 2023. CA. Cancer J. Clin. 2023;73:17–48. doi: 10.3322/caac.21763. - DOI - PubMed
    1. Larkin J., Chiarion-Sileni V., Gonzalez R., Grob J.J., Rutkowski P., Lao C.D., Cowey C.L., Schadendorf D., Wagstaff J., Dummer R., et al. Five-Year Survival with Combined Nivolumab and Ipilimumab in Advanced Melanoma. N. Engl. J. Med. 2019;381:1535–1546. doi: 10.1056/NEJMoa1910836. - DOI - PubMed
    1. Motzer R.J., Escudier B., McDermott D.F., George S., Hammers H.J., Srinivas S., Tykodi S.S., Sosman J.A., Procopio G., Plimack E.R., et al. Nivolumab versus Everolimus in Advanced Renal-Cell Carcinoma. N. Engl. J. Med. 2015;373:1803–1813. doi: 10.1056/NEJMoa1510665. - DOI - PMC - PubMed
    1. Hellmann M.D., Paz-Ares L., Bernabe Caro R., Zurawski B., Kim S.W., Carcereny Costa E., Park K., Alexandru A., Lupinacci L., de la Mora Jimenez E., et al. Nivolumab plus Ipilimumab in Advanced Non–Small-Cell Lung Cancer. N. Engl. J. Med. 2019;381:2020–2031. doi: 10.1056/NEJMoa1910231. - DOI - PubMed
    1. Le D.T., Uram J.N., Wang H., Bartlett B.R., Kemberling H., Eyring A.D., Skora A.D., Luber B.S., Azad N.S., Laheru D., et al. PD-1 Blockade in Tumors with Mismatch-Repair Deficiency. N. Engl. J. Med. 2015;372:2509–2520. doi: 10.1056/NEJMoa1500596. - DOI - PMC - PubMed