. 2023 Sep 16;26(10):107949.
doi: 10.1016/j.isci.2023.107949. eCollection 2023 Oct 20.

CD38 regulates ovarian function and fecundity via NAD+ metabolism

Affiliations

CD38 regulates ovarian function and fecundity via NAD+ metabolism

Rosalba Perrone et al. iScience. .

Abstract

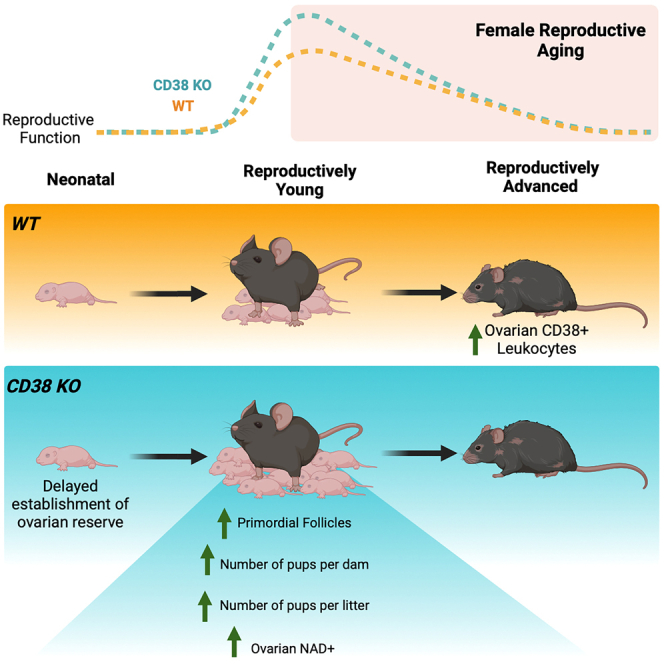
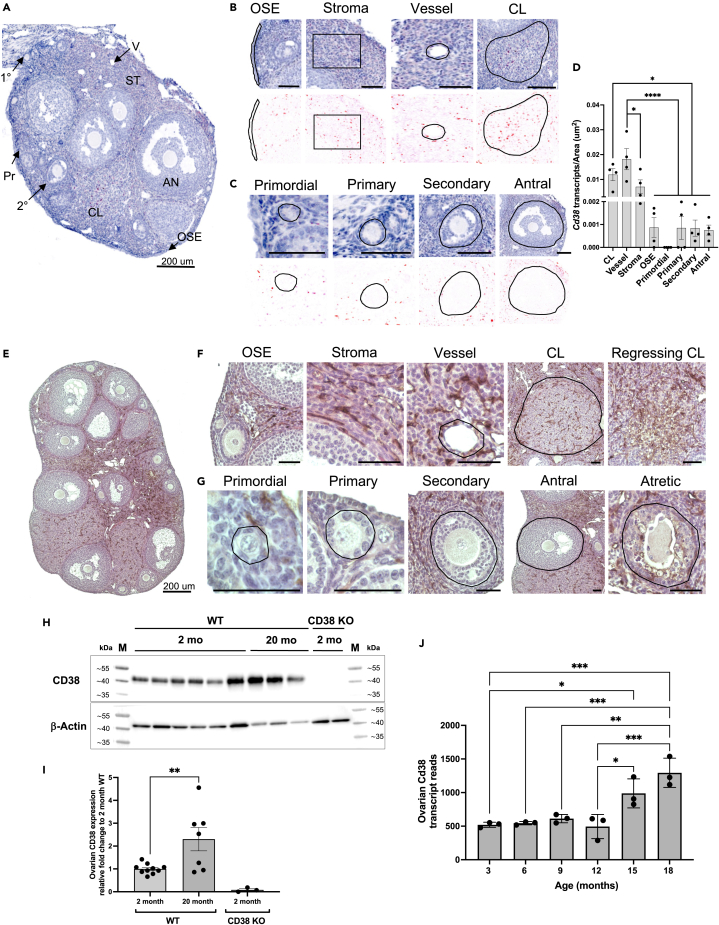
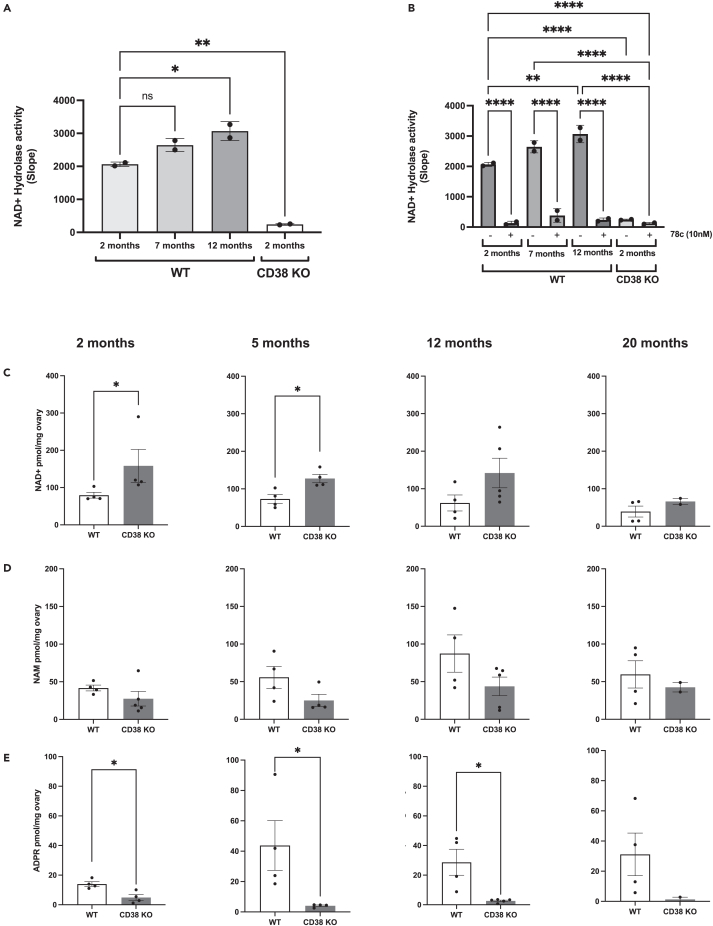
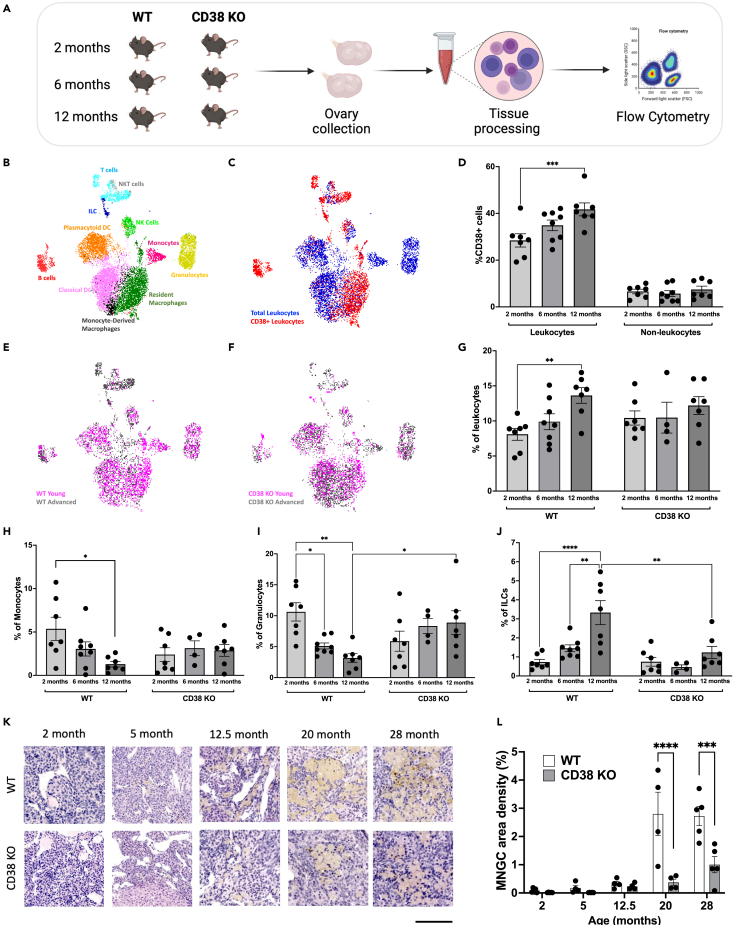
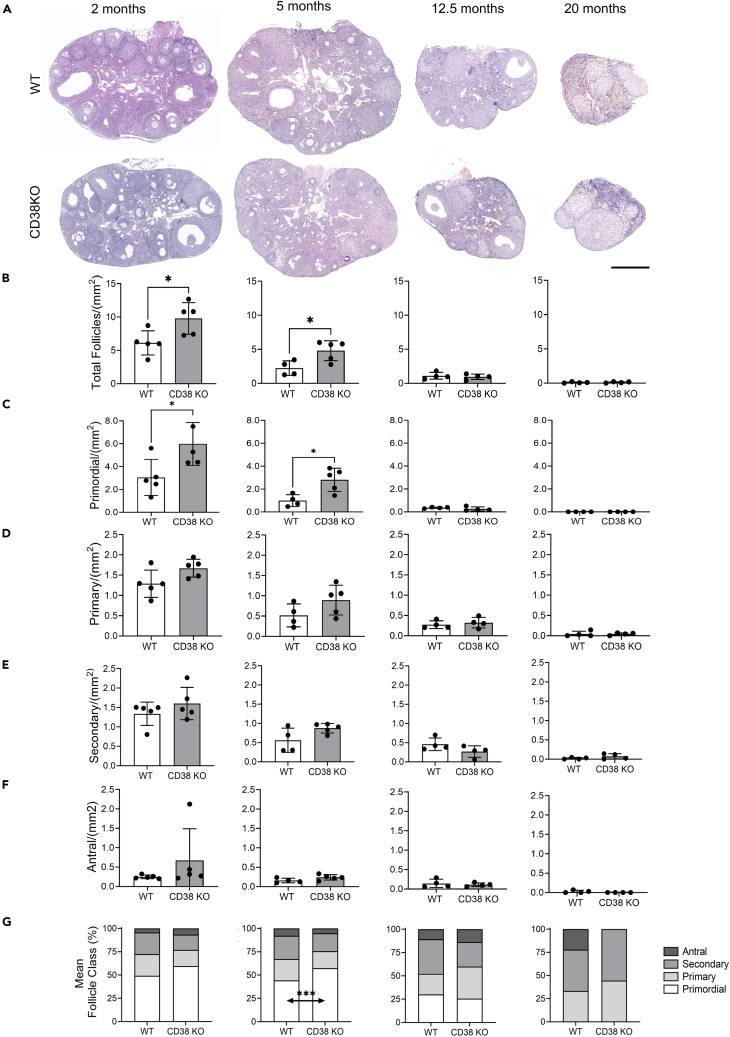
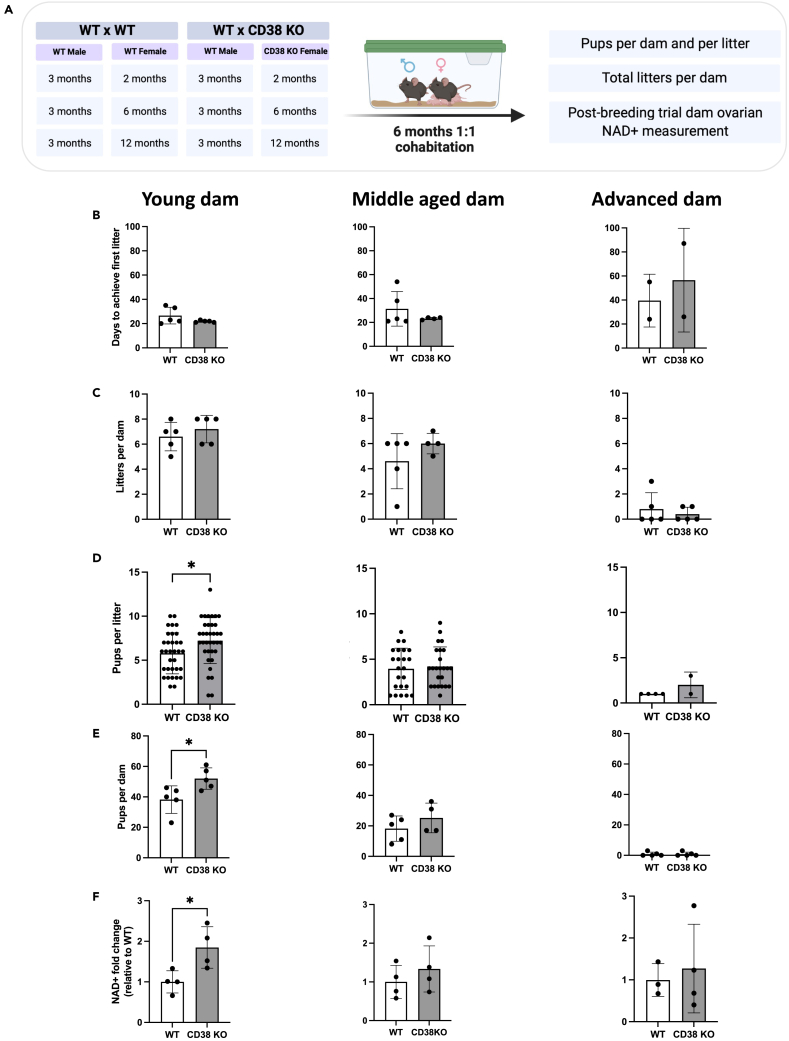
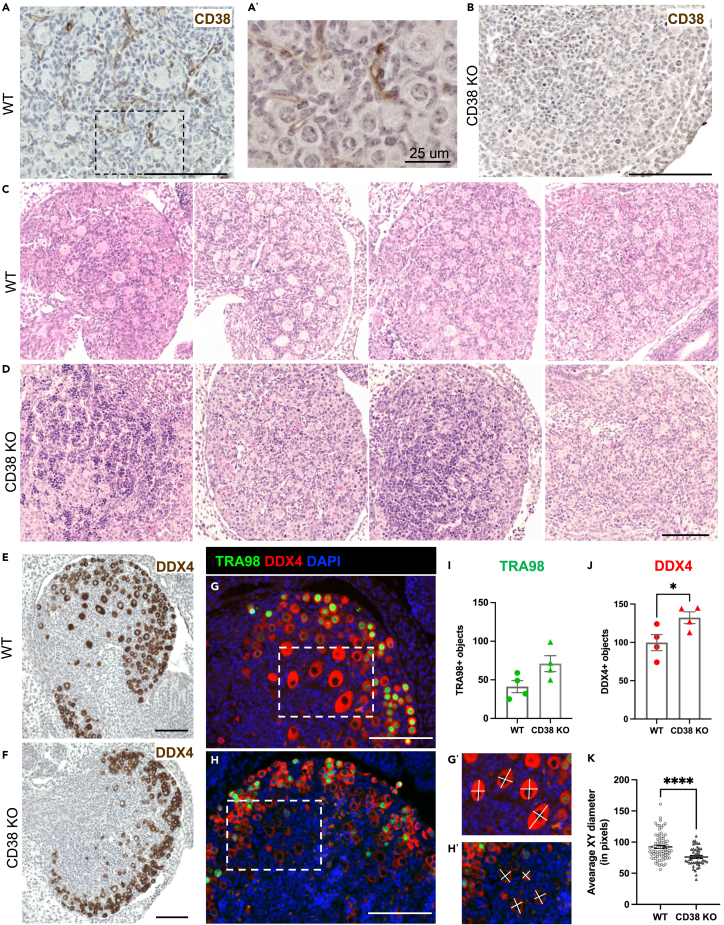
Mammalian female reproductive lifespan is typically significantly shorter than life expectancy and is associated with a decrease in ovarian NAD+ levels. However, the mechanisms underlying this loss of ovarian NAD+ are unclear. Here, we show that CD38, an NAD+ consuming enzyme, is expressed in the ovarian extrafollicular space, primarily in immune cells, and its levels increase with reproductive age. Reproductively young mice lacking CD38 exhibit larger primordial follicle pools, elevated ovarian NAD+ levels, and increased fecundity relative to wild type controls. This larger ovarian reserve results from a prolonged window of follicle formation during early development. However, the beneficial effect of CD38 loss on reproductive function is not maintained at advanced age. Our results demonstrate a novel role of CD38 in regulating ovarian NAD+ metabolism and establishing the ovarian reserve, a critical process that dictates a female's reproductive lifespan.

Keywords: Biochemistry; Biological sciences; Physiology.


Conflict of interest statement

E.V. is a scientific co-founder, shareholder and advisors of Napa Therapeutics, Ltd. E.V., R.P. and P.V.A.K. receive research support from Napa Therapeutics, Ltd.

Figures

None
Graphical abstract
Figure 1
Figure 1
CD38 is expressed in the extrafollicular regions of the mouse ovary and it increases with age (A) Localization of CD38 mRNA by in situ hybridization (RNAscope) in 2-month-old ovarian section from WT mouse, 200 μm scale. (B) Representative higher magnification images from (A) showing CD38 mRNA localization by RNA Scope in OSE, stroma, vessel and CL. 50 μm scale unless otherwise indicated. (C) Representative higher magnification images from (A) showing CD38 mRNA localization by RNA Scope in ovarian follicles at different developmental stages. 50 μm scale unless otherwise indicated. (D) Quantification of CD38 mRNA localization by RNA Scope in ovarian structures and regions (n = 4). (One-Way ANOVA statistical analysis, ∗ = p < 0.05, ∗∗∗∗ = p < 0.00005). Data are represented as mean ± SEM. (E) Representative image showing localization of CD38 protein by immunohistochemistry (IHC) in 2-month-old ovarian section from WT mouse, 200 μm scale. (F) Representative higher magnification images showing CD38 protein localization in OSE, stroma, vessel, CL and regressing CL by immunohistochemistry (IHC) in 2-month-old ovarian section from WT mouse, 50 μm scale unless otherwise indicated. (G) Representative higher magnification images of CD38 protein localization by IHC in ovarian follicles at different developmental stages, 50 μm scale unless otherwise indicated. (H and I) (H) Representative western blot of CD38 expression in whole ovarian tissue lysate from 2 months (n = 6) and 20 months (n = 3) old WT mice. Whole ovarian tissue lysate from 2 months old CD38 KO animals (n = 2) was used as control. β-actin was used as housekeeping loading control. M corresponds to the prestained protein ladder used as kDa size standards (I) Bar chart from 3 independent western Blot experiments showing CD38 expression in whole ovarian tissue lysate from 2 months to 20 months old WT mice. Whole ovarian tissue lysate from 2 months old CD38 KO animals was used as control. β-actin was used as housekeeping loading control. (Unpaired T Test statistical analysis, ∗∗ = p < 0.005). Data are represented as mean ± SEM. (J) Cd38 transcript reads in 3, 6, 9, 12, 15, and 18 month old mouse ovaries (n = 3). (One-Way ANOVA statistical analysis, ∗ = p < 0.05, ∗∗ = p < 0.005, ∗∗∗ = p < 0.0005). Data are represented as mean ± SD. See also Figure S1. (OSE, ovarian surface epithelium; CL, corpus luteum).
Figure 2
Figure 2
CD38 regulates ovarian NAD+ metabolism (A) Quantification of ovarian NAD+ hydrolase activity from whole ovarian lysates of 2, 7, and 12 month old WT and 2 month old CD38 KO mice (n = 2/group, two ovaries per n; One-Way ANOVA statistical analysis, ∗ = p < 0.05, ∗∗ = p < 0.005). Data are represented as mean ± SD. (B) Quantification of ovarian NAD+ hydrolase activity and suppression with the CD38 inhibitor 78c from 2, 7, and 12 month old WT and 2 month old CD38 KO mice (n = 2/group, two ovaries per n; One-Way ANOVA statistical analysis, ∗∗ = p < 0.005 ∗∗∗ = p < 0.0005, ∗∗∗∗ = p < 0.00005). Data are represented as mean ± SD. (C–E) LCMS quantification of (C) NAD+, (D) NAM, and (E) ADPR levels in whole ovary extracts of 2, 6, 12, and 20 months old WT and CD38 KO mice (n = 2–5 per group, Mann-Whitney t-test, ∗ = p < 0.05). Data are represented as mean ± SEM.
Figure 3
Figure 3
CD38 expressing ovarian immune cells increase with age and CD38 KO animals are partially protected from age-associated ovarian immune changes (A) Schematic of flow cytometry-based ovarian immunophenotypic analysis of 2, 6, and 12 month old females. (B) UMAP plot featuring the different immune cell subclusters belonging to the murine ovarian immune landscape (C) UMAP plot featuring CD38 expressing immune cells within the WT ovarian immune landscape (D) Percentage of CD38 positive (CD38+) cells within the ovarian WT leukocytes (CD45+) and non-leukocytes (CD45) population throughout reproductive aging (n = 7–8 per group, mean ± SEM, two-way ANOVA statistical analysis ∗∗∗ = p < 0.0005). (E and F) UMAP plot featuring immune cells distribution within the young and old (E) WT and (F) CD38 KO ovarian immune landscape. (G–J) Percentage of total (G) leukocytes (CD45+), (H) Monocytes (CD11b+, F4/80-, Ly6C+, Ly6G-), (I) Granulocytes (CD11b+, F4/80-, Ly6C+, Ly6G+) and (J) ILCs (CD3, CD19, CD138-, NK1.1-, CD11b-, CD127+) throughout murine reproductive aging in WT and CD38 KO ovaries (n = 4–8 per group, mean ± SEM, two-way ANOVA statistical analysis ∗ = p < 0.05, ∗∗ = p < 0.005, ∗∗∗∗ = p < 0.00005). (K) Representative images of H&E stained ovarian sections from 2, 5, 12.5, 20, and 28 month old WT and CD38 KO mice visualized by bright-field microscopy, 100 μm scale. (L) Quantification of MNGCs density in ovarian sections from 2, 5, 12.5, 20, and 28 month old WT and CD38 KO females (n = 4–5 per group, mean ± SEM, two-way ANOVA statistical analysis ∗∗∗ = p = 0.0002, ∗∗∗∗ = p < 0.0001). All data are represented as mean ± SEM. See also Figure S2.
Figure 4
Figure 4
Reproductively young CD38 KO female mice have a larger ovarian reserve compared to age-matched WT (A) Representative images of H&E stained ovarian sections from 2, 5, 12.5, and 20 months old WT and CD38 KO mice visualized by bright-field microscopy, 500 μm scale. (B) Total follicle quantification in ovaries from 2, 5, 12.5, and 20 months old WT and CD38 KO mice (n = 4–5 per group). (C–F) (C) Primordial, (D) primary, (E) secondary, (F) antral follicles quantification in ovaries from 2, 5, 12.5, and 20 months old WT and CD38 KO mice (n = 4–5 per group) (Paired t-test statistical analysis ∗p < 0.05). All data are represented as mean ± SEM. (G) Follicle classes detected as a percentage of the total ovarian follicle pool in ovaries from 2, 5, 12.5, and 20 months old WT and CD38 KO mice. (two-way ANOVA statistical analysis ∗∗∗p < 0.0005).
Figure 5
Figure 5
Reproductively young CD38 KO female mice generate more pups and have higher ovarian NAD+ levels compared to age-matched WT (A) Breeding schematic of 6-month breeding trial crossing 2 (young), 6 (middle-aged), 12 months (advanced) old WT and CD38 KO females with 3 months old WT males. (B and C) (B) Number of days to generate their first litter and (C) total number of litters for each dam in the 3 different female age groups (young, middle-aged, and advanced) throughout the 6-month breeding trial. (D and E) (D) Total number of pups per litter and (E) total numbers of pups per dam generated by the 3 different female age groups (young, middle-aged, and advanced) throughout the 6-month breeding trial. (Unpaired t-test statistical analysis ∗p < 0.05). (F) NAD+ levels of ovarian tissues collected from each female dam that survived the end of 6-month breeding trial (n = 3–4 per group, Mann Whitney test statistical analysis ∗ = p < 0.05). All data are represented as mean ± SD. See also Figure S3.
Figure 6
Figure 6
Neonatal ovaries from CD38 KO mice have delayed establishment of the ovarian follicular reserve (A) Representative immunohistochemistry image of postnatal day 2 mouse ovaries from WT animal stained with CD38 antibody, 100 μm scale. (A′) Higher magnification image of 5A, 25 μm scale. (B) Representative immunohistochemistry image of postnatal day 2 mouse ovaries from CD38 KO animal stained with CD38 antibody as a control, 100 μm scale. (C and D) Representative images of H&E stained ovarian sections from postnatal day 2 (C) WT (n = 4) and (D) CD38 KO (n = 4) mice visualized by bright-field microscopy, 100 μm scale. (E and F) Representative immunohistochemistry images of postnatal day 2 mouse ovaries from (E) WT and (F) CD38 KO animals stained with the germ cell marker DDX4 antibody, 100 μm scale. (G and H) Representative immunofluorescent images of postnatal day 2 mouse ovaries stained with TRA98 (green) and DDX4 (red) antibodies to label germ cells in (G) WT and (H) CD38 KO, 100 μm scale. Dashed rectangles in G and H show the borders of zoom in (G′) and (H′), respectively. (I) Quantification of TRA98 positive germ cells in WT and CD38 KO postnatal day 2 ovaries (n = 4 for each genotype) (Unpaired t-test statistical analysis p = 0.0614). (J) Quantification of DDX4 positive germ cells in WT and CD38 KO postnatal day 2 ovaries (n = 4 for each genotype) (Unpaired t-test statistical analysis ∗ = p < 0.05). The white lines in (G') and (H') show examples of measurements for calculating the average XY diameter of DDX4+ germ cells. (K) Average XY diameter of DDX4+ germ cells in the medullary region of WT and CD38 KO postnatal day 2 ovaries (n = 64 and n = 41) DDX4+ cells analyzed from total of four WT and CD38 KO ovary sections, respectively (Unpaired t-test statistical analysis ∗∗∗∗p < 0.0001). All data are represented as mean ± SEM.

References

    1. Hall J.E. Endocrinology of the Menopause. Endocrinol Metab. Clin. N. Am. 2015;44:485–496. - PMC - PubMed
    1. Torre S.D., Benedusi V., Fontana R., Maggi A. Energy metabolism and fertility—a balance preserved for female health. Nat. Rev. Endocrinol. 2013;10:13–23. - PubMed
    1. Katsyuba E., Romani M., Hofer D., Auwerx J. NAD+ homeostasis in health and disease. Nat. Metab. 2020;2:9–31. - PubMed
    1. Wang Y., Yang Q., Wang H., Zhu J., Cong L., Li H., Sun Y. NAD+ deficiency and mitochondrial dysfunction in granulosa cells of women with polycystic ovary syndrome. Biol. Reprod. 2021;105:371–380. - PubMed
    1. Sirotkin A.V. The Role and Application of Sirtuins and mTOR Signaling in the Control of Ovarian Functions. Cells. 2016;5 doi: 10.3390/cells5040042. - DOI - PMC - PubMed