. 2023 Aug 17;4(5):258-274.
doi: 10.1002/pei3.10116. eCollection 2023 Oct.

Non-invasive assessment of cultivar and sex of Cannabis sativa L. by means of hyperspectral measurement

Affiliations

Non-invasive assessment of cultivar and sex of Cannabis sativa L. by means of hyperspectral measurement

Andrea Matros et al. Plant Environ Interact. .

Abstract

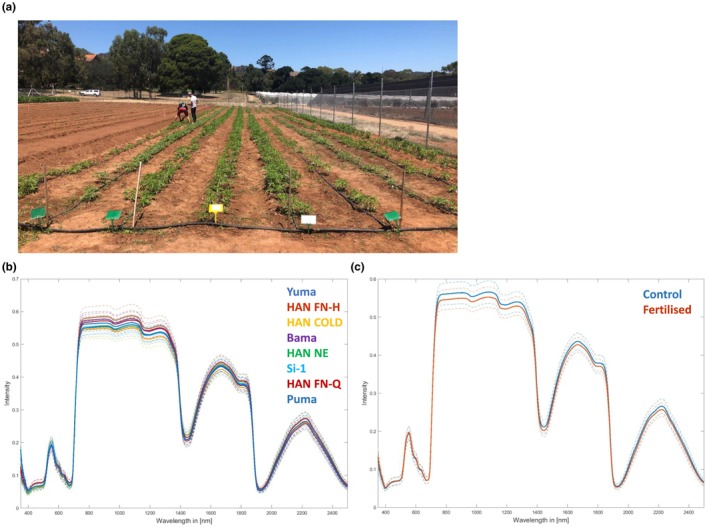
Cannabis sativa L. is a versatile crop attracting increasing attention for food, fiber, and medical uses. As a dioecious species, males and females are visually indistinguishable during early growth. For seed or cannabinoid production, a higher number of female plants is economically advantageous. Currently, sex determination is labor-intensive and costly. Instead, we used rapid and non-destructive hyperspectral measurement, an emerging means of assessing plant physiological status, to reliably differentiate males and females. One industrial hemp (low tetrahydrocannabinol [THC]) cultivar was pre-grown in trays before transfer to the field in control soil. Reflectance spectra were acquired from leaves during flowering and machine learning algorithms applied allowed sex classification, which was best using a radial basis function (RBF) network. Eight industrial hemp (low THC) cultivars were field grown on fertilized and control soil. Reflectance spectra were acquired from leaves at early development when the plants of all cultivars had developed between four and six leaf pairs and in three cases only flower buds were visible (start of flowering). Machine learning algorithms were applied, allowing sex classification, differentiation of cultivars and fertilizer regime, again with best results for RBF networks. Differentiating nutrient status and varietal identity is feasible with high prediction accuracy. Sex classification was error-free at flowering but less accurate (between 60% and 87%) when using spectra from leaves at early growth stages. This was influenced by both cultivar and soil conditions, reflecting developmental differences between cultivars related to nutritional status. Hyperspectral measurement combined with machine learning algorithms is valuable for non-invasive assessment of C. sativa cultivar and sex. This approach can potentially improve regulatory security and productivity of cannabis farming.

Keywords: cannabis; cultivar; industrial hemp; machine learning; prediction; sex; spectral measurement.


Conflict of interest statement

The authors have no conflicts of interest to declare. All co‐authors have seen and agree with the contents of the manuscript.

Figures

FIGURE 1
FIGURE 1
Flowchart of the mathematical modeling process. The acquired hyperspectral signatures are used as input data into the mathematical model. Corresponding reference data are used as output data. According to the three tasks described above, there are three sets of labels used here forming three separate models. Following the structure of the label information, the implemented mathematical model is an 8‐class classifier for task (a) and a binary classifier for task (b) and (c), respectively. Following the general approach of machine learning, the discrepancy (calculated via a standard mathematical error function) between actual and desired output of the model (prediction value) is being minimized during the modeling process. The lower path of the workflow (blue arrows) is not required in productive operation once the mathematical model is sufficiently trained and subsequently used to process all incoming hyperspectral signatures of new (untested) plants based on the learned relationship between input and output data. These yields downstream applications in the field and greenhouse (green arrows).
FIGURE 2
FIGURE 2
Hyperspectral measurement of flowering dioecious Cannabis sativa L. plants from cultivar Ferimon 12. (a) A female (left) and a male (right) plant of the cultivar Ferimon 12 at the time point of measurement (17/02/2020, 4 weeks after sowing and 1 week after planting into the field). (b) The actual measurement of a leaf with the field portable full range spectroradiometer. To avoid environmental illuminations, a leaf clip was combined with the plant probe. (c) The mean reflectance spectra acquired for the cultivar Ferimon 12 from three leaves per plant from five male and five female plants, resulting in 15 spectra each. Dotted lines indicate the variance range.
FIGURE 3
FIGURE 3
Hyperspectral measurements of dioecious Cannabis sativa L. plants before flowering. (a) The field setting at the measurement day (17/02/2020). C. sativa L. cultivars from left to right are Yuma, HAN FN‐H, HAN COLD, Bama, HAN NE, Si‐1, HAN FN‐Q, and Puma. Spectra were acquired from three leaves per plant from 15 plants per cultivar from two soil conditions (fertilized and control), resulting in 90 spectra per cultivar and 720 spectra in total. (b) The mean reflectance spectra of the eight different cultivars across both soil conditions, and (c) the mean reflectance spectra of the two soil conditions across all cultivars. Dotted lines indicate the variance range.
FIGURE 4
FIGURE 4
Images of all dioecious Cannabis sativa L. cultivars evaluated at the measurement day (17/02/2020). (a) Yuma, (b) HAN FN‐H, (c) HAN COLD, (d) Bama, (e) HAN NE, (f) Si‐1, (g) HAN FN‐Q, and (h) Puma.
FIGURE 5
FIGURE 5
Early prediction of sex of dioecious Cannabis sativa L. plants. (a) A photographic image of a female (left) and a male (right) plant of the cultivar HAN FN‐H at the time point of sex annotation (05/03/2020, 9 weeks after sowing into the field). (b) The mean accuracies for the prediction of sex from reflectance spectra measured from leaves before flowering (17/02/2020). Compared are the mean classification rates by individual measurement and by entire plant for three datasets: (1) containing all spectra acquired from each cultivar (fertilized and control conditions, 15 plants each with three leaves per plant measured; 90 spectra per cultivar in total), (2) containing all spectra acquired from each cultivar grown on control conditions (15 plants each with three leaves per plant measured; 45 spectra per cultivar in total), and (3) containing all spectra acquired from each cultivar grown on fertilized conditions (15 plants each with three leaves per plant measured; 45 spectra per cultivar in total). Significant improvement of classification rates for plants grown under fertilized conditions is indicated by *; paired t‐test, p = .0015 (individual spectra) and p = .0044 (entire plant) when compared with dataset (1) as well as p = .0005 (individual spectra) and p = .0006 (entire plant) when compared with dataset (2).
FIGURE 6
FIGURE 6
Comparison of flowering time of the eight Cannabis sativa L. cultivars. Numbers of plants per cultivar which flowered at a certain date are represented as stacked bars. (a) shows results from plants grown under control conditions and (b) from plants grown under fertilized conditions.

References

    1. Amaducci, S. , Errani, M. , & Venturi, G. (1998). Comparison among monoecious and dioecious hemp (Cannabis sativa L.) genotypes: Preliminary results. L'informatore Agrario, 26, 39–42.
    1. Awwad, E. , Hamad, B. , Mabsout, M. , & Khatib, H. (2010). Sustainable construction material using hemp fibers–preliminary study. In Second international conference on sustainable construction materials. Ancona, Italy: Università Politecnica delle.
    1. Backhaus, A. , & Seiffert, U. (2013). Comprehensive, non‐invasive, and quantitative monitoring of the health and nutrition state of crop plants by means of hyperspectral imaging and computational intelligence based analysis. In Jürgen Beyerer F. P. L. & Längle T. (Eds.), Optical characterization of materials (pp. 103–114). KIT Scientific Publishing.
    1. Batista, G. E. , Prati, R. C. , & Monard, M. C. (2004). A study of the behavior of several methods for balancing machine learning training data. ACM SIGKDD Explorations Newsletter, 6(1), 20–29.
    1. Benelli, G. , Pavela, R. , Lupidi, G. , Nabissi, M. , Petrelli, R. , Kamte, S. L. N. , Cappellacci, L. , Fiorini, D. , Sut, S. , & Dall'Acqua, S. (2018). The crop‐residue of fiber hemp cv. Futura 75: From a waste product to a source of botanical insecticides. Environmental Science and Pollution Research, 25(11), 10515–10525. - PubMed

LinkOut - more resources