. 2023 Sep 4;5(20):5543-5561.
doi: 10.1039/d3na00483j. eCollection 2023 Oct 10.

Differences between surfactant-free Au@Ag and CTAB-stabilized Au@Ag star-like nanoparticles in the preparation of nanoarrays to improve their surface-enhanced Raman scattering (SERS) performance

Affiliations

Differences between surfactant-free Au@Ag and CTAB-stabilized Au@Ag star-like nanoparticles in the preparation of nanoarrays to improve their surface-enhanced Raman scattering (SERS) performance

Sy Van Vu et al. Nanoscale Adv. .

Abstract

In this study, we assessed the controlled synthesis and efficacy of surface-enhanced Raman scattering (SERS) on two distinct types of star-like Au@Ag core-shell nanoarrays. These nanoarrays were designed based on gold nanostars (AuNSs), which were synthesized with and without CTAB surfactant (AuNSs-CTAB and AuNSs-FS, respectively). The AuNS-FS nanoparticles were synthesized via a novel modification process, which helped overcome the previous limitations in the free-surfactant preparation of AuNSs by significantly increasing the number of branches, increasing the sharpness of the branches and minimizing the adsorption of the surfactant on the surface of AuNSs. Furthermore, the differences in the size and morphology of these AuNSs in the created nanoarrays were studied. To create the nanoarrays, a three-step method was employed, which involved the controlled synthesis of gold nanostars, covering them with a silver layer (AuNSs-FS@Ag and AuNSs-CTAB@Ag), and finally self-assembling the AuNS@Ag core-shelled nanoparticles via the liquid/liquid self-assembly method. AuNSs-FS@Ag showed higher ability in forming self-assembled nanoarrays than the nanoparticles prepared using CTAB, which can be attributed to the decrease in the repulsion between the nanoparticles at the interface. The nano-substrates developed with AuNSs-FS@Ag possessed numerous "hot spots" on their surface, resulting in a highly effective SERS performance. AuNSs-FS featured a significantly higher number of sharp branches than AuNSs-CTAB, making it the better choice for creating nanoarrays. It is worth mentioning that AuNSs-CTAB did not exhibit the same benefits as AuNSs-FS. The morphology of AuNSs with numerous branches was formed by controlling the seed boiling temperature and adding a specific amount of silver ions. To compare the SERS activity between the as-prepared nano-substrates, i.e., AuNS-CTAB@Ag and AuNS-FS@Ag self-assembled nanoarrays, low concentrations of crystal violet aqueous solution were characterized. The results showed that the developed AuNSs-FS@Ag could detect CV at trace concentrations ranging from 1.0 ng mL-1 to 10 ng mL-1 with a limit of detection (LOD) of 0.45 ng mL-1 and limit of quantification (LOQ) of 1.38 ng mL-1. The nano-substrates remained stable for 42 days with a decrease in the intensity of the characteristic Raman peaks of CV by less than 7.0% after storage. Furthermore, the spiking method could detect trace amounts of CV in natural water from the Dong Nai River with concentrations as low as 1 to 100 ng mL-1, with an LOD of 6.07 ng mL-1 and LOQ of 18.4 ng mL-1. This method also displayed good reproducibility with an RSD value of 5.71%. To better understand the impact of CTAB stabilization of the Au@Ag star-like nanoparticles on their surface-enhanced Raman scattering (SERS) performance, we conducted density functional theory (DFT) calculations. Our research showed that the preparation of AuNSs-FS@Ag via self-assembly is an efficient, simple, and fast process, which can be easily performed in any laboratory. Furthermore, the research and development results presented herein on nanoarrays have potential application in analyzing and determining trace amounts of organic compounds in textile dyeing wastewater.


Conflict of interest statement

There are no conflicts to declare.

Figures

Fig. 1
Fig. 1. Scheme of the controlled synthesis of gold nanostar with CTAB and without the use of surfactant molecules, illustrating the differences in the structure and morphology of star-like nanoparticles. The as-synthesized AuNSs-CTAB and AuNSs-FS were shelled by a silver layer, self-assembled using the liquid/liquid interface self-assembly technique, and employed in developing SERS nano-substrates.
Fig. 2
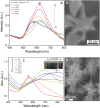
Fig. 2. (A) UV-Vis spectrum of the as-prepared AuNS-CTAB colloidal samples shows a blue shift from 630 and 628 to 620 nm with an increasing volume of 0.1 M AgNO3 from 0 to 50 μL, respectively. (B) Corresponding SEM micrograph of fine-tuned AuNS particles with eight symmetrical spikes formed using 10 μL of 0.1 M AgNO3, 0.1 M ascorbic acid, and 0.1 M CTAB. (C) UV-Vis absorbance spectrum of AuNS-FS colloids presents broad bands above 700 nm, indicating the presence of a spike morphology. With an increase in the volume of 0.01 M AgNO3, the spectrum showed a redshift in these bands. (D) SEM morphology of AuNSs synthesized without using surfactant with many long sharp spikes with a small core at 30 μL of 0.01 M AgNO3, 10 μL of 0.1 M HCl, and 100 μL of seed colloid.
Fig. 3
Fig. 3. SEM micrographs of (A–C) AuNSs-CTAB synthesized with of 0.8 mL of seed solution and 10 mL of growth solution containing 1.0 mL of 25 mM HAuCl4, 0.1 M CTAB, and 0.05 mM AgNO3 with different volumes of (A) 0, (B) 20, and (C) 30 μL (scale bars for all are 100 nm). (D–F) AuNSs coverage with Ag layers with a variation in the volume of AgNO3 of (D) 100, (E) 200, and (F) 300 μL of 10 mM AgNO3, with the other conditions of 275 μL of 10 mM ascorbic acid and 5 mL of AuNS colloidal solutions kept constant. (G–I) SEM images of gold nanostars with an increase in sharp spikes synthesized via the seed growth route without using surfactant for each additional volume of (G) 10, (H) 20, (I) 30 μL of 0.01 mM AgNO3, while the remaining factors including 10 mL of 0.25 mM HAuCl4, 10 μL of HCl 1.0 M, and 100 μL of the seed solution were unchanged. (J–M) Morphologies of AuNSs changed after covering with an Ag0 layer, where the tips became blunted and the core star grew bigger at (J) 100, (K) 200, and (L) 300 μL of 10 mM AgNO3. Corresponding UV-Vis spectra of (M) AuNSs-CTAB@Ag prepared at various 10 mM AgNO3 volumes ranging from 0 to 500 μL and (N) AuNSs-FS@Ag at different volumes of 10 mM AgNO3 from 0 to 700 μL.
Fig. 4
Fig. 4. TEM micrographs of AuNSs-CTAB@Ag with an average size of approximately 150 nm covered with (A) 150 and (B) 200 μL of AgNO3. (C) HRTEM image exhibiting contrast areas collected on the focus region of one particle reported in (B), revealing the Ag layer coverage on the Au core surface. (D) Selected area electron diffraction (SAED) pattern of AuNS-CTAB@Ag nanocrystal with bright spots, indicating that the formed nanoparticles were highly crystalline.
Fig. 5
Fig. 5. (A) and (D) TEM images of AuNSs-CTAB@Ag at 1.0 and 1.5 mL volume of ethanol added into the two phases dispersion (scale bars of 100 and 250 nm), relatively. Corresponding STEM-EDS mapping for (B) Au and (C) Au elements acquired at a selected area on AuNSs-CTAB@Ag (scale bars, 100 nm), (E) and (F) after adding 1.5 mL ethanol (scale bars 250 nm), respectively.
Fig. 6
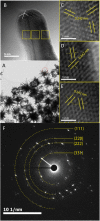
Fig. 6. (A) TEM images of AuNSs-FS@Ag with many branches protruding from the core of the two-component nanoparticles and (B) corresponding HR-TEM of the one branch selected from the nanoparticles in (A). (C)–(E) HR-TEM images taken at three selected regions on the branch of AuNSs-FS@Ag, presenting the d-spacing of the (111) crystalline facets and (F) SAED pattern of AuNS-FS@Ag nanocrystal with many bright spots, suggesting the crystalline structure of the nanoparticles.
Fig. 7
Fig. 7. STEM images of AuNSs-FS@Ag taken in (A) bright field and (B) dark field mode. EDS mapping analysis for (C) Au and (D) Ag elements obtained at a selected area on the AuNSs-FS@Ag.
Fig. 8
Fig. 8. Powder X-ray diffraction patterns of (A) AuNSs, (B) and (C) AuNSs-FS and AuNSs-CTAB after covering with an Ag layer and (D) and (E) Au and Ag reference diffraction peaks from JCPDF data (04-0783 and 04-0784, respectively).
Fig. 9
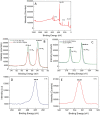
Fig. 9. (A) XPS survey spectrum of the AuNS-FS@Ag nanoarrays. High-resolution XPS spectra centered on (B) Au 4f (studied in the AuNS-FS and AuNS-FS@Ag samples), (C) Ag 3d (in the AuNS-FS and AuNS-FS@Ag samples), (D) C1s, and (E) O1s.
Fig. 10
Fig. 10. Process for the preparation of AuNS@Ag nanoarray: SEM images of (A) AuNSs prepared with CTAB, (B) and (C) AuNSs-CTAB after being covered with Ag layer, (D) dark blue color of AuNS colloid, (E) AuNS-CTAB@Ag nanoarrays formed at the interface between cyclohexane/water phases, (F) AuNS@Ag nanoarrays transferred to a glass slide, and (G) and (H) SEM images of AuNS@Ag nanoarrays taken at different magnifications (1 and 0.1 μm, respectively). SEM images of the AuNSs synthesized without using CTAB and covered with (I) thin layer of silver, (J) AuNS-FS@Ag formed using a large amount of silver ions, where the particle morphology is different from that prepared with CTAB. (K)–(M) Nanoarray of AuNSs-FS@Ag, from their formation at the oil/water interface to a thin layer on a glass slide. (N) and (O) SEM images of AuNSs-FS@Ag before and after the membrane-like structures are transferred to a glass slide, respectively.
Fig. 11
Fig. 11. (A) Typical SERS spectra for various crystal violet concentrations tested with AuNS-CTAB@Ag. (B) CV calibration curves of the 915, 1175, 1372, and 1621 cm−1 characteristic peaks used to study the relationship between peaks intensity and concentration. (C) SERS spectra of 20 distinct locations on the AuNS-CTAB@Ag nanoarray tested with crystal violet (0.2 μg mL−1). (D) SERS intensity of crystal violet at 1372 cm−1 from 20 random detection spots in AuNS-CTAB@Ag nanoarray.
Fig. 12
Fig. 12. (A) SERS spectra of various crystal violet concentrations tested with AuNS-FS@Ag without CTAB. (B) Corresponding linear calibration plot between CV primary peak intensity and different CV concentrations. (C) SERS spectra of 2 ng mL−1 CV at 20 distinct points on AuNS-FS@Ag (4 spectra for each substrate). (D) Intensity of the characteristic Raman peak of 2 ng mL−1 CV at 1372 cm−1 and the corresponding RSD value.
Fig. 13
Fig. 13. (A) SERS spectra of different CV concentrations ranging from 1 to 105 ng mL−1 spiked in Dong Nai River water and further investigated with the AuNS-FS@Ag self-assembled nanoarrays. CV calibration curves of 915, 1174, 1372, and 1612 cm−1 characteristic peaks to determine the relationship between peak intensity and concentration ranging from (B) 1.0 to 100 ng mL−1 and (C) 1.0 to 105 ng mL. (D) SERS spectra of 20 different spots on the AuNS-FS@Ag nanoarrays examined using CV at a concentration of 100 ng mL−1. (E) Intensity of the CV peaks at 1372 cm−1 measured at 20 different detection locations on the AuNS-FS@Ag nanoarrays.
Fig. 14
Fig. 14. (a) and (b) Optimized Au@Ag structure without and with CTAB molecule, respectively. (c) and (d) Differential charge density at the interfaces for Au@Ag without and with CTAB molecule. The red and green isosurfaces indicate charge accumulation and depletion, respectively. The isosurface level is set at 0.001 e A−3.
Fig. 15
Fig. 15. Process for the preparation of the AuNS@Ag nanoarray at the cyclohexane/water interface using the LLISA method for SERS experiments.

Similar articles

Cited by

References

    1. Sooraj K. P. Ranjan M. Rao R. Mukherjee S. Appl. Surf. Sci. 2018;447:576–581. doi: 10.1016/j.apsusc.2018.04.020. - DOI
    1. Liang X. Li N. Zhang R. Yin P. Zhang C. Yang N. Liang K. Kong B. NPG Asia Mater. 2021;13:8. doi: 10.1038/s41427-020-00278-5. - DOI
    1. Ambartsumyan O. Gribanyov D. Kukushkin V. Kopylov A. Zavyalova E. Int. J. Mol. Sci. 2020;21(9):3373. doi: 10.3390/ijms21093373. - DOI - PMC - PubMed
    1. Sharma B. Frontiera R. R. Henry A.-I. Ringe E. Van Duyne R. P. Mater. Today. 2012;15:16–25. doi: 10.1016/S1369-7021(12)70017-2. - DOI
    1. Pastorello M. Sigoli F. A. dos Santos D. P. Mazali I. O. Spectrochim. Acta, Part A. 2020;231:118113. doi: 10.1016/j.saa.2020.118113. - DOI - PubMed