

Metabolite profiling of peripheral blood plasma in pigs in early postnatal life fed whole bovine, caprine or ovine milk
- PMID: 37823089
- PMCID: PMC10564076
- DOI: 10.3389/fnut.2023.1242301
Metabolite profiling of peripheral blood plasma in pigs in early postnatal life fed whole bovine, caprine or ovine milk
Abstract
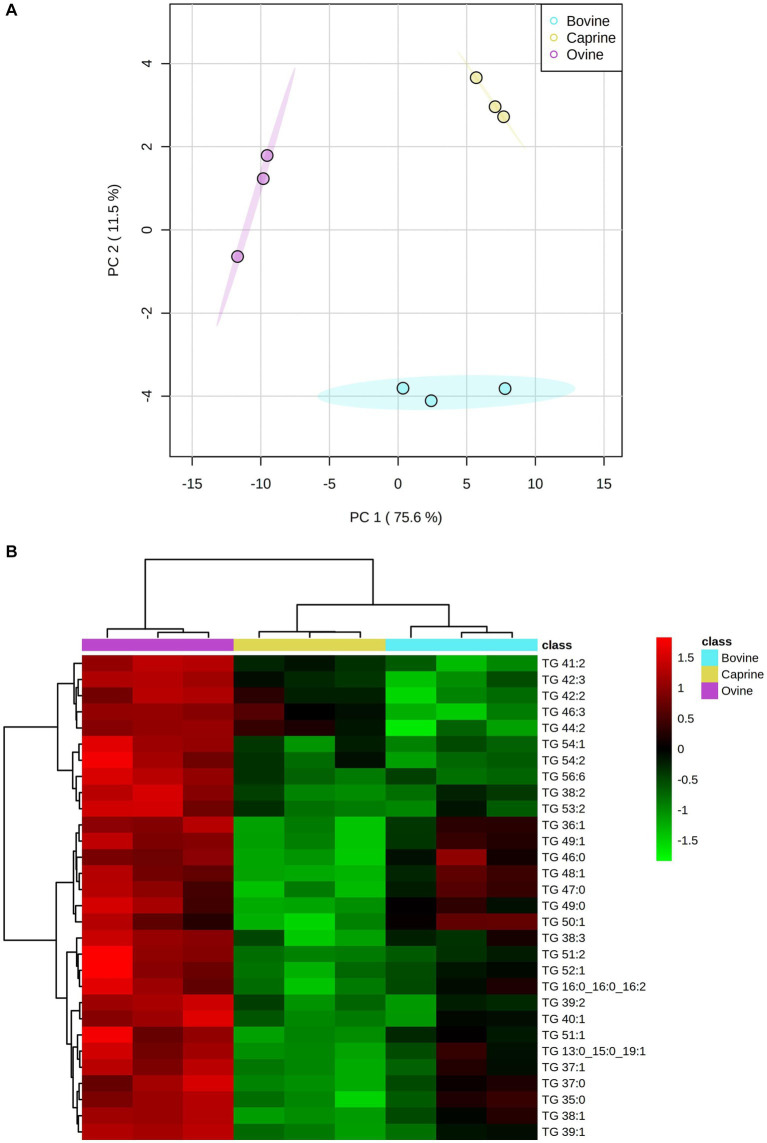
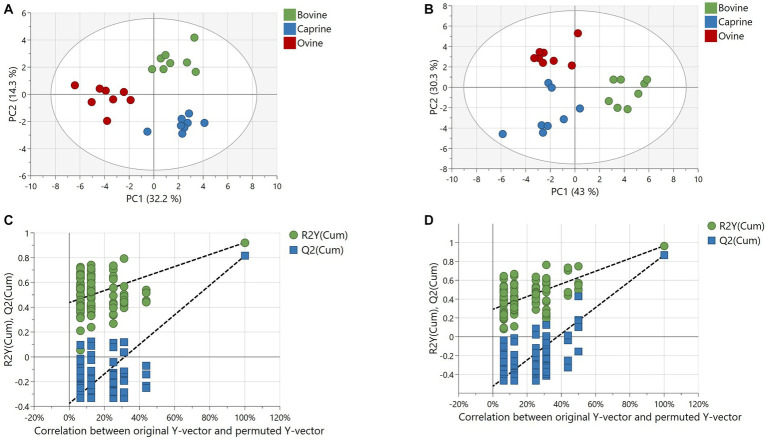
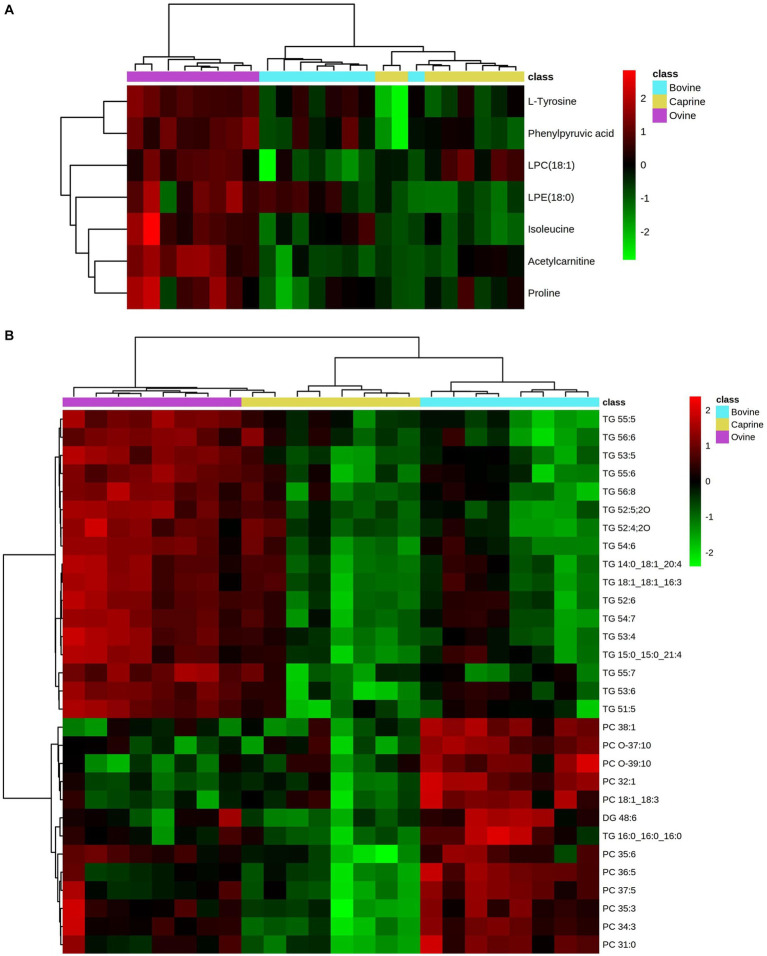
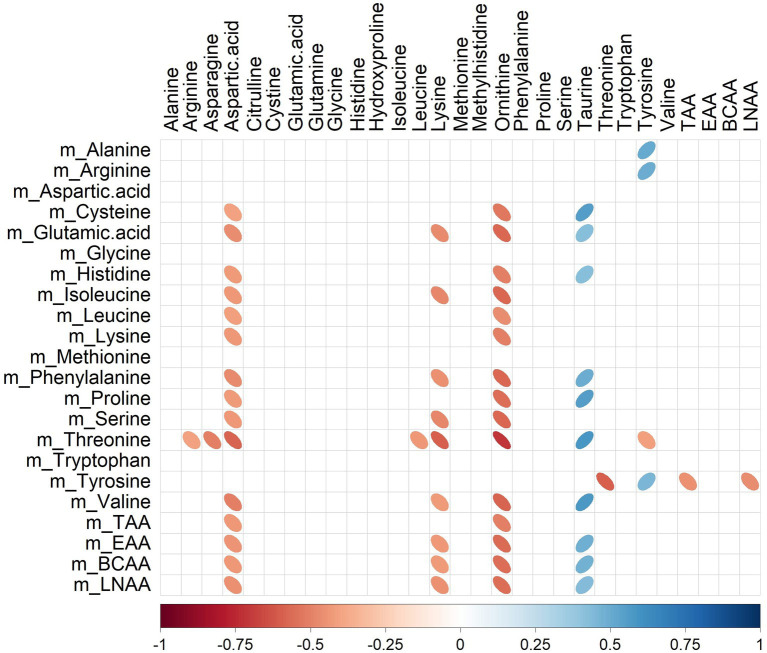
Ruminants' milk is commonly used for supplying nutrients to infants when breast milk is unavailable or limited. Previous studies have highlighted the differences between ruminants' milk composition, digestion, absorption, and fermentation. However, whether consuming different ruminants' milk impact the appearance of the circulatory blood metabolites in the early postnatal life is not well understood. The analysis conducted here aimed to determine the effect of feeding exclusively whole milk from bovine, caprine or ovine species to pigs, approximately 7 days-old for 15 days, on circulatory blood plasma metabolites. Relative intensities of plasma metabolites were detected using a liquid chromatography-mass spectrometry based metabolomic approach. Seven polar and 83 non-polar (lipids) metabolites in plasma were significantly different (false discovery rate < 0.05) between milk treatments. These included polar metabolites involved in amino acid metabolism and lipids belonging to phosphatidylcholine, lysophosphatidylcholine, sphingomyelin, and triglycerides. Compared to the caprine or bovine milk group, the relative intensities of polar metabolites and unsaturated triglycerides were higher in the peripheral circulation of the ovine milk group. In contrast, relative intensities of saturated triglycerides and phosphatidylcholine were higher in the bovine milk group compared to the ovine or caprine milk group. In addition, correlations were identified between amino acid and lipid intake and their appearance in peripheral blood circulation. The results highlighted that consuming different ruminants' milk influences the plasma appearance of metabolites, especially lipids, that may contribute to early postnatal life development in pigs.
Keywords: early life; infant; lipids; metabolomics; nutrition; pigs; plasma; ruminant milk.
Copyright © 2023 Jena, Montoya, Fraser, Giezenaar, Young, Mullaney, Dilger, Roy, McNabb and Roy.
Conflict of interest statement
The authors declare that the research was conducted in the absence of any commercial or financial relationships that could be construed as a potential conflict of interest. The reviewer CB declared a past co-authorship with the author RD to the handling editor.
Figures
Similar articles
-
A metabolomics analysis of interspecies and seasonal trends in ruminant milk: The molecular difference between bovine, caprine, and ovine milk.J Dairy Sci. 2024 Sep;107(9):6511-6527. doi: 10.3168/jds.2023-24595. Epub 2024 May 23. J Dairy Sci. 2024. PMID: 38788847
-
Heat-Treatments Affect Protease Activities and Peptide Profiles of Ruminants' Milk.Front Nutr. 2021 Mar 10;8:626475. doi: 10.3389/fnut.2021.626475. eCollection 2021. Front Nutr. 2021. PMID: 33777990 Free PMC article.
-
Effect of Heat Treatment on Protein Self-Digestion in Ruminants' Milk.Foods. 2023 Sep 21;12(18):3511. doi: 10.3390/foods12183511. Foods. 2023. PMID: 37761220 Free PMC article.
-
Review: Modulating ruminal lipid metabolism to improve the fatty acid composition of meat and milk. Challenges and opportunities.Animal. 2018 Dec;12(s2):s272-s281. doi: 10.1017/S1751731118001994. Epub 2018 Aug 24. Animal. 2018. PMID: 30139411 Review.
-
Recent developments in altering the fatty acid composition of ruminant-derived foods.Animal. 2013 Mar;7 Suppl 1:132-62. doi: 10.1017/S1751731112001681. Epub 2012 Sep 20. Animal. 2013. PMID: 23031638 Review.
References
-
- Crowley S. V., Kelly A. L., Lucey J. A., O’Mahony J. A. (2017). Potential applications of non-bovine mammalian milk in infant nutrition. In: Handbook of Milk of Non-Bovine Mammals. Hoboken, New Jersey, U.S.: John Wiley & Sons, Ltd, 625–654. doi: 10.1002/9781119110316.ch13 - DOI
-
- Martinez-Ferez A, Rudloff S, Guadix A, Henkel CA, Pohlentz G, Boza JJ, et al. . Goats’ milk as a natural source of lactose-derived oligosaccharides: isolation by membrane technology. Int Dairy J. (2006) 16:173–81. doi: 10.1016/j.idairyj.2005.02.003 - DOI
-
- Park YW. Hypo-allergenic and therapeutic significance of goat milk. Small Rumin Res. (1994) 14:151–9. doi: 10.1016/0921-4488(94)90105-8 - DOI
-
- Claeys WL, Verraes C, Cardoen S, De Block J, Huyghebaert A, Raes K, et al. . Consumption of raw or heated milk from different species: an evaluation of the nutritional and potential health benefits. Food Control. (2014) 42:188–201. doi: 10.1016/j.foodcont.2014.01.045 - DOI
LinkOut - more resources
Full Text Sources