. 2023 Jul 31;11(10):6336-6348.
doi: 10.1002/fsn3.3572. eCollection 2023 Oct.

Lipidomic analyses of five Carya illinoinensis cultivars

Affiliations

Lipidomic analyses of five Carya illinoinensis cultivars

Zhe Zhao et al. Food Sci Nutr. .

Abstract

Carya illinoinensis (Wangenh.) K. Koch, nuts are a renowned health food. However, there are many cultivars of this nut tree, and their mature kernel lipid composition has not been thoroughly studied. Therefore, we used liquid chromatography-mass spectrometry (LC-MS) to analyze the lipid composition of mature nuts of five C. illinoinensis cultivars. In the mature kernels of all cultivars, there were 58 lipid types which were mainly composed of glycerolipids (c. 65%) and phospholipids (>30%). Triacylglycerol (TG) accounted for the largest proportion of mature nuts of all cultivars, exceeding 50%; and diacylglycerol (DG), ceramide (Cer), phosphatidylcholine (PC), and phosphatidylethanolamine (PE) were also relatively high. Additionally, nuts contain fatty acids, mainly oleic, linoleic, and linolenic acids. Our research provides a new perspective for the processing and utilization of plant and edible oils, and for the use of C. illinoinensis kernels in the development of medicine and food science.

Keywords: Carya illinoinensis; cultivars; kernel; lipidomics; nutrients.


Conflict of interest statement

The authors declare that they have no known competing financial interests or personal relationships that could have appeared to influence the work reported in this paper.

Figures

FIGURE 1
FIGURE 1
Pie chart of lipid Class classification in five cultivars. The lipids of each cultivar were classified according to their lipid structure, each color area in the pie chart represents the structure of different types of lipids, and numbers in the figure indicate the number of substances of the lipid, the percentage is the proportion.
FIGURE 2
FIGURE 2
Population sample level clustering tree. In the legend of this figure, five different colors are used to represent the five cultivars, M for ‘Mahan’, S for ‘Shaoxing’, X for ‘Shoshoni’, W for ‘Wichita’, and B for ‘Pawnee’, the samples under the same cluster tree have higher similarity. In the later grouped figures, the classification of cultivars shown is the same as in this legend.
FIGURE 3
FIGURE 3
PCA analyses (a) Kernel sample clustering and dispersion of different cultivars, and (b) PCA loading diagram.
FIGURE 4
FIGURE 4
OPLS analyses (a) Kernel sample clustering and dispersion of different cultivars, (b) OPLS‐DA loading diagram, (c) OPLS‐DA permutation test, and (d) OPLS‐DA S‐plot analysis.
FIGURE 5
FIGURE 5
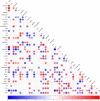
Differential lipid Class association heat map. In this figure, red indicates a positive correlation and blue indicates a negative correlation. The darker the color, the stronger the correlation.
FIGURE 6
FIGURE 6
Histogram of differential lipid class classification. M vs. S vs. X vs. W vs. B in the top part of this figure represents the comparison of different lipids among the five cultivars of ‘Mahan’, ‘Shaoxing’, ‘Shoshoni’, ‘Wichita’, and ‘Pawnee’. Rectangle height in each histogram represents lipid signal strength, significant differences are reflected by histogram height difference between groups, and the error bar represents the standard error.
FIGURE 7
FIGURE 7
Lipid community. Enrichment analysis results are presented as LION bubble plots with the abscissa representing the −Log 10 value of the enriched FDR q‐value. The ordinate represents name, structure, and function of lipids in the enriched LION database. The color indicates the significance of the enrichment p value, the redder the color, the more significant the enrichment result. Bubble dot size indicates the number of differential lipids enriched into that entry, with larger dots indicating more enriched lipids.

References

    1. Alasalvar, C. , & Bolling, B. W. (2015). Review of nut phytochemicals, fat‐soluble bioactives, antioxidant components and health effects. The British Journal of Nutrition, 113(Suppl 2), S68–S78. - PubMed
    1. Belayneh, H. D. , Wehling, R. L. , Yue, Z. , & Ciftci, O. N. (2018). Development of omega‐3‐rich Camelina sativa seed oil emulsions. Food Science & Nutrition, 6(2), 440–449. - PMC - PubMed
    1. Chung, S. Y. , Mattison, C. P. , Grimm, C. C. , & Reed, S. (2017). Simple methods to reduce major allergens Ara h 1 and Ana o 1/2 in peanut and cashew extracts. Food Science & Nutrition, 5(6), 1065–1071. - PMC - PubMed
    1. Concilco‐Alberto, E. , Valenzuela‐Núñez, L. M. , González‐Torres, A. , La Peña, C. G. , Briceño‐Contreras, E. A. , Rivera, J. R. E. , Reyes‐Carrillo, J. L. , & García‐Carrillo, M. (2022). Total soluble sugars in root and stem of Wichita and Western Carya Illinoinensis cultivars in northern Mexico. Rural Sustainability Research, 47(342), 8–15.
    1. Dalli, J. , Colas, R. A. , Walker, M. E. , & Serhan, C. N. (2018). Lipid mediator metabolomics via LC‐MS_MS profiling and analysis. Methods in Molecular Biology, 1730, 59–72. - PubMed

LinkOut - more resources