. 2023 Dec 1;325(6):F792-F810.
doi: 10.1152/ajprenal.00292.2023. Epub 2023 Oct 12.

Farnesoid X receptor prevents neutrophil extracellular traps via reduced sphingosine-1-phosphate in chronic kidney disease

Affiliations

Farnesoid X receptor prevents neutrophil extracellular traps via reduced sphingosine-1-phosphate in chronic kidney disease

Bryce A Jones et al. Am J Physiol Renal Physiol. .

Abstract

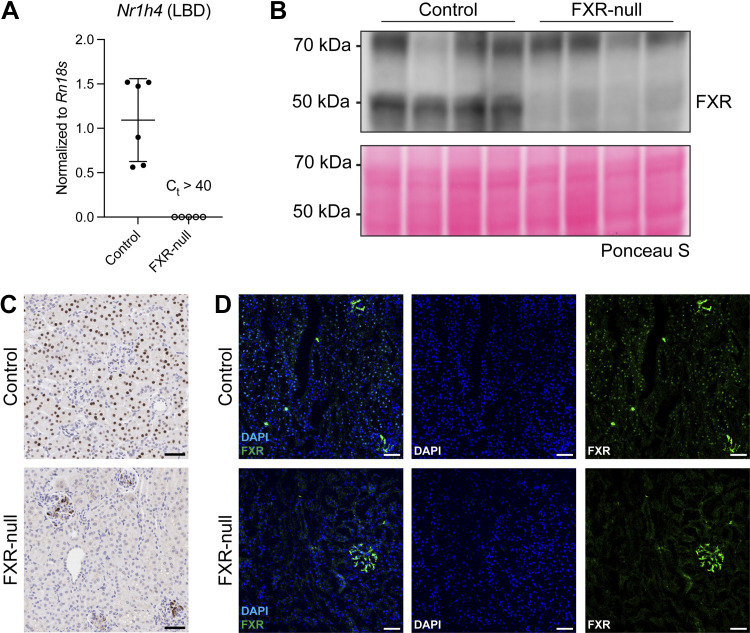
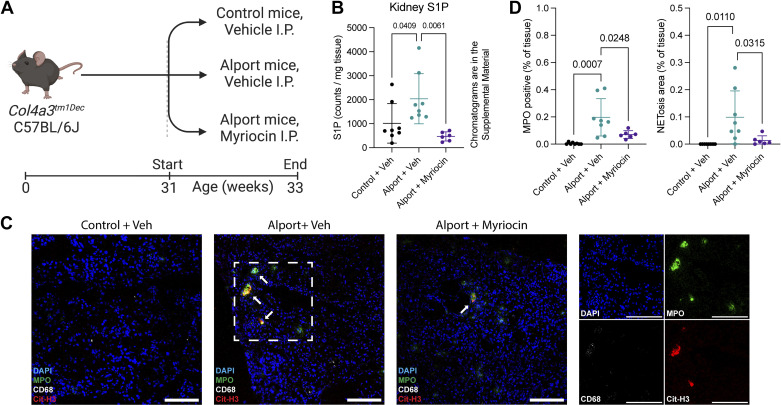
Farnesoid X receptor (FXR) activation reduces renal inflammation, but the underlying mechanisms remain elusive. Neutrophil extracellular traps (NETs) are webs of DNA formed when neutrophils undergo specialized programmed cell death (NETosis). The signaling lipid sphingosine-1-phosphate (S1P) stimulates NETosis via its receptor on neutrophils. Here, we identify FXR as a negative regulator of NETosis via repressing S1P signaling. We determined the effects of the FXR agonist obeticholic acid (OCA) in mouse models of adenosine phosphoribosyltransferase (APRT) deficiency and Alport syndrome, both genetic disorders that cause chronic kidney disease. Renal FXR activity is greatly reduced in both models, and FXR agonism reduces disease severity. Renal NETosis and sphingosine kinase 1 (Sphk1) expression are increased in diseased mice, and they are reduced by OCA in both models. Genetic deletion of FXR increases Sphk1 expression, and Sphk1 expression correlates with NETosis. Importantly, kidney S1P levels in Alport mice are two-fold higher than controls, and FXR agonism restores them back to baseline. Short-term inhibition of sphingosine synthesis in Alport mice with severe kidney disease reverses NETosis, establishing a causal relationship between S1P signaling and renal NETosis. Finally, extensive NETosis is present in human Alport kidney biopsies (six male, nine female), and NETosis severity correlates with clinical markers of kidney disease. This suggests the potential clinical relevance of the newly identified FXR-S1P-NETosis pathway. In summary, FXR agonism represses kidney Sphk1 expression. This inhibits renal S1P signaling, thereby reducing neutrophilic inflammation and NETosis.NEW & NOTEWORTHY Many preclinical studies have shown that the farnesoid X receptor (FXR) reduces renal inflammation, but the mechanism is poorly understood. This report identifies FXR as a novel regulator of neutrophilic inflammation and NETosis via the inhibition of sphingosine-1-phosphate signaling. Additionally, NETosis severity in human Alport kidney biopsies correlates with clinical markers of kidney disease. A better understanding of this signaling axis may lead to novel treatments that prevent renal inflammation and chronic kidney disease.

Keywords: Alport syndrome; NETosis; adenine diet; farnesoid X receptor; sphingosine-1-phosphate.


Conflict of interest statement

B.A.J. discloses a financial interest in AllazoHealth (New York, NY). None of the other authors has any conflicts of interest, financial or otherwise, to disclose.

Figures

None
Graphical abstract
Figure 1.
Figure 1.
Authentication of key biological resources. A: relative transcript level of Nr1h4 in the kidney using primers specific for the C-terminal ligand-binding domain (LBD) of FXR. Ct values over 40 could not be quantified and are arbitrarily set to zero. B: immunoblot of total-kidney lysate shows that FXR is not expressed in FXR-null mice. Total protein (Ponceau S) was used as a loading control. C: immunohistochemistry of control and FXR-null kidneys shows absence of nuclear staining in the tubules of FXR-null mice. Glomerular signal in FXR-null kidneys does not exclusively localize to the nucleus, and it arises from binding of the secondary antibody to endogenous immunoglobulin. Isotype and secondary antibody control slides are presented in the Supplemental Material. D: this subfigure is best viewed with a computer. Immunofluorescence shows absence of tubule staining in FXR-null mice. Glomerular signal arises from binding of the secondary antibody to endogenous immunoglobulin (data not shown). Scale bars represent 50 µm. Data are expressed as the means ± SD, and each datum represents one mouse. FXR, farnesoid X receptor.
Figure 2.
Figure 2.
Renal FXR signaling is reduced in adenine mice. A: experimental design: Mice were fed a control diet or an adenine-enriched diet to induce kidney disease. B: renal Nr1h4 expression was reduced in adenine mice compared with healthy controls. C and D: renal FXR protein expression was unchanged on immunoblot in adenine mice compared with healthy controls. Total protein (Ponceau S) was used as a loading control. E: renal transcription of the canonical FXR target genes are reduced in adenine mice, thus implying reduced FXR activity. Significance was determined by Student’s two-tailed t test, and exact P values are shown. Data are expressed as the means ± SD, and each datum represents one mouse. FXR, farnesoid X receptor.
Figure 3.
Figure 3.
Renal FXR signaling is reduced in Alport mice. A: experimental design: Alport mice on the fast-progressing 129S1/SvImJ background rapidly develop kidney disease compared with littermate controls. Two timepoints were investigated. B: renal Nr1h4 expression was unchanged in 8-wk Alport mice compared with healthy controls. C, D: renal FXR protein expression was unchanged on immunoblot in 8-wk Alport mice compared with healthy controls. Total protein (Ponceau S) was used as a loading control. E and F: renal transcription of some FXR target genes are decreased at the 8-wk timepoint, but all FXR target genes are decreased by the 11- to 12-wk timepoint. Significance was determined by Student’s two-tailed t test, and exact P values are shown. Data are expressed as the means ± SD, and each datum represents one mouse. FXR, farnesoid X receptor.
Figure 4.
Figure 4.
FXR agonism prevents kidney disease in adenine mice. A: experimental design: OCA treatment was investigated in the adenine diet model. B and D: representative images and quantification of picrosirius red (PSR) stained kidneys imaged with polarized light show that OCA reduced renal fibrosis. C, E and F: oil red O staining shows that OCA reduced renal lipid accumulation (top row). OCA does not affect 2,8-DHA crystals (bottom row, arrowheads). Scale bars represent 100 µm. Significance was determined by one-way ANOVA with the Holm–Šídák correction for multiple comparisons, and exact P values are shown. Data are expressed as the means ± SD, and each datum represents one mouse. FXR, farnesoid X receptor; OCA, obeticholic acid.
Figure 5.
Figure 5.
FXR agonism prevents kidney disease in Alport mice. A: experimental design: control and Alport mice on the fast-progressing 129S1/SvImJ background were treated with or without obeticholic acid (OCA). B: OCA treatment reduced blood urea nitrogen (BUN), plasma creatinine (trend), and urinary albumin-to-creatinine ratio (ACR) in Alport mice. As described in the materials and methods, urinary ACR was quantified for all available Alport samples. C: representative images and quantification of picrosirius red (PSR) stained kidneys imaged with polarized light show that OCA reduced renal fibrosis. D: representative images and quantification of fibronectin immunofluorescence further confirm that OCA reduced renal fibrosis. Scale bars represent 100 µm. Significance was determined by one-way ANOVA with the Holm–Šídák correction for multiple comparisons, and exact P values are shown. Data are expressed as the means ± SD, and each datum represents one mouse.
Figure 6.
Figure 6.
Biological processes related to neutrophils are increased in adenine mice. Principal component analysis (PCA) and Gene Ontology (GO) enrichment analysis were performed on RNA-sequencing data from PMID 33779314. A description of the experiment is in Supplemental Table S1. A: PCA reduces dimensionality of the dataset, and each datum represents one mouse. B and C: the adjusted P values (B), gene ratios (B), and fold increases (C) are shown for the 250 most upregulated genes in adenine mice compared with control.
Figure 7.
Figure 7.
Biological processes related to neutrophils are increased in Alport mice. Principal component analysis (PCA) and Gene Ontology (GO) enrichment analysis were performed on RNA-sequencing data from PMID 35203245. A description of the experiment is in Supplemental Table S1. A: PCA reduces dimensionality of the dataset, and each datum represents one mouse. B and C: the adjusted P values (B), gene ratios (B), and fold increases (C) are shown for the 250 most upregulated genes in Alport mice compared with control.
Figure 8.
Figure 8.
Neutrophilic infiltrate is abundant in adenine mice. A: immunohistochemistry for CD45 shows that adenine mice have extensive immune cell infiltration compared with control mice. B and C: immunohistochemistry for Ly-6G (B) and MPO (C), both neutrophil-specific markers, shows that a subset of the CD45-positive cells are neutrophils. The identical staining patterns in (B) and (C) clearly demonstrates that the cells are neutrophils. Scale bars represent 1 mm in the slide scans (both control and adenine) and 100 µm in the inset images. Samples in A, B, and C are serial sections, 5 µm each. Images are representative of four control and four adenine mice. MPO, myeloperoxidase.
Figure 9.
Figure 9.
Neutrophilic infiltrate is abundant in Alport mice. A: immunohistochemistry for CD45 shows that Alport mice (8-wk-old, 129S1/SvImJ) have extensive immune cell infiltration compared with control mice. B and C: immunohistochemistry for Ly-6G (B) and MPO (C), both neutrophil-specific markers, shows that a subset of the CD45-positive cells are neutrophils. The identical staining patterns in (B) and (C) clearly demonstrates that the cells are neutrophils. Scale bars represent 1 mm in the slide scans and 50 µm in the inset images. Samples in A, B, and C are serial sections, 3 µm each. Images are representative of five control and three Alport mice. MPO, myeloperoxidase.
Figure 10.
Figure 10.
FXR agonism reduces neutrophilic inflammation and NETosis in adenine mice. Kidneys from surviving vehicle- and OCA-treated adenine mice were stained for NETosis, and they were compared with three unremarkable control kidneys. A: adenine mice have extensive NETosis (arrows) as shown by colocalization (yellow) of myeloperoxidase (MPO, green) and citrullinated histone H3 (Cit-H3, red). 2,8-DHA crystals bind antibodies non-specifically (arrowheads in A), and this signal was excluded during quantification. B: quantification of A shows that OCA reduced both MPO-positive neutrophilic inflammation and NETosis in adenine mice. C: high magnification (×63) confocal microscopy of a vehicle-treated adenine mouse shows characteristic “web-like” NETosis morphology, strongly supporting the conclusion that these lesions are NETs. D: this subfigure is best viewed on a computer. Slide scan (×20) showing the remarkable severity of NETosis in adenine mice. DAPI and CD68 single-channel images are in Supplemental Fig. S8A. Scale bars represent 100 µm (A), 20 µm (C), and 1 mm (D). Significance was determined by one-way ANOVA with the Holm–Šídák correction for multiple comparisons, and exact P values are shown. Data are expressed as the means ± SD, and each datum represents one mouse. FXR, farnesoid X receptor; OCA, obeticholic acid.
Figure 11.
Figure 11.
FXR agonism reduces neutrophilic inflammation and NETosis in Alport mice. A: kidneys from one-half of the vehicle- and OCA-treated Alport mice were randomly chosen for NETosis staining. Alport mice on the fast-progressing 129S1/SvImJ background have extensive NETosis (arrows) as shown by colocalization (yellow) of myeloperoxidase (MPO, green) and citrullinated histone H3 (Cit-H3, red). B: quantification of A shows that OCA reduced MPO-positive neutrophilic inflammation and NETosis in Alport mice. C: this subfigure is best viewed on a computer. Slide scan (×20) showing the remarkable severity of NETosis in Alport mice. DAPI and CD68 single-channel images are in Supplemental Fig. S8B. Scale bars represent 100 µm (A) and 1 mm (C). Significance was determined by one-way ANOVA with the Holm–Šídák correction for multiple comparisons, and exact P values are shown. Data are expressed as the means ± SD, and each datum represents one mouse. FXR, farnesoid X receptor; OCA, obeticholic acid.
Figure 12.
Figure 12.
Renal NETosis occurs in humans with Alport syndrome and correlates with the severity of kidney disease. This figure is best viewed on a computer. AC: kidney biopsies from humans with Alport syndrome were stained for NETosis, identified by colocalization (yellow) of myeloperoxidase (MPO, green) and citrullinated histone H3 (Cit-H3, red). Representative multispectral images (×20) are shown from biopsies with mild (A), moderate (B), and severe (C) NETosis. Only two of the 15 kidney biopsies did not have any NETosis (data not shown). Arrows in C indicate areas of significant NETosis that were not chosen for inset images. Isolated NETting neutrophils are scattered throughout C and are unlabeled. D: multispectral image (×20) showing NETs from inset in C. Additional inset images from C are provided in Supplemental Fig. S10. E: multispectral image (×40) showing NETs from inset in D. FH: NETosis grade is positively correlated with serum creatinine (F), interstitial fibrosis and tubular atrophy (IFTA) (G), and glomerulosclerosis (GS) (H). I: NETosis grade is not correlated with proteinuria. Scale bars represent 1 mm in the large images and 100 µm in the inset images. All images in this figure were spectrally unmixed to remove autofluorescence, provided in Supplemental Fig. S11. Kendall rank correlation was performed, and exact P values are shown. Each datum represents one biopsy. NET, Neutrophil extracellular trap.
Figure 13.
Figure 13.
FXR prevents kidney Sphk1 expression and reduces S1P levels. A: Sphk1 expression is increased upon genetic deletion of FXR. B: Sphk1 expression is increased in adenine mice and reduced by FXR agonism. C: Sphk1 expression is increased in Alport mice and reduced by FXR agonism. D: Sphk1 expression is positively correlated (trend) with NETosis in adenine mice. E: Sphk1 expression is positively correlated with NETosis in Alport mice. F: analysis of extracted lipids shows that relative kidney S1P levels are increased in Alport mice and reduced by FXR agonism. Significance was determined by Student’s t test (A), one-way ANOVA with the Holm–Šídák correction for multiple comparisons (B, C, and F), and Spearman’s rank correlation (D and E). Exact P values are shown. Data are expressed as the means ± SD, and each datum represents one mouse. FXR, farnesoid X receptor; S1P, sphingosine-1-phosphate.
Figure 14.
Figure 14.
Inhibition of de novo sphingosine synthesis reverses NETosis and promotes resolution of neutrophilic inflammation. A: experimental design: Alport mice on the slow-progressing C57BL/6J background were treated with or without myriocin for 2 wk. B: analysis of extracted lipids shows that relative kidney S1P levels are increased in Alport mice and reduced by myriocin. C and D: Alport mice had moderate NETosis (arrows) which was reversed by short-term inhibition of de novo sphingosine synthesis. Scale bars represent 100 μm. Significance was determined by one-way ANOVA with the Holm–Šídák correction for multiple comparisons, and exact P values are shown. Data are expressed as the means ± SD, and each datum represents one mouse. S1P, sphingosine-1-phosphate.
Figure 15.
Figure 15.
Proposed mechanism for the FXR-mediated prevention of neutrophilic inflammation and NETosis in the kidney. Under physiological conditions, FXR functions to repress Sphk1 gene expression and maintain kidney S1P at baseline levels. Reduced FXR activity in the setting of chronic kidney disease drives an increase in Sphk1 gene expression, contributing at least in part to elevated renal S1P. This promotes neutrophilic inflammation and NETosis in the kidney. Pharmacological FXR agonism, such as with OCA, represses Sphk1 gene expression and thus prevents these changes in the kidney. FXR, farnesoid X receptor; OCA, obeticholic acid; S1P, sphingosine-1-phosphate.

References

    1. Betjes MG. Immune cell dysfunction and inflammation in end-stage renal disease. Nat Rev Nephrol 9: 255–265, 2013. doi:10.1038/nrneph.2013.44. - DOI - PubMed
    1. van der Rijt S, Leemans JC, Florquin S, Houtkooper RH, Tammaro A. Immunometabolic rewiring of tubular epithelial cells in kidney disease. Nat Rev Nephrol 18: 588–603, 2022. doi:10.1038/s41581-022-00592-x. - DOI - PubMed
    1. Meng XM, Nikolic-Paterson DJ, Lan HY. Inflammatory processes in renal fibrosis. Nat Rev Nephrol 10: 493–503, 2014. doi:10.1038/nrneph.2014.114. - DOI - PubMed
    1. Simmonds HA. 2,8-Dihydroxyadenine lithiasis. Clin Chim Acta 160: 103–108, 1986. doi:10.1016/0009-8981(86)90129-4. - DOI - PubMed
    1. Runolfsdottir HL, Palsson R, Agustsdottir IM, Indridason OS, Edvardsson VO. Kidney disease in adenine phosphoribosyltransferase deficiency. Am J Kidney Dis 67: 431–438, 2016. doi:10.1053/j.ajkd.2015.10.023. - DOI - PMC - PubMed

Publication types

LinkOut - more resources