. 2023 Oct 27;133(10):791-809.
doi: 10.1161/CIRCRESAHA.123.323161. Epub 2023 Oct 12.

Single-Nuclei RNA-Sequencing of the Gastrocnemius Muscle in Peripheral Artery Disease

Affiliations

Single-Nuclei RNA-Sequencing of the Gastrocnemius Muscle in Peripheral Artery Disease

Caroline G Pass et al. Circ Res. .

Abstract

Background: Lower extremity peripheral artery disease (PAD) is a growing epidemic with limited effective treatment options. Here, we provide a single-nuclei atlas of PAD limb muscle to facilitate a better understanding of the composition of cells and transcriptional differences that comprise the diseased limb muscle.

Methods: We obtained gastrocnemius muscle specimens from 20 patients with PAD and 12 non-PAD controls. Nuclei were isolated and single-nuclei RNA-sequencing was performed. The composition of nuclei was characterized by iterative clustering via principal component analysis, differential expression analysis, and the use of known marker genes. Bioinformatics analysis was performed to determine differences in gene expression between PAD and non-PAD nuclei, as well as subsequent analysis of intercellular signaling networks. Additional histological analyses of muscle specimens accompany the single-nuclei RNA-sequencing atlas.

Results: Single-nuclei RNA-sequencing analysis indicated a fiber type shift with patients with PAD having fewer type I (slow/oxidative) and more type II (fast/glycolytic) myonuclei compared with non-PAD, which was confirmed using immunostaining of muscle specimens. Myonuclei from PAD displayed global upregulation of genes involved in stress response, autophagy, hypoxia, and atrophy. Subclustering of myonuclei also identified populations that were unique to PAD muscle characterized by metabolic dysregulation. PAD muscles also displayed unique transcriptional profiles and increased diversity of transcriptomes in muscle stem cells, regenerating myonuclei, and fibro-adipogenic progenitor cells. Analysis of intercellular communication networks revealed fibro-adipogenic progenitors as a major signaling hub in PAD muscle, as well as deficiencies in angiogenic and bone morphogenetic protein signaling which may contribute to poor limb function in PAD.

Conclusions: This reference single-nuclei RNA-sequencing atlas provides a comprehensive analysis of the cell composition, transcriptional signature, and intercellular communication pathways that are altered in the PAD condition.

Keywords: ischemia; lower extremity; peripheral arterial disease; peripheral vascular diseases; transcriptome.


Conflict of interest statement

Disclosures None.

Figures

Figure 1.
Figure 1.
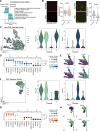
Single-nuclei transcriptional profiling of the gastrocnemius muscle in non–peripheral artery disease (PAD) controls and patients with PAD. A, Schematic of single-nuclei RNA-sequencing (snRNAseq) experiment. B, Uniform Manifold Approximation and Projection (UMAP) visualization of integrated data sets to identify clusters and UMAPs for non-PAD and PAD conditions. C, Percentage of nuclei in each cluster determined by group. D, Violin plots showing normalized expression levels of select differentially expressed genes in myonuclei populations. E, Violin plots showing Z score transformed expression level of select marker genes used to determine cluster identity. The presence of a vertical line is indicative of very low levels of gene expression in a given cell type. F, Gene set enrichment analysis (GSEA) of upregulated and downregulated genes in PAD nuclei populations. G, Representative images and quantification of the myosin heavy chain fiber type distributions and cross-sectional area (CSA) from non-PAD and PAD (n=12 non-PAD, n=15 PAD). H, Representative images and quantification of NCAM+ myofibers (n=12 non-PAD, n=15 PAD). Statistical analysis for % fiber type was performed using an unpaired 2-tailed Student t test, whereas myofiber CSA and NCAM (neural cell adhesion molecule)+ fibers were analyzed using a Mann-Whitney U test. Representative images were chosen based on accurate representation of the mean of the groups. FAP indicates fibro-adipogenic progenitor cells; GO, Gene Ontology; MuSC, muscle stem cell; MYH, myosin heavy chain; NES, normalized enrichment score; and NMJ, neuromuscular junction.
Figure 2.
Figure 2.
Subclustering analysis of myonuclei populations reveals transcriptional signatures and myonuclei populations that are unique to patients with peripheral artery disease (PAD). A, Uniform Manifold Approximation and Projection (UMAP) visualizations of type I myonuclei in non-PAD controls, patients with PAD, and integrated UMAP by condition, as well as (B) violin plots showing normalized expression levels of select genes in type I myonuclei. The presence of a vertical line is indicative of very low levels of gene expression in a given cluster. C, Feature plots of ANKRD1 and EGR1 upregulated expression in type I PAD myonuclei. D, UMAP visualizations of type II myonuclei in non-PAD controls, patients with PAD, and integrated UMAP by condition, as well as (E) violin plots showing normalized expression levels of select genes in type II myonuclei. The presence of a vertical line is indicative of very low levels of gene expression in a given cluster. F, Gene set enrichment analysis (GSEA) terms of upregulated and downregulated genes in clusters of type II myonuclei unique to PAD muscle. G, Feature plots of significantly upregulated genes in PAD, PDK4 and TRIM63, within type II myonuclei. TOR indicates target of rapamycin.
Figure 3.
Figure 3.
Increased transcriptional diversity and altered trajectory of peripheral artery disease (PAD) muscle stem cells (MuSCs) and regenerating myonuclei. A, Volcano plot of significantly upregulated and downregulated genes in PAD MuSC nuclei. B, Significant Gene set enrichment analysis (GSEA) terms upregulated and downregulated in PAD MuSC nuclei. C, Representative images and quantification of MuSC’s (n=11 non-PAD, n=15 PAD). Statistical analysis was performed using a Student t test. D, Volcano plot of upregulated and downregulated genes in PAD regenerating myonuclei. E, Significant GSEA terms upregulated and downregulated in PAD regenerating myonuclei. F, Representative images and quantification of regenerating myofibers (n=12 non-PAD, n=15 PAD). Statistical analysis was performed using a Mann-Whitney U test. G, Uniform Manifold Approximation and Projection (UMAP) visualizations of non-PAD and PAD MuSC and regenerating myonuclei with violin plots of top marker genes for subclusters. Dot plots of the top 4 non-PAD and PAD cluster markers with greatest log2 fold change. H, Feature plots showing expression of select genes in non-PAD and PAD. I, Trajectory plots overlayed on UMAPs for PAD and non-PAD MuSC and regenerating myonuclei. Visualization of tree analysis showing identified significant segments and milestones. Representative images were chosen based on accurate representation of the mean of the groups. DUSP1 indicates dual specificity phosphatase 1; eMyHC, embryonic myosin heavy chain; FC, fold change; FKBP5, FKBP prolyl isomerase 5; FOS, Fos proto-oncogene, AP-1 transcription factor subunit; FOSB, FosB proto-oncogene, AP-1 transcription factor subunit; FR, Fruchterman Reingold; MEF2C, myocyte enhancer factor 2C; MYH, myosin heavy chain; PAX, paired box; and Seg, segment.
Figure 4.
Figure 4.
Analysis of endothelial and smooth muscle cell nuclei in non–peripheral artery disease (PAD) and PAD gastrocnemius muscle. A, Gene set enrichment analysis (GSEA) terms of upregulated and downregulated genes in PAD endothelial cell nuclei. B, Representative images and quantification of capillary (PECAM1 [platelet endothelial cell adhesion molecule]/CD31 [cluster of differentiation 31] staining) and arteriole (MYH11 [myosin heavy chain 11] staining) density in non-PAD and PAD muscle (n=12 non-PAD, n=17 PAD). Capillary density was analyzed using an unpaired 2-tailed Student t test, while arteriole density was analyzed using a Mann-Whitney U test. C, Uniform Manifold Approximation and Projection (UMAP) visualization of non-PAD vascular nuclei and violin plots of known marker genes PECAM1 and MYH11. D, Dot plot of the top 4 cluster markers in non-PAD vascular nuclei. E, Feature plot visualization of select marker genes expression in non-PAD vascular nuclei. F, UMAP visualization of PAD vascular nuclei and violin plots of known marker genes PECAM1 and MYH11. G, Dot plot of the top 4 marker genes in PAD vascular nuclei. H, Feature plot visualization of select marker genes expression upregulated in PAD vascular nuclei. Representative images were chosen based on accurate representation of the mean of the groups.
Figure 5.
Figure 5.
Fibro-adipogenic progenitor (FAPs) have distinct transcriptional signatures in peripheral artery disease (PAD) muscle. A, Representative Masson trichrome images and quantification of fibrotic area from non-PAD and PAD muscles (n=12 non-PAD, n=17 PAD) analyzed using a Mann-Whitney U test. B, Volcano plot of significantly upregulated and downregulated genes in PAD FAPs. C, Gene set enrichment analysis (GSEA) terms of significantly upregulated and downregulated genes in PAD FAPs. D, Uniform Manifold Approximation and Projection (UMAP) visualization and dot plot of the top 4 cluster markers in non-PAD FAPs. E, UMAP visualization and dot plot of the top 4 cluster markers in PAD FAPs. F, Feature plots of select differentially expressed genes (DEGs) in non-PAD and PAD FAPs. G, Split violin plots of top DEGs presented with adjusted P values. Representative images were chosen based on accurate representation of the mean of the groups. COL4A1 indicates collagen type IV alpha 1.
Figure 6.
Figure 6.
CellChat analysis predicts changes in intercellular communication of patients with peripheral artery disease (PAD). A, Circle plots showing the overall intercellular communication occurring in non-PAD and PAD. Circle sizes represent the number of cells and edge width represents communication probability. B, Comparison of outgoing and incoming interaction strengths for all cells type in non-PAD and PAD. C, Ranked significant ligand-receptor communications for relative information flow between non-PAD and PAD muscles. D, Circle plots for FGF (fibroblast growth factor) signaling communication in non-PAD and PAD. FAP indicates fibro-adipogenic progenitor cells; and NMJ, neuromuscular junction.
Figure 7.
Figure 7.
Changes in outgoing and incoming signal patterns in peripheral artery disease (PAD) muscle. A, Enriched outgoing and incoming signaling patterns according to cell type and signaling strength. B, Chord plots for EGF (epidermal growth factor) signaling communication in non-PAD and PAD. C, Chord plots for IGF (insulin-like growth factor) signaling communication in non-PAD and PAD. D, Chord plots for BMP (bone morphogenetic protein) signaling communication in non-PAD and PAD. Colors within the chord plots represent the listed cell/nuclei types. FAP indicates fibro-adipogenic progenitor cells; MuSC, muscle stem cell; and NMJ, neuromuscular junction.

References

    1. Criqui MH, Aboyans V. Epidemiology of peripheral artery disease. Circ Res. 2015;116:1509–1526. doi: 10.1161/CIRCRESAHA.116.303849 - PubMed
    1. Criqui MH, Matsushita K, Aboyans V, Hess CN, Hicks CW, Kwan TW, McDermott MM, Misra S, Ujueta F, Epi AHAC, et al. . Lower extremity peripheral artery disease: contemporary epidemiology, management gaps, and future directions: a scientific statement from the American Heart Association. Circulation. 2021;144:E193–E193. doi: 10.1161/Cir.0000000000001019 - PMC - PubMed
    1. Wu AZ, Coresh J, Selvin E, Tanaka H, Heiss G, Hirsch AT, Jaar BG, Matsushita K. Lower extremity peripheral artery disease and quality of life among older individuals in the community. J Am Heart Assoc. 2017;6:e00459. doi: 10.1161/JAHA.116.004519 - PMC - PubMed
    1. Hammond MM, Tian L, Zhao L, Zhang D, McDermott MM. One-year change in walking performance and subsequent mobility loss and mortality rates in peripheral artery disease: longitudinal data from the WALCS. J Am Heart Assoc. 2021;10:e021917. doi: 10.1161/JAHA.121.021917 - PMC - PubMed
    1. McDermott MM, Liu K, Ferrucci L, Tian L, Guralnik JM, Liao Y, Criqui MH. Decline in functional performance predicts later increased mobility loss and mortality in peripheral arterial disease. J Am Coll Cardiol. 2011;57:962–970. doi: 10.1016/j.jacc.2010.09.053 - PMC - PubMed

Publication types