. 2023 Sep 23;164(11):bqad154.
doi: 10.1210/endocr/bqad154.

Ghrelin Action in the PVH of Male Mice: Accessibility, Neuronal Targets, and CRH Neurons Activation

Affiliations

Ghrelin Action in the PVH of Male Mice: Accessibility, Neuronal Targets, and CRH Neurons Activation

Gimena Fernandez et al. Endocrinology. .

Abstract

The hormone ghrelin displays several well-characterized functions, including some with pharmaceutical interest. The receptor for ghrelin, the growth hormone secretagogue receptor (GHSR), is expressed in the hypothalamic paraventricular nucleus (PVH), a critical hub for the integration of metabolic, neuroendocrine, autonomic, and behavioral functions. Here, we performed a neuroanatomical and functional characterization of the neuronal types mediating ghrelin actions in the PVH of male mice. We found that fluorescent ghrelin mainly labels PVH neurons immunoreactive for nitric oxide synthase 1 (NOS1), which catalyze the production of nitric oxide [NO]). Centrally injected ghrelin increases c-Fos in NOS1 PVH neurons and NOS1 phosphorylation in the PVH. We also found that a high dose of systemically injected ghrelin increases the ghrelin level in the cerebrospinal fluid and in the periventricular PVH, and induces c-Fos in NOS1 PVH neurons. Such a high dose of systemically injected ghrelin activates a subset of NOS1 PVH neurons, which do not express oxytocin, via an arcuate nucleus-independent mechanism. Finally, we found that pharmacological inhibition of NO production fully abrogates ghrelin-induced increase of calcium concentration in corticotropin-releasing hormone neurons of the PVH whereas it partially impairs ghrelin-induced increase of plasma glucocorticoid levels. Thus, plasma ghrelin can directly target a subset of NO-producing neurons of the PVH that is involved in ghrelin-induced activation of the hypothalamic-pituitary-adrenal neuroendocrine axis.

Keywords: CRF; GHSR; HPA axis; PVN; hypothalamus; stress.


Figures

Figure 1.
Figure 1.
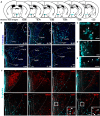
(A) Schematic diagrams from the Mouse Brain Atlas (45) showing coronal brain sections containing different rostro-caudal levels of the PVH (between bregma −0.58 mm and −1.22 mm). (B) Representative images of coronal brain sections containing the PVH of WT mice ICV injected with Fr-ghrelin (pseudocolored to cyan). Subdivisions of the PVH are overlayed following the delineation described in the Mouse Brain Atlas (45). fx, fornix; PaAP, PVH anterior parvicellular part; PaDC, PVH dorsal cap; PaLM, PVH lateral magnocellular part; PaMM, PVH medial magnocellular part; PaMP, PVH medial parvicellular part; PaPo, PVH posterior part; PaV, PVH ventral part; pe, periventricular hypothalamic nucleus; V, third ventricle. (C-E) Representative high magnification images of Fr-ghrelin+ cells in the PVH (C) and fiber-like structures in the periventricular region of the PVH of WT mice ICV injected with Fr-ghrelin (D, E). Arrows point to Fr-ghrelin+ cells and arrowheads point to Fr-ghrelin+ fiber-like structures. (F) Representative images of brain coronal sections containing the PVH of Gad2tdTomato (red) or WT mice ICV injected with Fr-ghrelin subjected to a fluorescent immunostaining against diverse neuropeptides including CRH, TRH, AVP, NT, TH, OXT, or NOS1 (red), respectively. Insets depict high magnification of areas marked in low magnification images. Arrows point to dual-labelled cells (Fr-ghrelin/OXT+ or Fr-ghrelin/NOS1+) and arrowheads to point single-labelled cells (OXT+ or NOS1+). Scale bars: 100 µm (low magnification) and 20 µm (high magnification). Cell nuclei labelled with Hoechst (blue).
Figure 2.
Figure 2.
(A) Representative images of coronal brain sections containing the PVH of WT mice ICV injected with Fr-ghrelin (pseudocolored to cyan) and subjected to a double-fluorescent immunostaining against OXT (red) and NOS1 (green). Inset depicts a high magnification of the area marked in low magnification image. Arrows point to triple-labelled cells (Fr-ghrelin/OXT/NOS1+). Scale bars: 50 µm (low magnification) and 20 µm (high magnification). Cell nuclei labelled with Hoechst (blue). (B) Venn diagram of Fr-ghrelin+, OXT+, and NOS1+ cells in the PVH of mice. (C-E) Plots of relative gene expression of Ghsr (C), Oxt (D), and Nos1 (E) in neurons classified as magnocellular or parvocellular, taken from the dataset of Lewis et al (42). Cyan circles represent neurons with non-0 relative expression (at least 1 read) for Ghsr. (F) Venn diagram of magnocellular neurons from the same dataset, classified as Ghsr+, Oxt+, and/or Nos1+ when presenting a relative expression greater than 0 for each respective gene. Venn diagrams were generated using eulerr (https://cran.r-project.org/package=eulerr) (47) in order to have the areas of circles and their intersections proportional to the number of neurons in each subgroup.
Figure 3.
Figure 3.
(A) Representative images of brain coronal sections containing the PVH of WT mice ICV injected with vehicle or ghrelin, respectively, subjected to a triple-immunostaining against c-Fos (white), OXT (red), or NOS1 (green). Insets depict a high magnification image of the areas marked in low magnification images. Arrows point to triple-labelled cells (c-Fos/OXT/NOS1+ cells) and arrowheads point c-Fos+ cells. Scale bars: 50 µm (low magnification) and 20 µm (high magnification). Cell nuclei labelled with Hoechst (blue). (B) Representative grayscale images of coronal brain sections containing the PVH of WT mice ICV injected with vehicle or ghrelin, respectively, perfused 15 minutes later and subjected to a chromogenic immunostaining against phospho-NOS1. Insets depict a high magnification image of the areas marked in low magnification images. Arrows point to phospho-NOS1+ cells. Scale bars: 50 µm (low magnification) and 20 µm (high magnification). (C) Bar graph displaying the quantitative analysis of the number of phospho-NOS1+ cells in the PVH of WT mice ICV injected with vehicle or ghrelin, respectively, and perfused 15, 30, or 120 minutes later. Data represent the mean ± SEM and were compared by 1-way ANOVA [Ftreat(3,9) = 59.06, P < .0001] followed by Tukey's multiple comparisons tests. ***P < .001 vs vehicle-treated group.
Figure 4.
Figure 4.
(A) Representative images of coronal brain sections containing the PVH of WT mice SC injected with vehicle, 60 pmol/g BW or 600 pmol/g BW of ghrelin, respectively, and subjected to a chromogenic immunostaining against c-Fos (black/purple). Scale bars: 100 µm. (B) Pseudocolored images of coronal brain sections containing the PVH of WT mice SC injected with vehicle or F-ghrelin 600 pmol/g BW, respectively, and subjected to a chromogenic immunostaining against fluorescein. Scale bars: 100 µm. (C) Line graph displaying the quantitative analysis of the optical density signal in a 300 μm box length placed over the PVH as shown in panel B. Data represent the mean ± SEM and were compared by unpaired Student's t-test with Welch correction. *P < .05 vs vehicle-treated group.
Figure 5.
Figure 5.
(A) Representative images of coronal brain sections containing the PVH of ARH-intact or ARH-ablated mice SC injected with vehicle or 600 pmol/g BW of ghrelin, respectively, subjected to a triple-immunostaining against c-Fos (white), OXT (red), or NOS1 (green). Insets depict a high magnification image of the areas marked in low magnification images. Arrows point to triple-labelled cells (c-Fos/OXT/NOS1+ cells) and arrowheads point to c-Fos+ cells. Scale bars: 50 µm (low magnification) and 20 µm (high magnification). Cell nuclei labelled with Hoechst (blue). (B-G) Bar graphs displaying the quantitative analysis of the percentage of PVHOXT/NOS1, PVHNOS1 and PVHOXT neurons positive for c-Fos in the periventricular (B, D, and F) or lateral region (C, E, and G) of the PVH, respectively, of ARH-intact or ARH-ablated mice SC treated with 600 pmol/g BW of ghrelin. Data presented as mean ± SEM. Data of each neuronal set and in each PVH region were compared using both 1-sample t-test vs 0%. to test if groups responded to ghrelin (comparisons labeled in red **P < .01 and *P < .05), and unpaired Student's t-test to test whether the magnitude of responses was different (comparison labeled in blue #P < .05).
Figure 6.
Figure 6.
(A) Schematic view of the fiber photometry system used for recording GCaMP8m-expressing CRH neurons signal in the mouse PVH. (B) Line graph displaying the quantitative analysis of the relative changes in fluorescence in the PVH of Crh-cre mice intra-PVH injected with a AAV.DIO-GCaMP8 m virus and IP-treated with vehicle, ghrelin 60 pmol/g BW, ghrelin 600 pmol/g BW, or ghrelin 600 pmol/g BW + L-NAME. The arrow indicates the time at which IP injections were performed and the dotted line indicates the time period in which fluorescence was analyzed and compared (shown in C). (C) Bar graph showing the quantitative analysis of the relative changes in fluorescence from 10 to 20 minutes after IP treatment in B. Data represent the mean ± SEM and were compared by 1-way ANOVA [Ftreat(3,16) = 2.494, P = .0971] followed by Fisher's Least Significant Difference (LSD) test (*P < .05). (D, E) Bar graphs displaying the quantitative analysis of the total number of c-Fos+ cells in the PVH (D) and plasma corticosterone levels (E) of WT mice SC-treated with vehicle, L-NAME (10 μg/g BW), ghrelin (600 pmol/g BW), or ghrelin (600 pmol/g BW) + L-NAME (10 μg/g BW). Data represent the mean ± SEM and were compared by 1-way ANOVA (in D [Ftreat(3,14) = 13.42, P = .0002]); in E [Ftreat(3,25) = 64.53, P < .0001] followed by Tukey's multiple comparisons tests. ***P < .001 and **P < .01, vs vehicle- and L-NAME-treated group; #P < .05, vs ghrelin-treated group.

References

    1. Howard AD, Feighner SD, Cully DF, et al. A receptor in pituitary and hypothalamus that functions in growth hormone release. Science. 1996;273(5277):974‐977. - PubMed
    1. Kojima M, Hosoda H, Date Y, Nakazato M, Matsuo H, Kangawa K. Ghrelin is a growth-hormone-releasing acylated peptide from stomach. Nature. 1999;402(6762):656‐660. - PubMed
    1. Giorgioni G, Del Bello F, Quaglia W, et al. Advances in the development of nonpeptide small molecules targeting ghrelin receptor. J Med Chem. 2022;65(4):3098‐3118. - PMC - PubMed
    1. Graf SA, Garcia JM. Anamorelin hydrochloride in the treatment of cancer anorexia–cachexia syndrome: design, development, and potential place in therapy. Drug Des Devel Ther. 2017;11:2325‐2331. - PMC - PubMed
    1. Broglio F, Arvat E, Benso A, et al. Ghrelin, a natural GH secretagogue produced by the stomach, induces hyperglycemia and reduces insulin secretion in humans. J Clin Endocrinol Metab. 2001;86(10):5083‐5086. - PubMed

Publication types

MeSH terms