. 2023 Nov;37(11):e23251.
doi: 10.1096/fj.202301122RR.

Targeting phospholipid remodeling pathway improves insulin resistance in diabetic mouse models

Affiliations

Targeting phospholipid remodeling pathway improves insulin resistance in diabetic mouse models

Ye Tian et al. FASEB J. 2023 Nov.

Abstract

Previous studies have revealed that membrane phospholipid composition controlled by lysophosphatidylcholine acyltransferase 3 (LPCAT3) is involved in the development of insulin resistance in type 2 diabetes. In this study, we aimed to investigate the therapeutic potential of targeting Lpcat3 in the treatment of insulin resistance in diabetic mouse models. Lpcat3 expression was suppressed in the whole body by antisense oligonucleotides (ASO) injection or in the liver by adeno-associated virus (AAV)-encoded Cre in high-fat diet (HFD)-induced and genetic ob/ob type 2 diabetic mouse models. Glucose tolerance test (GTT), insulin tolerance test (ITT), fasting blood glucose, and insulin levels were used to assess insulin sensitivity. Lipid levels in the liver and serum were measured. The expression of genes involved in de novo lipogenesis was analyzed by real-time RT-PCR. Metabolic rates were measured by indirect calorimetry using the Comprehensive Lab Animal Monitoring System (CLAMS). Our data demonstrate that acute knockout of hepatic Lpcat3 by AAV-Cre improves both hyperglycemia and hypertriglyceridemia in HFD-fed mice. Similarly, whole-body ablation of Lpcat3 by ASO administration improves obesity and insulin resistance in both HFD-fed and ob/ob mice. These findings demonstrate that targeting LPCAT3 could be a novel therapy for insulin resistance.

Keywords: LPCAT3; insulin resistance; obesity; phospholipid remodeling; type 2 diabetes.


Conflict of interest statement

Conflict of interest. R. L. holds shares in Verve Therapeutics. All other authors declare no competing interests related to this work.

Figures

Figure 1.
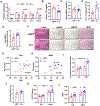
Figure 1.. Acute deletion of Lpcat3 in the liver improves insulin sensitivity in HFD-fed mice.
A. Growth curve of Lpcat3fl/fl mice fed HFD for 8 weeks followed by retro-orbital injection with AAV8-TBG-eGFP or AAV8-TBG-iCre (n=6–7/group). B-C. Body weight and body composition in AAV injected HFD fed mice. D. Lpcat3 mRNA levels in the liver and adipose tissues in AAV injected HFD fed mice. E-H. GTT, ITT and area under the curve (AUC) analysis in HFD-fed Lpcat3fl/fl mice injected with AAV8-TBG-eGFP or AAV8-TBG-iCre (n=6–7/group). I-K. Fasting blood glucose (I), serum insulin levels (J) and HOMA-IR (K) of HFD-fed Lpcat3fl/fl mice injected with AAV8-TBG-eGFP or AAV8-TBG-iCre (n=6–7/group). Data are represented as means ± SEM. Statistical analysis was performed with two-way ANOVA (C, E and G) and Student’s t test (B, D, F, H-K). *P < 0.05, **P < 0.01, ****P < 0.0001.
Figure 2.
Figure 2.. Acute deletion of Lpcat3 in the liver improves hypertriglyceridemia in HFD-fed mice.
A. Expression of selected genes in the livers of HFD-fed Lpcat3fl/fl mice injected with AAV8-TBG-eGFP or AAV8-TBG-iCre (n=6–7/group). B-E. Serum triglyceride (B) and NEFA (C) levels and liver triglyceride (D) and NEFA (E) levels of HFD-fed Lpcat3fl/fl mice injected with AAV8-TBG-eGFP or AAV8-TBG-iCre. F. Representative histology of liver, epididymal white adipose tissue (eWAT), subcutaneous white adipose tissue (sWAT) from HFD-fed Lpcat3fl/fl mice injected with AAV8-TBG-eGFP or AAV8-TBG-iCre. Scale bar: 100 μm. G-H. Energy expenditure (EE) analyzed by regression analysis of covariance (ANCOVA). I. EE estimated by univariate generalized linear model (GLM) with body mass set to 42.92 g (average body mass of AAV8-TBG-eGFP or AAV8-TBG-iCre injected mice on HFD). J-L. Food consumption (J), physical activity (K) and respiratory exchange ratio (RER) (L) in HFD-fed Lpcat3fl/fl mice injected with AAV8-TBG-eGFP or AAV8-TBG-iCre. Data are presented as means ± SEM. Statistical analysis was performed with Student’s t test (A-E, J), ANCOVA (G-H), and two-way ANOVA (I, K, L). *P < 0.05, **P < 0.01, ****P < 0.0001.
Figure 3.
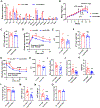
Figure 3.. Whole body silencing Lpcat3 expression improves HFD-induced obesity and insulin resistance.
A. Expression of Lpcat3 in different tissues of chow diet-fed C57BL/6 mice subcutaneously injected with control and Lpcat3 targeting ASOs (n=5–8/group). B. Growth curve of C57BL/6 mice fed HFD for 8 weeks followed by subcutaneous injection with control (Con-ASO) or Lpcat3 targeting ASO (Lpcat3-ASO) (n=12/group). C and F. Mouse body weight when GTT and ITT were performed. D-E and G-H. GTT, ITT and area under the curve (AUC) analysis in HFD-fed C57BL/6 mice injected with Con-ASO or Lpcat3-ASO (n=11–12/group). I-K. Fasting blood glucose (I), serum insulin levels (J) and HOMA-IR (K) of HFD-fed C57BL/6 mice injected with Con-ASO or Lpcat3-ASO. L-N. Final body weight (L), eWAT weight (M) and sWAT weight (N) of HFD-fed C57BL/6 mice injected with Con-ASO or Lpcat3-ASO. O. Food consumption of HFD-fed C57BL/6 mice injected with Con-ASO or Lpcat3-ASO. Data are presented as means ± SEM. Statistical analysis was performed with Student’s t test (A-C, E-F, H-O), and two-way ANOVA (D and G). *P < 0.05, **P < 0.01, ***P < 0.001, ****P < 0.0001.
Figure 4.
Figure 4.. Whole body silencing Lpcat3 expression has no effect on lipid and energy metabolism in HFD-fed mice.
A-D. Serum triglyceride (A) and NEFA (B) levels and liver triglyceride (C) and NEFA (D) levels of HFD-fed C57BL/6 mice injected with Con-ASO or Lpcat3-ASO. E. Expression of selected genes in the livers of HFD-fed C57BL/6 mice injected with Con-ASO or Lpcat3-ASO (n=12/group). F. Postprandial lipid absorption analysis in HFD-fed C57BL/6 mice injected with Con-ASO or Lpcat3-ASO (n=4–5/group). G. Representative histology of liver, eWAT and sWAT from HFD-fed C57BL/6 mice injected with Con-ASO or Lpcat3-ASO. Scale bar: 100 μm. H-I. Energy expenditure (EE) analyzed by regression analysis of covariance (ANCOVA). J. EE estimated by univariate generalized linear model (GLM) with body mass set to 39.14 g (average body mass of Con-ASO or Lpcat3-ASO injected mice on HFD). K-L. Physical activity (K) and respiratory exchange ratio (RER) (L) in HFD-fed Lpcat3fl/fl mice injected with Con-ASO or Lpcat3-ASO. Data are presented as means ± SEM. Statistical analysis was performed with Student’s t test (A-E), ANCOVA (H-I), and two-way ANOVA (F, J-L). *P < 0.05, **P < 0.01, ***P < 0.001, ****P < 0.0001.
Figure 5.
Figure 5.. Whole-body silencing Lpcat3 expression alters phospholipid composition in metabolic organs.
A. Expression of Lpcat3 in different tissues of HFD-fed C57BL/6 mice subcutaneously injected with control and Lpcat3 targeting ASOs (n=6–12/group). B-E. PC composition in the liver, muscle, WAT and BAT of HFD-fed mice injected with ASO (n=5/group). F. Serum FGF21 levels in HFD-fed mice injected with ASO (n=10/group). Data are presented as means ± SEM. Statistical analysis was performed with Student’s t test. *P < 0.05, **P < 0.01, ***P < 0.001, ****P < 0.0001.
Figure 6.
Figure 6.. Whole-body silencing Lpcat3 expression enhances insulin signaling in the liver and BAT.
A-D. Western blot analysis of p-AKT levels in the liver, muscle, WAT and BAT from ASO treated HFD fed mice. Mice were fasted overnight and retro-orbitally injected with insulin (1 U/kg BW) for 10 min. Data are presented as means ± SEM. Statistical analysis was performed with Student’s t test.
Figure 7.
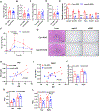
Figure 7.. Global suppression of Lpcat3 ameliorates obesity and insulin resistance in ob/ob mice.
A. Growth curve of ob/ob mice injected with Con-ASO or Lpcat3-ASO (n=8/group). B-D. Body weight (B), eWAT weight (C) and sWAT weight (D) of ob/ob mice injected with Con-ASO or Lpcat3-ASO. E. Daily food consumption of ob/ob mice injected with Con-ASO or Lpcat3-ASO. F-K. GTT, ITT and area under the curve (AUC) analysis in ob/ob mice injected with Con-ASO or Lpcat3-ASO (n=5–8/group). L-N. Fasting blood glucose (L), serum insulin levels (M) and HOMA-IR (N) of ob/ob mice injected with Con-ASO or Lpcat3-ASO. Data are presented as means ± SEM. Statistical analysis was performed with Student’s t test (A-F, H-I, K-N), and two-way ANOVA (G and J). *P < 0.05, **P < 0.01.
Figure 8.
Figure 8.. Global suppression of Lpcat3 has no effect on lipid metabolism in ob/ob mice.
A-D. Serum triglyceride (A) and NEFA (B) levels and liver triglyceride (C) and NEFA (D) levels of ob/ob mice injected with Con-ASO or Lpcat3-ASO. E. Expression of selected genes in the livers of ob/ob mice injected with Con-ASO or Lpcat3-ASO (n=7–8/group). F. Representative histology of liver, eWAT and sWAT from ob/ob mice injected with Con-ASO or Lpcat3-ASO. Scale bar: 100 μm. G-H. Energy expenditure (EE) analyzed by regression analysis of covariance (ANCOVA). I. EE estimated by univariate generalized linear model (GLM) with body mass set to 44.5 g (average body mass of Con-ASO or Lpcat3-ASO injected ob/ob mice). J-K. Physical activity (J) and respiratory exchange ratio (RER) (K) in ob/ob mice injected with Con-ASO or Lpcat3-ASO. L. Expression of Lpcat3 and lipases in eWAT of ob/ob mice injected with Con-ASO or Lpcat3-ASO (n=7–8/group). Data are presented as means ± SEM. Statistical analysis was performed with Student’s t test (A-E), ANCOVA (G-H), and two-way ANOVA (I-K). *P < 0.05, **P < 0.01, ****P < 0.0001.

References

    1. Magliano DJ, and Boyko EJ (2021) In IDF DIABETES ATLAS, Brussels
    1. Magliano DJ, Islam RM, Barr ELM, Gregg EW, Pavkov ME, Harding JL, Tabesh M, Koye DN, and Shaw JE (2019) Trends in incidence of total or type 2 diabetes: systematic review. BMJ 366, l5003. - PMC - PubMed
    1. Zheng Y, Ley SH, and Hu FB (2018) Global aetiology and epidemiology of type 2 diabetes mellitus and its complications. Nat Rev Endocrinol 14, 88–98 - PubMed
    1. Brown MS, and Goldstein JL (2008) Selective versus total insulin resistance: a pathogenic paradox. Cell Metab 7, 95–96 - PubMed
    1. Samuel VT, and Shulman GI (2016) The pathogenesis of insulin resistance: integrating signaling pathways and substrate flux. J Clin Invest 126, 12–22 - PMC - PubMed

Publication types

LinkOut - more resources