. 2023 Jan-Dec;15(1):2261509.
doi: 10.1080/19420862.2023.2261509. Epub 2023 Oct 12.

Delivery of the Brainshuttle™ amyloid-beta antibody fusion trontinemab to non-human primate brain and projected efficacious dose regimens in humans

Affiliations

Delivery of the Brainshuttle™ amyloid-beta antibody fusion trontinemab to non-human primate brain and projected efficacious dose regimens in humans

Hans Peter Grimm et al. MAbs. 2023 Jan-Dec.

Abstract

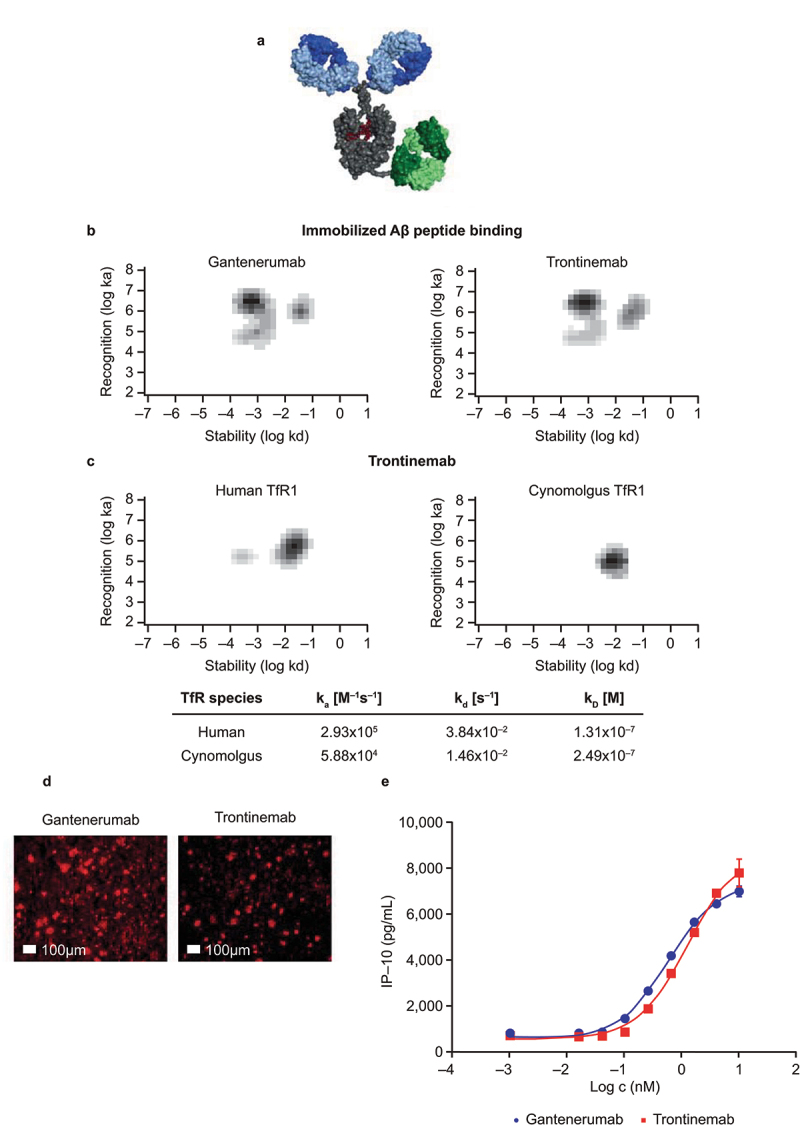
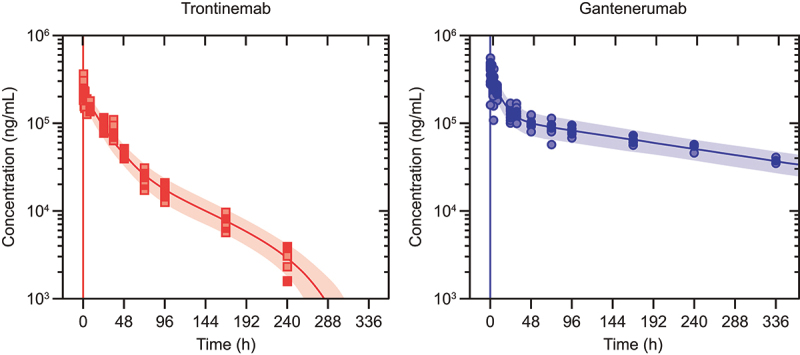
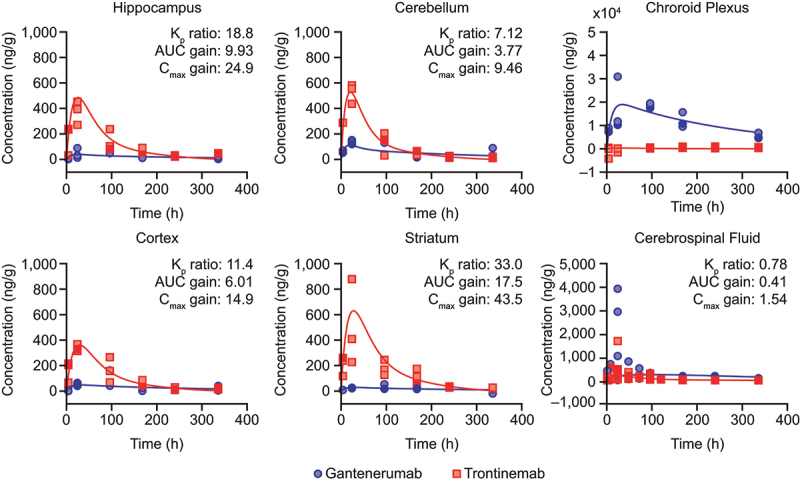
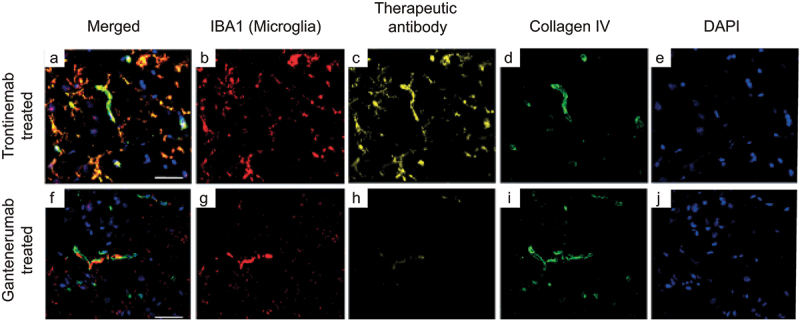
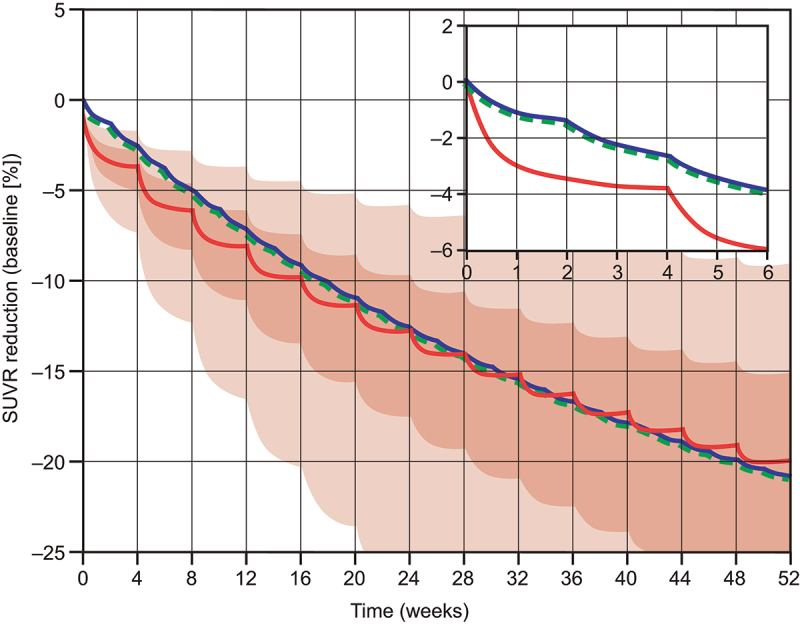
There are few treatments that slow neurodegeneration in Alzheimer's disease (AD), and while therapeutic antibodies are being investigated in clinical trials for AD treatment, their access to the central nervous system is restricted by the blood-brain barrier. This study investigates a bispecific modular fusion protein composed of gantenerumab, a fully human monoclonal anti- amyloid-beta (Aβ) antibody under investigation for AD treatment, with a human transferrin receptor 1-directed Brainshuttle™ module (trontinemab; RG6102, INN trontinemab). In vitro, trontinemab showed a similar binding affinity to fibrillar Aβ40 and Aβ plaques in human AD brain sections to gantenerumab. A single intravenous administration of trontinemab (10 mg/kg) or gantenerumab (20 mg/kg) to non-human primates (NHPs, Macaca fascicularis), was well tolerated in both groups. Immunohistochemistry indicated increased trontinemab uptake into the brain endothelial cell layer and parenchyma, and more homogeneous distribution, compared with gantenerumab. Brain and plasma pharmacokinetic (PK) parameters for trontinemab were estimated by nonlinear mixed-effects modeling with correction for tissue residual blood, indicating a 4-18-fold increase in brain exposure. A previously developed clinical PK/pharmacodynamic model of gantenerumab was adapted to include a brain compartment as a driver of plaque removal and linked to the allometrically scaled above model from NHP. The new brain exposure-based model was used to predict trontinemab dosing regimens for effective amyloid reduction. Simulations from these models were used to inform dosing of trontinemab in the first-in-human clinical trial.

Keywords: Alzheimer’s disease; Brainshuttle™; blood–brain barrier; gantenerumab; monoclonal antibody; pharmacokinetics.


Conflict of interest statement

HPG, VS, POF, KB, CH, SR, SS, RN, NJ were employees and shareholders of F. Hoffmann-La Roche Ltd at the time the work was completed.

MS, SIJ, PR, TS, UG, MH, AZ, JN were employees of Roche Diagnostics GmbH and shareholders of F. Hoffmann-La Roche Ltd at the time the work was completed.

Figures

Figure 1.
Figure 1.
Characterization of trontinemab plaque binding. (a) image of trontinemab’s molecular format. Green = anti-TfR1 cross-Fab; gray = Fc component of IgG1; blue = Fab arms of IgG1; red = glycan. (b) rate constant maps showing the binding kinetics of gantenerumab (left) and trontinemab (right) binding to immobilized Aβ peptide. Darker areas represent higher binding of the mAbs to the immobilized Aβ peptide. Biacore SPR assay interaction maps were generated utilizing the Ridgeview Tracedrawer software for Figure 1b,c. (c) rate constant maps showing the kinetics of trontinemab binding to human TfR1 (left) and cynomolgus TfR1 (right) at 25°C, Biacore SPR assay. Darker areas represent higher binding of the trontinemab to the TfR1 species. (d) gantenerumab (left) and trontinemab (right) binding to human AD brain sections. Red represents the presence of the respective mAb. Staining of the mAbs was conducted by incubation with a secondary antibody (goat anti-human IgG(H+L)/AlexaFluor555, MolecularProbes, A21433) followed by nuclei staining (DAPI, 1 μg/mL in PBS), with intermediary wash buffer rinsing. (e) plot showing the induction of induced protein 10 (IP-10) release from activated U937 monocytes by gantenerumab (red squares) and trontinemab (blue circles). Aβ, amyloid-beta; DAPI, 4′,6-diamidino-2-phenylindole; ELISA, enzyme-linked immunosorbent assay; IgG, immunoglobulin G; ka, on-rate; kd, off-rate; KD, equilibrium dissociation constant; PBS, phosphate buffer saline; mAb, monoclonal antibody; TfR1, transferrin receptor 1.
Two scatter plots of concentration (ng/mL) vs time (h) for trontinemab versus gantenerumab showing observed plasma concentrations overlaid on pharmacokinetic model prediction distributions. Parameters for trontinemab were typical for monoclonal antibodies, except for clearance, which was higher than the typical range in cynomolgus monkeys (0.21–0.5 mL/h/kg). In particular, with 1.01 mL/h/kg, trontinemab had a roughly two-fold higher clearance than gantenerumab (0.537 mL/h/kg) in this study.
Figure 2.
Observed plasma concentrations overlaid on pharmacokinetic model prediction distributions. Observed plasma concentrations (dots) after single IV administration of trontinemab (left, 10 mg/kg) and gantenerumab (right, 20 mg/kg) overlaid on pharmacokinetic model prediction distributions shown as median (lines) and 90% prediction intervals (shaded areas). Plasma concentrations were sampled at 0.083, 0.25, 0.5, 1, 2, 4, 8, 24, 31, 48, 72, 96, 168, and 240 h post-dose. For trontinemab, accelerated clearance is observed at late time points, presumably caused by ADAs and with negligible impact on total exposure (four observations for the 336-hour time point with median concentration of 69 ng/mL lie outside of the plot range). ADA, anti-drug antibodies; h, hour; IV, intravenous.
Six scatter plots showing observed concentrations of gantenerumab and trontinemab in the hippocampus, cerebellum, choroid plexus, cortex, striatum, and cerebrospinal fluid with model simulations in non-human primates. The improvement of the brain uptake as quantified by brain distribution coefficient provides evidence that the Brainshuttle™ concept successfully overcomes the blood–brain barrier in vivo.
Figure 3.
Observed brain concentration of gantenerumab (blue circles) and trontinemab (red squares) overlaid with model simulations (lines) in NHPs. Plots showing concentration of the mAb in the hippocampus, cerebellum, choroid plexus, cortex, striatum, and cerebrospinal fluid up to 336 h post-dose. For graphical representation, observed concentrations were corrected for the contribution of residual plasma using the naïve approach, leading to some concentrations being displayed with negative values. Kp ratio, AUC gain, and Cmax gain were not assessed for the choroid plexus. AUC, area under the curve; Cmax, maximum concentration; Kp, brain distribution coefficient; h, hour; NHP, non-human primate.
Immunofluorescent images showing the localization of microglia, gantenerumab, vascular basement membrane and nuclei staining in cynomolgus cortex brain sections 24 h after a single IV injection of trontinemab or gantenerumab. At 24 h post-dose, gantenerumab is limited to vasculature, whereas trontinemab is present in the parenchyma in addition to vasculature.
Figure 4.
Triplex immunofluorescence of cynomolgus cortex brain sections 24 hours after a single IV injection of trontinemab (top) or gantenerumab (bottom). Immunofluorescent images showing the localization of microglia (IBA1, red), therapeutic antibody (anti-idiotypic) (yellow), vascular basement membrane (collagen IV, green) and nuclei (DAPI, blue) staining in brain sections 24 hours after trontinemab or gantenerumab dosing. At 24 hours post-dose, gantenerumab is limited to vasculature (co-localization with collagen IV), whereas trontinemab is present in the parenchyma (IBA1 co-localization) in addition to vasculature. Immunostaining was performed using the Ventana Discovery Ultra automated stainer. DAPI, 4′,6-diamidino-2-phenylindole; IBA1, ionized calcium-binding adaptor protein.
A line graph showing a model-based comparison of amyloid load reduction, as measured by PET SUVR, over 52 weeks in the cortex following dosing with a cumulative dose of 600 mg gantenerumab every 4 weeks or with 210 mg of trontinemab every 4 weeks. The new brain exposure-based PK/PD model yielded almost identical results to the original model for gantenerumab, with small differences only apparent at short timescales, but with identical long-term trends. The amyloid reduction obtained with gantenerumab was predicted to be matched by trontinemab, with effects accumulating to a 20% reduction over 1 year.
Figure 5.
Model-based comparison of amyloid load reduction (PET SUVR) in the cortex following dosing with a cumulative dose of 600 mg gantenerumab every 4 weeks (300 mg IV of gantenerumab every 2 weeks, blue line) or with 210 mg of trontinemab every 4 weeks (red line and shaded confidence bands). Plots showing simulated SUVR reduction over time with an inset plot showing the dynamics for the first 6 weeks. For gantenerumab, simulations with the original plasma-exposure-driven model (dashed green line) overlay closely with the transformed brain-exposure-driven model (blue line). For the selected dosing regimen, similar amyloid reduction was predicted for trontinemab and gantenerumab over 1 year. Translational uncertainty (shown as 90% [lighter red] and 50% [darker red] confidence bands shaded in red) is illustrated assuming a 90% probability that the true typical values of the plasma clearance and the brain distribution coefficient are within two-fold of the predicted values based on log-normal distributions. Inset shows the dynamics for the first 6 weeks. IV, intravenous; PET, positron emission tomography; SUVR, standardized uptake value ratio.

References

    1. Wang S, Mims PN, Roman RJ, Fan F.. Is beta-amyloid accumulation a cause or consequence of Alzheimer’s disease? J Alzheimers Parkinsonism Dement. 2016;1:007. - PMC - PubMed
    1. Alzheimer’s Association . Alzheimer’s disease facts and figures. Alzheimer’s & Dementia. 2021;17(3):327–14. doi:10.1002/alz.12328. - DOI - PubMed
    1. US Food and Drug Administration (FDA) . FDA’s decision to approve new treatment for Alzheimer’s disease [press release]; 2021. June 7 [accessed 2023 June 28]. https://www.fda.gov/drugs/news-events-human-drugs/fdas-decision-approve-....
    1. US Food and Drug Administration (FDA) . FDA grants accelerated approval for Alzheimer’s disease treatment [press release]; 2023. January 6 [accessed 2023 June 28]. https://www.fda.gov/news-events/press-announcements/fda-grants-accelerat....
    1. Aging NNIo . NIA statement on report of lecanemab reducing cognitive decline in Alzheimer’s clinical trial; 2023. [accessed 2023 March 16]. https://www.nia.nih.gov/news/nia-statement-report-lecanemab-reducing-cog...

Publication types